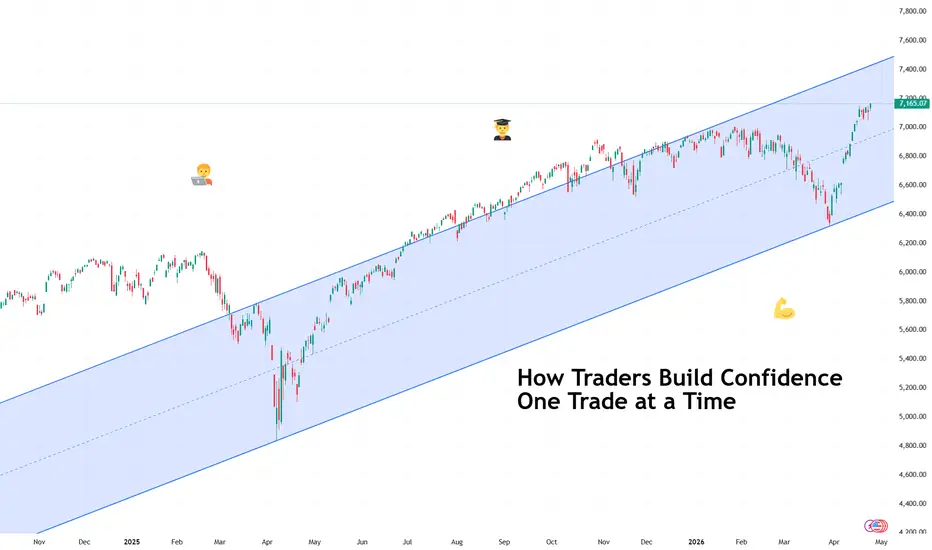
How Traders Build Confidence One Trade at a TimeAnd how you can too.
🧭 Confidence Starts Smaller Than You Think
Confidence in trading rarely arrives as a dramatic breakthrough moment. It usually begins quietly, somewhere between a well-timed entry and a disciplined exit that followed the plan exactly as intended.
Many traders expect confidence to appear after a winning streak. In practice, it grows from consistency rather than excitement. One correctly executed trade builds trust. Two reinforce it. Ten start to feel like structure instead of luck.
Confidence forms when your process begins to feel familiar.
📊 The First Ingredient Is a Repeatable Plan
A repeatable plan means knowing what conditions justify entering a trade and what conditions suggest waiting. Traders sometimes call this a ‘setup,’ which simply describes a recognizable pattern or environment that increases probability.
When traders follow setups consistently, outcomes become easier to interpret. A losing trade feels manageable because it still followed the rules. A winning trade becomes meaningful because it confirms the approach.
Confidence grows faster when decisions feel intentional rather than improvised. (And yes, that includes no revenge trading .)
🧠 Small Wins Train the Mind
Early confidence rarely comes from large profits or the hot trade of the day . It develops through smaller moments that prove discipline works. Waiting patiently for a setup. Respecting position size. Closing a trade according to plan instead of emotion.
These actions build psychological stability. Stability is a big one because markets constantly test patience, timing, and expectations. Sometimes, more than most people can handle.
Over time, repetition turns uncertainty into familiarity, and familiarity makes decisions calmer.
⏳ Reviewing Trades Builds Real Clarity
Professional traders treat review as part of the strategy rather than an afterthought. Looking back at past trades helps identify patterns that charts alone cannot reveal.
A trading journal, which could simply be a record of entries, exits, and reasoning, often becomes one of the most powerful confidence tools available. It transforms memory into evidence. Evidence strengthens conviction.
Confidence feels stronger when supported by observation rather than guesswork.
📉 Losses Still Play a Role
Losses contribute to confidence when they occur inside a structured plan. A controlled loss confirms that risk management is working as intended. Risk management refers to limiting how much capital is exposed on any single idea so that no individual trade can cause lasting damage.
Traders who manage risk effectively begin trusting their ability to stay consistent across changing market conditions (think a wild earnings season or surprise economic data ).
🚀 Confidence Changes How Trades Feel
As confidence grows, hesitation begins to fade. Entries feel clearer. Position sizes feel more appropriate. Decisions arrive with less urgency and more perspective.
Confidence isn’t predicting the market correctly every time — no one can do that, not even your favorite hedge fund bro. It means understanding your approach well enough to execute it without second-guessing each move.
🎁 OK, But How?
Confidence develops through repetition, structure, and reflection rather than dramatic breakthroughs. Each disciplined trade adds another layer of trust between the trader and the process.
Over time, those layers become something powerful: the quiet certainty that you can navigate uncertainty one decision at a time.
Off to you : How do you know you’ve developed enough confidence to be a successful trader? Share your approach in the comments!
Community ideas
GOLD: Waiting For The Buy Model To Set UpIn this Weekly Market Forecast, we will analyze Gold for the week of April 27 - May1st.
Gold has been going no where but sideways. But I believe that changes this week.
Not interested in shorting this market. Not with fundamentals supporting higher prices at the moment.
FOMC is Wednesday, and my weaken the USD. That would allow GOLD to surge, as it is struggling to move lower from the -FVG.
Patience will allow the market to unfold, and give me a queue to enter a valid buy model.
Enjoy!
May profits be upon you.
Leave any questions or comments in the comment section.
I appreciate any feedback from my viewers!
Like and/or subscribe if you want more accurate analysis.
Thank you so much!
Disclaimer:
I do not provide personal investment advice and I am not a qualified licensed investment advisor.
All information found here, including any ideas, opinions, views, predictions, forecasts, commentaries, suggestions, expressed or implied herein, are for informational, entertainment or educational purposes only and should not be construed as personal investment advice. While the information provided is believed to be accurate, it may include errors or inaccuracies.
I will not and cannot be held liable for any actions you take as a result of anything you read here.
Conduct your own due diligence, or consult a licensed financial advisor or broker before making any and all investment decisions. Any investments, trades, speculations, or decisions made on the basis of any information found on this channel, expressed or implied herein, are committed at your own risk, financial or otherwise.

Fundamental and Technical Signals Align in NVDAFundamental and Technical Signals Align in NVDA
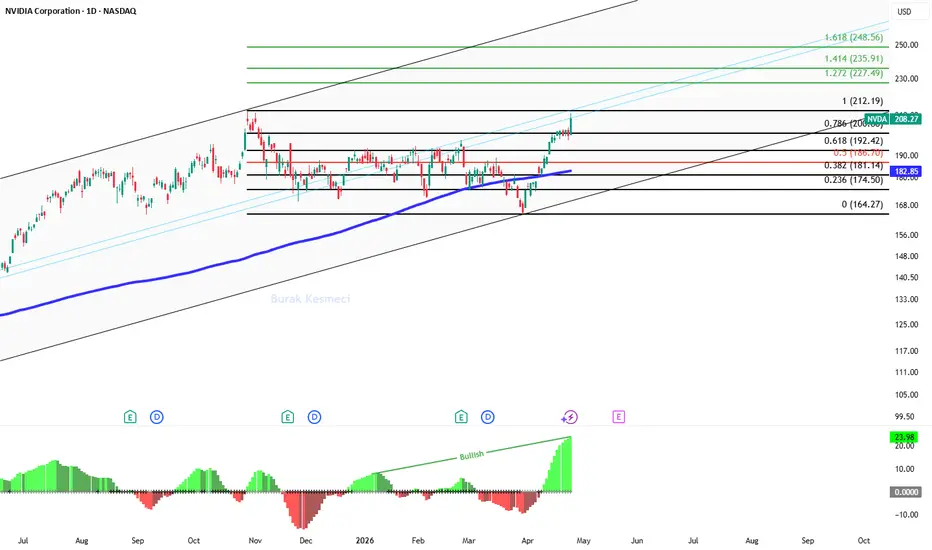
NVDA at $208.27 is displaying a rare technical-fundamental convergence with both valuation compression and squeeze momentum breakout pointing in the same direction.,
What story is the fundamental side telling?
With Wall Street analysts forecasting 73.9% earnings growth for NVDA, the current P/E ratio of 40.5 standing 2.27 times higher than the forward P/E of 17.8 indicates an expected valuation compression exceeding 50% in the coming period, and this figure presents strong repricing potential for a stock positioned significantly below the Nasdaq 100's forward P/E average of 22.4. The $5 trillion market cap company being backed by 44 analysts with a "Strong Buy" recommendation signals that institutional consensus shares this valuation compression expectation and strengthens the argument that profitability growth has not yet been fully reflected in prices.
The forward P/E remaining below the index's 5-year average of 25 reveals that NVDA is still priced in a discounted zone despite its growth story.
What signal is technical momentum giving?
With price trading 13.9% above the 200-day moving average at $182.85, the squeeze momentum indicator's jump from 0 to 23.98 shows the volatility compression breaking to the upside, and this breakout typically serves as a precursor to strong trend-directional moves. The $11.14 daily movement within the $199.81-$210.95 band (5.6% intraday volatility) signals the squeeze explosion gaining momentum, and the current price at $208.47 maintains the strength of the upward structure by positioning significantly above the 0.786 fibonacci level at $200.
Volume-wise, the 214 million lots traded exceeding the average indicates continued institutional participation, and the $181-$192 consolidation band now forming a strong support foundation reduces the pullback risk in upward price movements.
Why does this combination matter?
The valuation compression scenario supported by a 73.9% earnings growth expectation on the fundamental side, when combined with squeeze momentum breakout on the technical side, creates a rarely seen structure, and this situation forms a profile that can simultaneously attract the interest of both value and momentum investors.
The forward P/E being at 17.8 shows that even if prices rise to the $227-$235 band, assuming earnings expectations materialize, the valuation would not move into an excessively expensive zone, and this calculation draws a picture consistent with Fibonacci's upper extension targets. The squeeze momentum's "Bullish" trend signal combined with the 23.98 reading reveals that the uptrend wave starting from $164.27 maintains its acceleration potential, and the fundamental outlook supported by the consensus of 44 analysts confirms there is a strong fundamental foundation behind the technical breakout.
Which levels are critically important?
If persistence above the $212.19 resistance is achieved, both continuation of squeeze momentum and progress toward fundamental valuation targets can be expected, in which case the $227.49 and $235.91 levels could come into play as upside targets, however declines below the $200 level where the 0.786 fibonacci support breaks could signal weakening squeeze momentum, and in that scenario the $192.42 level could serve as the first test point.
On the fundamental side, if 2026 earnings figures come in lower than expected, the forward P/E rising from the 17.8 level could eliminate the valuation advantage, and in that case the 200-day moving average at $182.85 on the technical side could be expected to emerge as a critical support area.
Thanks for reading.
US500 and the Trap of Shorting StrengthMarkets pushing into new highs during periods of intense uncertainty can feel uncomfortable. When headlines are heavy and price continues to grind higher, the instinct for many is to start looking for a top, questioning whether the move has gone too far.
In practice, strong markets rarely reverse simply because they feel ‘detached from reality’. More often, they continue to trend, and it’s the traders trying to fade that strength too early who end up on the wrong side of the move.
The mistake most traders make
There’s a tendency to confuse discomfort with opportunity. When price is holding near highs while macro risks dominate the narrative, it can create the impression that the market is out of sync with reality. That belief often leads to premature short positioning without any real confirmation from price.
The issue is that markets don’t turn because they should. They turn when order flow shifts, and that shift needs to be visible in the price action. Until then, strength is not something to fight, it’s information. A breakout that holds, a trend that continues to print higher highs, and a market that absorbs negative headlines without breaking down all point to underlying demand rather than exhaustion.
This is where many traders get caught out. They lean on the narrative and anticipate a reversal, rather than waiting for the market to show signs of one. In doing so, they repeatedly step in front of a trend that hasn’t finished.
What the market is actually saying
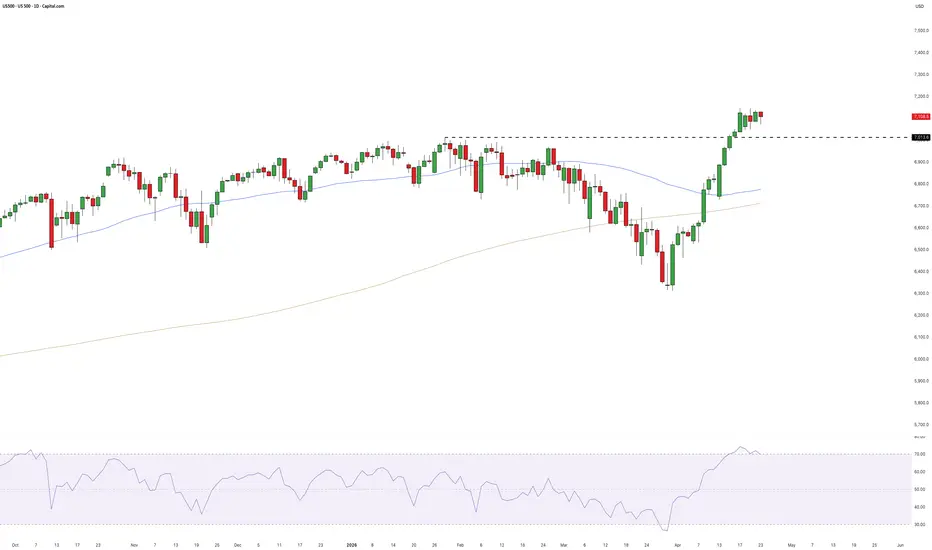
Looking at the current structure in the S&P 500, price is still behaving constructively. The market has pushed into new highs and, importantly, is holding above the breakout area. There hasn’t been a meaningful rejection or any shift in structure that would suggest sellers are gaining control.
That doesn’t mean the backdrop is clean. Far from it. Geopolitical tensions remain elevated, negotiations continue to stall, and energy markets are still feeding through into inflation expectations and rate sensitivity. But the key point for traders is how price is responding to that backdrop.
US500 Daily Candle Chart
Past performance is not a reliable indicator of future results
Even with fresh headlines around the extension of the ceasefire and the continued build-up in the region, the reaction in equities has been relatively contained. There’s been a slight softening, but no real deterioration in structure. If anything, it appears to reinforce the idea that dips are still being absorbed rather than extended.
That’s the nuance that matters. The market isn’t ignoring what’s happening, it’s simply not responding to it in a bearish way. Until that behaviour changes, the path of least resistance remains higher, whether that feels comfortable or not.
What needs to change before a short makes sense
If the aim is to trade a turn rather than guess one, the focus has to shift from opinion to observable behaviour. A strong market only becomes a short when there’s clear evidence that the underlying strength is starting to fade.
That evidence tends to show up through a combination of signals:
• A breakout that fails and closes back within its prior range
• A sequence of lower highs after a push to new highs
• Momentum divergence aligning with weakening price structure
Even then, it’s not just about spotting the shift, it’s about timing the entry. Rather than reacting to the first sign of weakness, it often pays to wait for a clear trigger. That might be a decisive pause or small consolidation following a failed move or a break below a trendline, with risk defined above the recent high and targets aligned with the next area of support. At that point, the structure itself defines the key reference levels on both sides.
The key is that none of this is anticipatory. It’s reactive. The market has to show its hand first.
Building a repeatable process
The real challenge with counter-trend trading isn’t spotting the idea, it’s having the discipline to wait for it to set up properly. Strong trends naturally create the urge to act early, particularly when the narrative feels compelling.
A more consistent approach is to treat strength as a filter rather than a signal. When the market is trending cleanly and holding above key areas, the default stance is to respect that strength. Only when the structure begins to shift, through failed moves and weakening momentum, does the focus turn to opportunities on the other side.
This creates a simple but effective framework:
• Recognise when the market is trending and avoid the temptation to fade it too early
• Wait for clear signs of structural change
• Act only once price confirms the shift
It’s not about catching the exact top. It’s about aligning with what the market is doing, not what it feels like it should be doing.
Disclaimer: This is for information and learning purposes only. The information provided does not constitute investment advice nor take into account the individual financial circumstances or objectives of any investor. Any information that may be provided relating to past performance is not a reliable indicator of future results or performance. Social media channels are not relevant for UK residents.
Spread bets and CFDs are complex instruments and come with a high risk of losing money rapidly due to leverage. 81.31% of retail investor accounts lose money when trading spread bets and CFDs with this provider. You should consider whether you understand how spread bets and CFDs work and whether you can afford to take the high risk of losing your money.
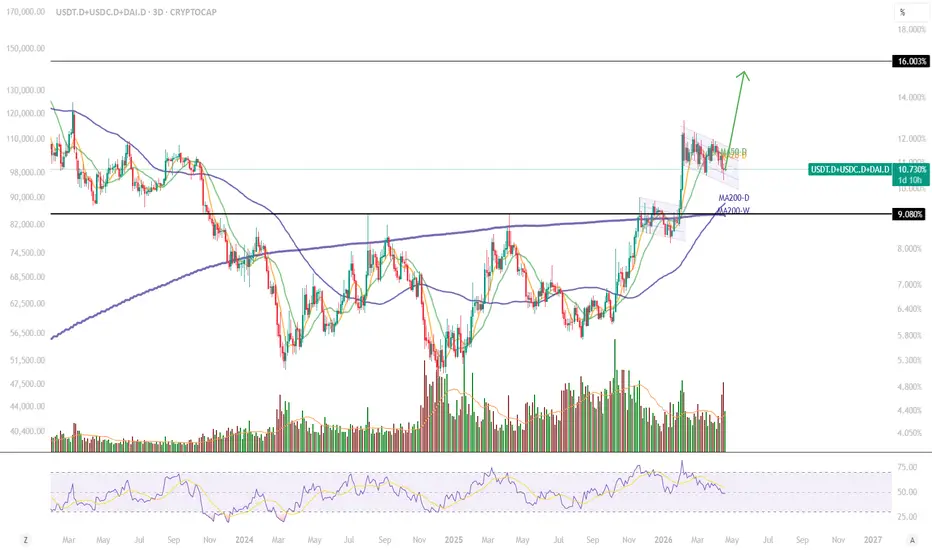
Stablecoins in 2026. What need know?A stablecoin is a crypto asset pegged to a real-world value (most commonly → USD) 👉 1 stablecoin ≈ 1 dollar
But in 2026, stablecoins are no longer just “digital dollars”
They are:
• liquidity backbone of the crypto market
• settlement layer for trading
• a tool for storing capital outside of banks
⚖️ How it works
Behind every stablecoin there is a different model of backing. And this is where the real difference lies. Key stablecoins to know:
💲 CRYPTOCAP:USDT.D
The largest and most used stablecoin
Backing:
• cash
• US treasuries
• other assets
Reality: USDT survived regulatory pressure, FUD cycles and bank crises. And still remains #1 in liquidity
👉 Main risk its ower transparency vs competitors
💲 CRYPTOCAP:USDC.D
Issued by Circle (in partnership with Coinbase)
Circle is a US-based financial company
operating under regulatory oversight
Backing:
• cash
• short-term US treasuries
Reality: more transparent, regular reports and oriented towards institutional clients
👉 Main risk its dependence on the banking system (there was already a stress test in 2023)
💲 CRYPTOCAP:DAI.D
Decentralized stablecoin. No central issuer. Everything is controlled by smart contracts
Backing:
• crypto collateral (ETH, stETH, USDC, etc.)
Reality: overcollateralization → to mint $1 DAI, you often need $1.5–2 in collateral. Inefficient capital usage
👉 Main risk its dependence on the crypto market (in extreme market conditions DAI can deviate from $1) . Liquidation risk → if collateral drops → positions get liquidated
Of course, there are a few more stablecoins on the market, but they are not at all worthy of your attention.
🤑 Why stablecoins matter
They allow you to:
• exit volatility without leaving crypto
• store capital outside banks
• move funds instantly worldwide
But stablecoins are no longer “risk-free” 🎲
Each type has its own risk model:
• centralized → counterparty risk
• decentralized → collateral risk
• synthetic → strategy risk
✔️ In any case, stablecoins are safer than any bank. With stablecoins, you can create your own bank in your pocket and manage your funds independently.
Learn more in our article on crypto wallets (related publications)
_____
👉 Want to get more useful information without the fluff? Follow for real insights and strategies 🚀
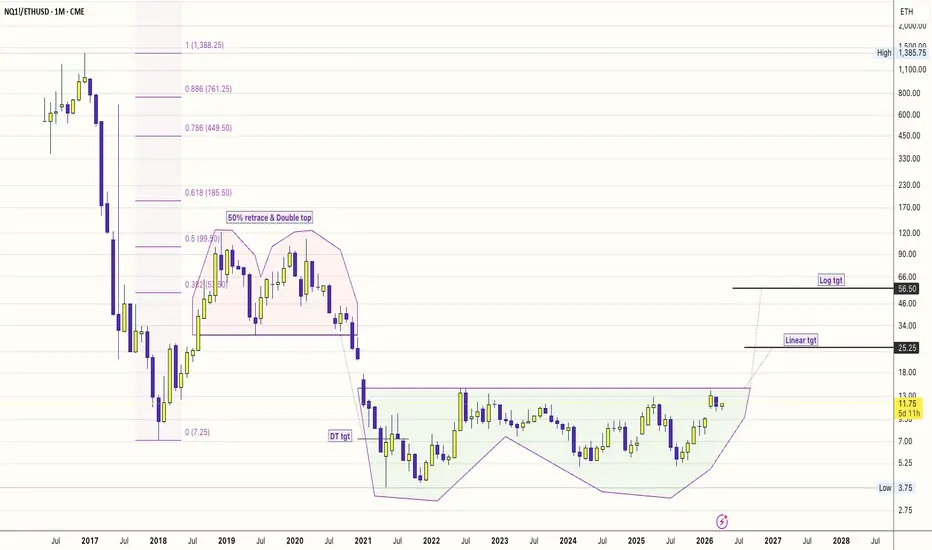
AI Infra > DeFi Infra: The 4-Year Relative Strength Breakout!1. The "Big Base" Logic
Observation: A 4-year base (2022–2026) in the NQ/ETH ratio.
This isn't just a price move; it’s a liquidity migration.
#DeFi (Ethereum) was the hero of the low-interest-rate era (2020-2021).
But in 2026, the "Real World" needs GPUs, data centers, and power grids.
The Nasdaq is the ticker for that physical reality.
The Trigger: Intel’s +24% move and Nvidia’s Blackwell dominance are the fundamental "fuel" for this technical breakout.
2. AI Infra (Hardware) vs. DeFi (Software)
The "Physical" Advantage: AI infra is now a $2.5 Trillion market.
It involves tangible assets (Chips, Fiber, Cooling).
The "Protocol" Fatigue: DeFi has become hyper-fragmented. There are too many L2s and protocols competing for the same liquidity. AI Infra, however, is a bottleneck economy—there is only so much compute to go around.
3. Key Levels
The Pivot: 13.00. A weekly close above this "Neckline" completes the 4-year U-Base.
The Targets: * Target 1 (25.25): The "Linear" target. This assumes Nasdaq continues to grow while ETH stays stagnant—a "repricing of utility."
Target 2 (56.50): The "Blue Sky" log target. This represents a world where AI agents become the primary users of the internet, making traditional human-centric DeFi secondary.
#NQ1! #ETHUSD
#NVDA, #INTC, #BTCUSD
#AIInfrastructure #RelativeStrength #DePIN #MacroEconomy #Semiconductors
In 2026, we’ve moved from "training" models to "running" them (Inference).
Running them requires constant, stable hardware—exactly what the Nasdaq companies are building.
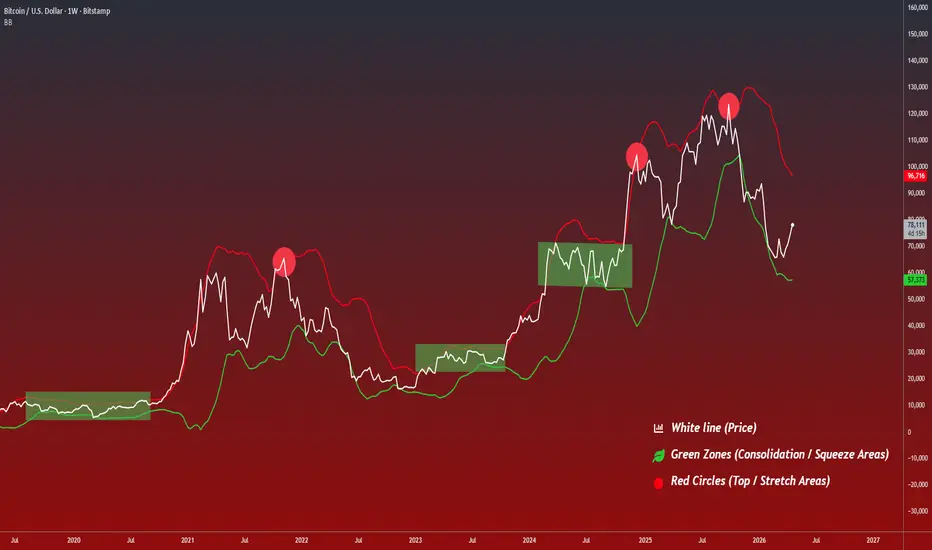
Understanding Bitcoin’s Price Behavior with Bollinger BandsHello mates, have you noticed how Bitcoin often makes its biggest moves after periods of silence?
What looks like inactivity is rarely random it is usually preparation, so let’s understand what’s really happening.
Most traders approach Bollinger Bands with a very simplified mindset, often reducing it to overbought and oversold signals. While this interpretation is widely used, it fails to capture how markets actually behave in real conditions. Bitcoin does not react mechanically to indicators; instead, it moves through repeating cycles of volatility, expansion, and contraction. Bollinger Bands, when understood correctly, do not predict direction but provide a framework to observe how these cycles unfold over time.
At a structural level, Bollinger Bands expand and contract based on volatility. When volatility decreases, the bands tighten and price action becomes compressed within a narrow range. When volatility increases, the bands widen and price begins to move with momentum. This expansion and contraction is not random it reflects the natural rhythm of the market. In Bitcoin, this rhythm becomes even more pronounced due to its speculative nature and strong participation cycles.
One of the most important aspects to understand is the relationship between Bitcoin’s price and Bollinger Bands during different phases of the market. During trending environments, price does not simply reverse upon touching the upper or lower band. Instead, it often “rides” the band, especially in strong bullish phases where price consistently interacts with or remains near the upper band. This reflects sustained momentum rather than exhaustion. On the other hand, during ranging or low volatility conditions, price tends to oscillate between the bands without clear direction. This dynamic relationship shows that Bollinger Bands are not static boundaries, but adaptive structures that respond to how Bitcoin behaves in different environments.
Periods where the bands contract tightly are often misunderstood as unimportant or inactive. In reality, these phases represent preparation. Price moves sideways, volatility drops, and the market appears quiet. However, this is typically where accumulation or re-accumulation takes place. Larger participants gradually build positions while retail traders lose interest due to the lack of movement. What looks like stagnation on the surface is often the foundation for the next major move.
As the market transitions out of this low volatility phase, expansion begins. The bands start to widen, and price breaks out of its range with increasing momentum. This is the phase where the market shifts from preparation to execution. The move that was previously hidden within a tight consolidation becomes visible, attracting more participants. It is important to note that by the time expansion is clearly visible, a significant portion of the move may already be underway.
In the later stages of a trend, price often stretches toward the outer bands, particularly the upper band in bullish conditions. This behavior is frequently misinterpreted as an immediate signal of reversal. However, it is more accurately a reflection of strong momentum combined with increasing volatility. Over time, as the trend matures, these extensions can begin to show signs of weakening. Price may still remain elevated, but the ability to sustain further expansion starts to diminish. This is where exhaustion or distribution-like behavior can emerge, often leading to slower price action or eventual corrections.
A common mistake among traders is to treat Bollinger Bands as direct trading signals rather than contextual tools. Assuming that every upper band touch is a sell signal or every lower band touch is a buy signal ignores the broader structure of the market. Similarly, dismissing low volatility phases as irrelevant can lead to missed opportunities, as these are often the periods where the most strategic positioning occurs.
A more refined approach is to interpret Bollinger Bands through the lens of behavior. A squeeze should be viewed as a phase where potential energy is building within the market. Expansion should be understood as the release of that energy, confirming that a move is in progress. Extended interaction with the bands should not be immediately faded, but rather analyzed in the context of trend strength and maturity.
The chart illustrates this repeating cycle clearly. The highlighted consolidation zones show how periods of low volatility consistently precede strong expansions. These expansions then transition into phases where price begins to stretch and gradually lose momentum. This sequence compression, expansion, and eventual exhaustion repeats across different timeframes and market conditions, forming a recognizable pattern in Bitcoin’s behavior.
Ultimately, Bollinger Bands are most effective when used to understand the timing and nature of market activity rather than to predict exact turning points. They provide insight into when the market is quiet, when it is becoming active, and when it may be approaching a stage of diminishing momentum. This perspective allows traders to shift from reacting to price movements toward anticipating structural changes.
In simple terms, value is often built when the market is quiet, and it becomes visible when the market expands. Recognizing this transition is what separates surface-level indicator usage from a deeper understanding of market behavior.
Volatility doesn’t appear randomly it expands after it has been quietly compressed. If you can read that transition, you stop chasing moves and start anticipating them.
Thanks for reading.
Regards- Amit.
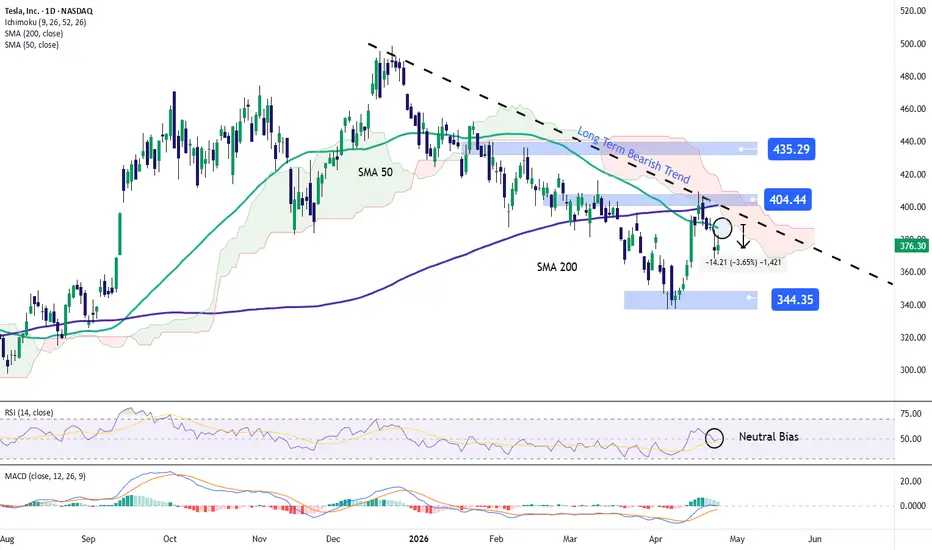
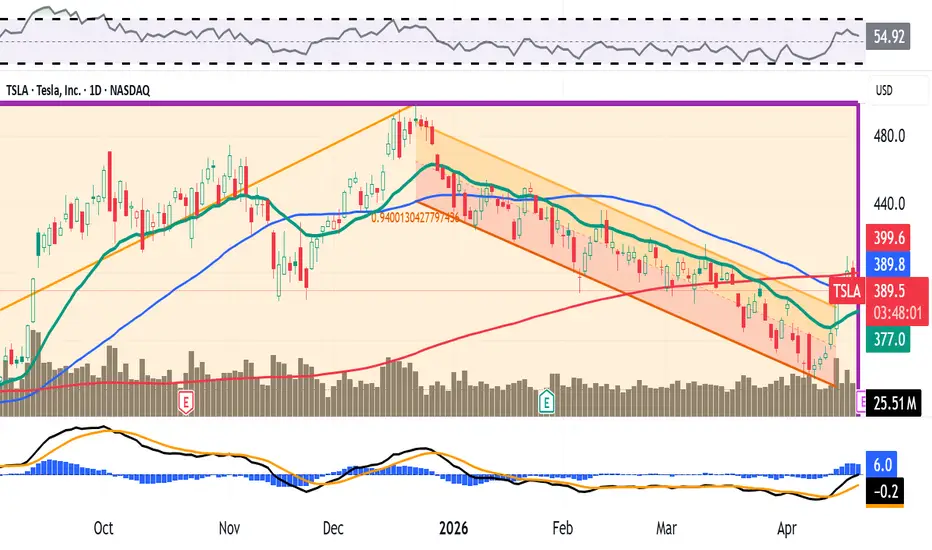
Tesla remains weak below the $400 levelIt has been a difficult trading week for Tesla, as the stock has posted a decline of more than 3.00% on average over the last three sessions. This move came after the company’s earnings release.
Despite reporting earnings per share of 41 cents versus 37 expected, and revenue of $22.39 billion compared to $22.64 billion projected, the main catalyst behind the selling pressure has been concerns about slowing demand and the need to lower prices to stabilize orders. These challenges have yet to be resolved and, for now, have weighed on market confidence in the short term. In this context, weakness could remain a key theme in the coming sessions.
Downtrend remains intact: Recent price action in Tesla continues to respect a well-defined bearish trendline that has been in place since December 2025. So far, there has not been a strong enough buying move to challenge this structure, keeping it as the most relevant technical factor. As long as selling pressure remains in control, the extension of this trend could continue to gain relevance in the coming weeks.
RSI: The RSI indicator is currently hovering around the 50 level, reflecting a balance between buying and selling forces. If this dynamic persists, indecision could become more evident in price action.
MACD: A similar pattern can be observed in the MACD, where the histogram remains close to the zero level, indicating a balance in short-term moving average strength. This reinforces the idea of a neutral phase in the market.
Key levels to watch:
$435: A level of recent highs located above the current bearish trendline. A move toward this area could open the door to the formation of a new bullish trend in the coming weeks.
$400: A key psychological level that aligns with the bearish trendline and the 50 and 200-period moving averages. This is the most important barrier on the chart, and sustained moves above it could invalidate the downtrend and support a more dominant bullish bias.
$344: A level corresponding to the 2026 lows. A move toward this area would reinforce selling pressure and could extend the current bearish trend in the short term.
Written by Julian Pineda, CFA, CMT – Market Analyst
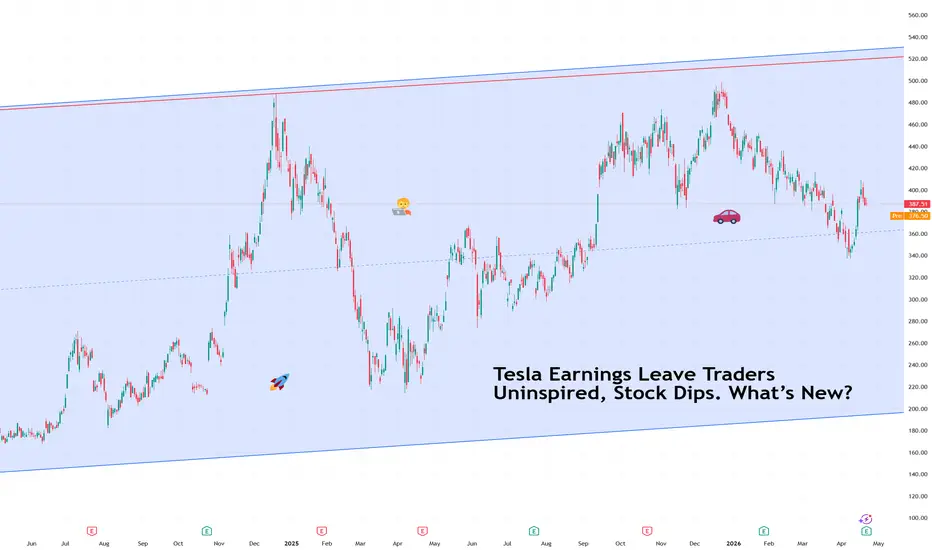
Tesla Earnings Leave Traders Uninspired, Stock Dips. What’s New?Strong numbers arrived. Bigger questions arrived with them.
Tesla NASDAQ:TSLA reported quarterly earnings that technically cleared expectations. Revenue reached $22.4 billion, slightly ahead of forecasts, while adjusted earnings per share landed at $0.41, above the expected $0.36 .
Free cash flow surprised to the upside as well, coming in at $1.4 billion instead of the loss analysts anticipated. On paper, this looked like the kind of report that normally lifts a stock.
Shares did rise briefly in after-hours trading. Then the mood changed during the earnings call. In other words, the earnings season is here and it’s getting heated.
📉 Call Shifted the Narrative
Markets rarely react only to numbers. Guidance often matters more than the quarter itself. During the call, Elon Musk outlined plans for a major expansion in capital spending tied to robotaxis, robotics, trucks, and artificial intelligence infrastructure.
Tesla now expects roughly $25 billion in capital expenditure this year, up from prior guidance of $20 billion. But also, a big increase from last year’s $8.5 billion.
Investors quickly recognized what that means. Higher spending today usually delays profits tomorrow. Enthusiasm faded almost immediately.
🤖 Company Is Changing Shape
Tesla continues to move away from its origin story as a pure electric vehicle manufacturer. The retirement of Model S and Model X reflects that shift. The focus now centers on Cybercabs, humanoid robots, AI chips, and autonomous logistics.
Meanwhile, operating profit rose sharply, climbing 136% year over year to $941 million. Yet the conversation increasingly revolves around what Tesla might become rather than what it currently sells.
🏗️ Capex Is the New Headline
Capital expenditure refers to money spent building factories, infrastructure, and future products. It signals ambition, though it also signals patience is required.
Tesla’s quarterly capex reached $2.5 billion, already elevated. Musk indicated the pace will accelerate significantly as the company develops robotics platforms and builds a massive chip facility tied to its autonomy strategy.
Big Tech rivals plan to spend roughly $660 billion this year on similar infrastructure. Tesla clearly wants a seat at that table.
🚕 Robotaxis Still Live in the Future
The robotaxi story remains central to Tesla’s valuation narrative. The company continues running limited pilot programs in parts of Texas, though Musk indicated meaningful revenue from autonomous ride networks will likely arrive next year rather than immediately.
Investors tend to discount future earnings into today’s stock price. When timelines stretch, patience becomes part of the trade.
🛰️ Musk Ecosystem Expands
Tesla’s strategic orbit (pun intended) continues overlapping with Musk’s broader technology network. The company invested $2 billion into xAI earlier this year, and that stake later converted into equity connected to SpaceX following reshuffling across Musk’s ventures.
Speculation about deeper integration between Tesla and SpaceX continues circulating among analysts. Such moves would reshape how investors interpret Tesla’s identity as both an automotive and infrastructure platform. Especially with the upcoming SpaceX IPO , likely coming in a couple of months.
📊 Familiar Stock Reaction
Tesla’s stock often reacts less to what happened last quarter and more to what investors expect next year.
Adjusted profits rose 56% to $1.5 billion after excluding cryptocurrency losses ($173 million loss on 11,509 Bitcoin BITSTAMP:BTCUSD ) and higher stock-based compensation, yet the market focused on spending plans rather than earnings strength.
That pattern has become familiar. Tesla reports solid results. Musk outlines bigger ambitions. Traders reassess timelines.
🎁 The Takeaway
Tesla delivered a respectable quarter with improving profitability and stronger-than-expected cash flow. But the muted stock reaction reflects a company operating in transition rather than decline.
Markets appear willing to support Tesla’s long-term robotics and autonomy strategy, though they remain cautious about how quickly those bets translate into revenue.
Off to you : Is Tesla still an electric vehicle company with an AI side project, or is it becoming an AI company that happens to sell cars along the way? Share your views in the comments!
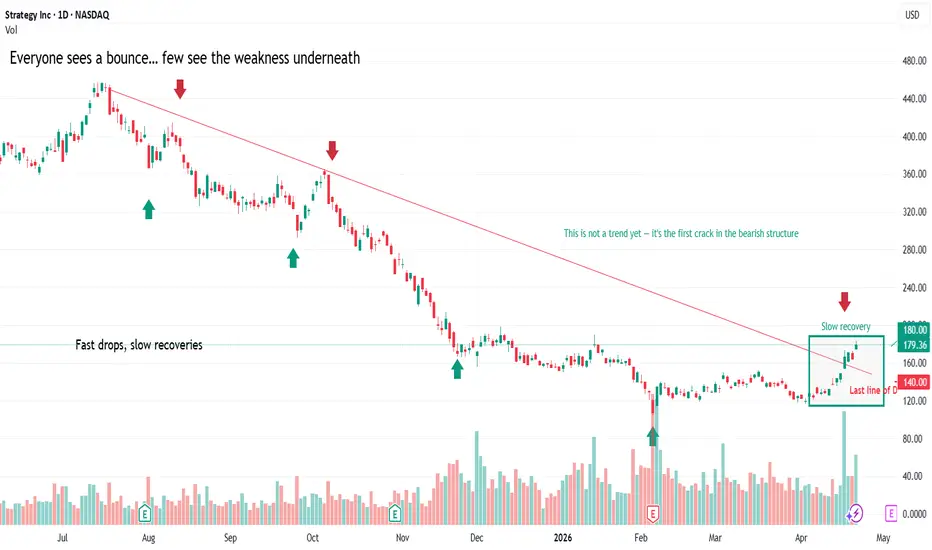
Week 17 of 52 - MSTR You’re Either Early… or Completely WrongNASDAQ:MSTR Everyone sees a bounce… few see the weakness underneath.
After a sharp sell-off, MSTR is attempting a recovery — but the structure tells a different story.
What we are seeing here is not strength… it’s a relief rally.
Price is still respecting the broader downtrend, consistently forming lower highs and showing weak reactions on every push up. The recent move higher looks clean, but when you zoom out, it lacks the aggression you would expect from a true trend reversal.
There are two key levels to watch:
➝ $180 — Decision zone
This is where bulls get tested.
A clean reclaim and hold above this level could open the door for continuation and a potential move toward the $200–220 area.
➝ $140 — Last line of defense
If price rolls over and loses this level, the entire bounce narrative breaks.
That would suggest this move was just another lower high within a broader bearish structure.
Right now, the market is at a point where both scenarios are valid.
That’s where most traders get trapped — chasing strength without confirmation or shorting too early without structure.
Key takeaway:
➝ Not every bounce is a reversal
➝ Structure matters more than momentum
➝ The best trades come from patience, not prediction
If this turns into a confirmed trend, there will be plenty of opportunities.
If it fails, the downside can come fast.
Let the market decide.
This is not financial advice. Always do your own research and manage risk accordingly.
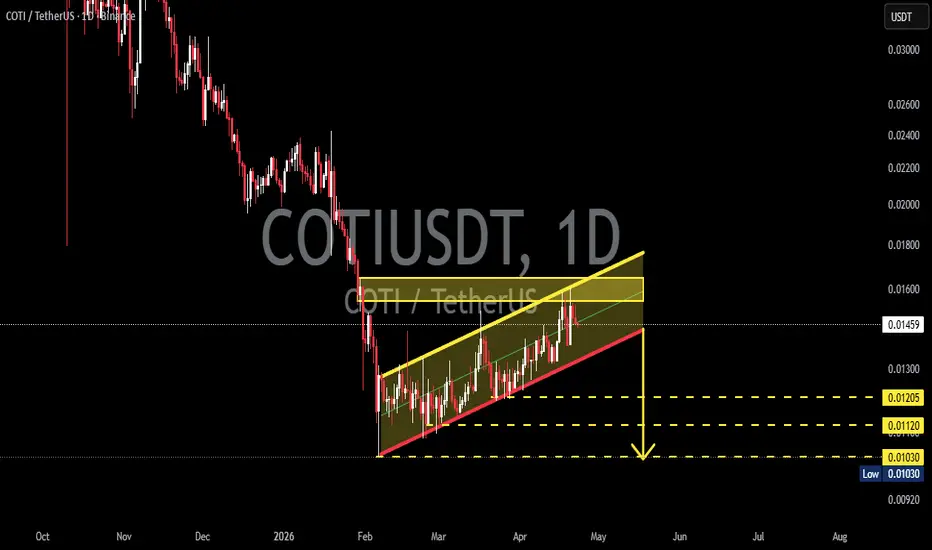
COTI/USDT — Bear Flag: Potential Continuation to the Downside?On the 1D timeframe, COTI/USDT is still within a larger downtrend structure since its peak. After a sharp decline (flagpole), price is now moving upward gradually in a consolidation phase, forming a Bear Flag pattern.
The current structure shows:
A slow and weak upward movement (flag)
Formed within a small ascending channel (yellow zone)
Still unable to break strong resistance
Price is currently positioned near the upper boundary of the flag, approaching resistance.
---
📐 Pattern Identified: Bear Flag
The Bear Flag is a:
> Bearish Continuation Pattern
Key characteristics:
Starts with a sharp drop (flagpole)
Followed by an upward consolidation (flag)
Typically ends with a breakdown continuing the downtrend
This suggests:
> The current upward movement is likely just a temporary relief before another drop
---
🔵 Bullish Scenario
A bullish case becomes valid if:
Price breaks out and closes above the flag resistance (±0.0160 – 0.0170)
Accompanied by increasing volume
Successful retest (resistance turns into support)
Potential targets:
0.0180 – 0.0200
Possible structural reversal if momentum strengthens
📌 This would signal a Bear Flag invalidation and early reversal potential
---
🔴 Bearish Scenario (Primary Outlook)
A bearish continuation is likely if:
Price breaks down from the lower boundary of the flag (support channel)
Closes below the 0.0130 – 0.0120 area
Downside targets:
0.0120 (minor support)
0.0112 (next support)
0.0103 (previous low / major support)
📉 From a theoretical perspective:
> Bear Flag targets can extend based on the length of the previous flagpole, suggesting deeper downside potential
---
📍 Key Levels
Flag Resistance: 0.0160 – 0.0170
Flag Support: ±0.0130
Key Support: 0.0120 – 0.0112
Major Support: 0.0103
---
⚠️ Key Insight
The broader structure remains bearish
Bear Flag indicates trend continuation to the downside
Current area is a critical decision zone for the next major move
---
🏁 Conclusion
COTI is forming a Bear Flag after a sharp decline, signaling a strong probability of continuing the downtrend.
Traders should:
Watch for a breakdown as a potential short opportunity
Wait for a confirmed breakout if considering a bullish scenario
#COTI #COTIUSDT #CryptoAnalysis #TechnicalAnalysis #Altcoin #BearFlag #BearishContinuation #Breakdown #CryptoTrading #SupportResistance #PriceAction
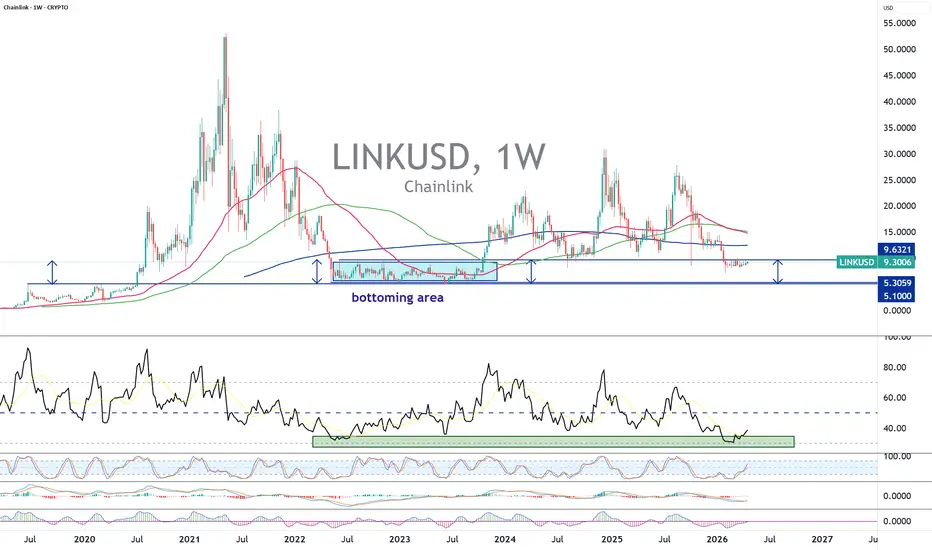
LINK, accumulation zone between $5 and $9While the Clarity Act is in its final phase of drafting and validation for the United States Senate, altcoins that are critical within the interoperability and decentralized finance (DeFi) segment are those that will benefit the most from the adoption of the Clarity Act as a law in the United States.
The CLARITY Act aims to create a clear legal framework for crypto-assets in the USA:
• Separation between the SEC and the CFTC (securities vs commodities)
• Legal status of tokens
• Rules for exchanges
• Framework for DeFi and stablecoins
Among the cryptocurrencies that will benefit the most due to their critical role and their current institutional adoption, there is the crypto LINK. The latter has the strongest fundamentals in interoperability related to DeFi, and the token is currently located in a long-term technical accumulation zone between $5 and $9.
Beyond this technical perspective, Chainlink’s positioning is based on a structural role in the architecture of tokenized financial markets. Indeed, in an environment where equities, bonds, and other real-world assets are expected to be issued and traded on-chain, the central question becomes that of data reliability. Chainlink responds precisely to this need by providing decentralized oracles capable of delivering reliable external data to smart contracts.
This role is all the more strategic within a regulated framework such as the one implied by the CLARITY Act. Financial institutions, subject to strict requirements in terms of compliance and risk management, cannot operate without auditable and secure data flows. In this context, Chainlink establishes itself as a critical infrastructure enabling the connection between traditional systems and public blockchains.
Furthermore, the rise of tokenized products (on-chain ETFs, tokenized bonds, decentralized money markets) mechanically strengthens the demand for robust oracle solutions. Each tokenized asset requires price updates, rate references, or reliable external events, all use cases directly addressed by Chainlink.
Thus, the combination of a major regulatory catalyst and a key infrastructure positioning could justify a re-rating of the token over the medium term. From this perspective, the zone between $5 and $9 appears as a strategic accumulation phase that already worked perfectly at the end of the previous bear market in 2022.
The chart below shows Japanese candlesticks on weekly data for the LINK/USD crypto.
DISCLAIMER:
This content is intended for individuals who are familiar with financial markets and instruments and is for information purposes only. The presented idea (including market commentary, market data and observations) is not a work product of any research department of Swissquote or its affiliates. This material is intended to highlight market action and does not constitute investment, legal or tax advice. If you are a retail investor or lack experience in trading complex financial products, it is advisable to seek professional advice from licensed advisor before making any financial decisions.
This content is not intended to manipulate the market or encourage any specific financial behavior.
Swissquote makes no representation or warranty as to the quality, completeness, accuracy, comprehensiveness or non-infringement of such content. The views expressed are those of the consultant and are provided for educational purposes only. Any information provided relating to a product or market should not be construed as recommending an investment strategy or transaction. Past performance is not a guarantee of future results.
Swissquote and its employees and representatives shall in no event be held liable for any damages or losses arising directly or indirectly from decisions made on the basis of this content.
The use of any third-party brands or trademarks is for information only and does not imply endorsement by Swissquote, or that the trademark owner has authorised Swissquote to promote its products or services.
Swissquote is the marketing brand for the activities of Swissquote Bank Ltd (Switzerland) regulated by FINMA, Swissquote Capital Markets Limited regulated by CySEC (Cyprus), Swissquote Bank Europe SA (Luxembourg) regulated by the CSSF, Swissquote Ltd (UK) regulated by the FCA, Swissquote Financial Services (Malta) Ltd regulated by the Malta Financial Services Authority, Swissquote MEA Ltd. (UAE) regulated by the Dubai Financial Services Authority, Swissquote Pte Ltd (Singapore) regulated by the Monetary Authority of Singapore, Swissquote Asia Limited (Hong Kong) licensed by the Hong Kong Securities and Futures Commission (SFC) and Swissquote South Africa (Pty) Ltd supervised by the FSCA.
Products and services of Swissquote are only intended for those permitted to receive them under local law.
All investments carry a degree of risk. The risk of loss in trading or holding financial instruments can be substantial. The value of financial instruments, including but not limited to stocks, bonds, cryptocurrencies, and other assets, can fluctuate both upwards and downwards. There is a significant risk of financial loss when buying, selling, holding, staking, or investing in these instruments. SQBE makes no recommendations regarding any specific investment, transaction, or the use of any particular investment strategy.
CFDs are complex instruments and come with a high risk of losing money rapidly due to leverage. The vast majority of retail client accounts suffer capital losses when trading in CFDs. You should consider whether you understand how CFDs work and whether you can afford to take the high risk of losing your money.
Digital Assets are unregulated in most countries and consumer protection rules may not apply. As highly volatile speculative investments, Digital Assets are not suitable for investors without a high-risk tolerance. Make sure you understand each Digital Asset before you trade.
Cryptocurrencies are not considered legal tender in some jurisdictions and are subject to regulatory uncertainties.
The use of Internet-based systems can involve high risks, including, but not limited to, fraud, cyber-attacks, network and communication failures, as well as identity theft and phishing attacks related to crypto-assets.
GBPJPY Bullish Structure Holds With Strong Trend ContinuationI’m looking at GBPJPY and this is one of those charts where you don’t want to overcomplicate things. The move up was clean, aggressive, and structurally sound. What we’re seeing now isn’t weakness, it’s digestion. Price pulled back into a defined demand zone and immediately found buyers again. That’s not random, that’s trend behavior. As long as this structure holds, the upside isn’t done yet.
Current Bias:
Bullish (4H timeframe focus)
The overall structure remains bullish. The recent pullback is corrective, not a reversal, and price is holding above key demand.
Technical Posture & Price Action:
Strong impulsive rally forming a clear uptrend (higher highs and higher lows)
Recent pullback into demand zone (~214.00 area)
Immediate reaction from that zone → bullish response
Current price attempting to re-establish momentum
What stands out:
Pullback respected structure perfectly
No break of higher low
Buyers stepped in early
👉 This is classic continuation setup, not distribution
Indicator & Volume Analysis:
Momentum cooled slightly after the rally (normal behavior)
No structural bearish divergence visible
Recent bullish reaction suggests momentum is re-engaging
Volume perspective:
Rally phase likely supported by strong participation
Pullback phase shows reduced selling pressure
👉 That combination typically leads to continuation
Key Fundamental Drivers:
GBP holding relatively strong vs low-yield currencies
JPY weakness remains a dominant theme (carry trade flows)
Interest rate differential continues to favor GBP
So fundamentally:
👉 Yield + carry trade demand = bullish pressure
Macro Context:
BOJ still relatively accommodative → weak JPY
UK yields remain elevated compared to Japan
Risk sentiment stable enough to sustain carry trades
Also:
No major shift in BOJ policy expectations yet
Markets still favor higher-yield currencies
👉 Macro supports continuation higher
Primary Risk to the Trend:
Bullish setup fails if:
Price breaks below 213.80–214.00 demand zone
BOJ signals tightening or intervention
Risk sentiment collapses (carry trade unwind)
That would shift flows back into JPY strength.
Most Critical Upcoming News/Event:
BOJ commentary or intervention signals
UK economic data (inflation, growth)
Global risk sentiment shifts
Leader/Lagger Dynamics:
GBPJPY is a leader in carry trade flows.
It reflects:
Risk appetite
Yield differentials
Market willingness to hold risk
It often influences:
👉 AUDJPY, NZDJPY direction
Key Levels:
Support Levels:
214.00
213.20
Resistance Levels:
215.90
217.00
Stop Loss (SL) & Invalidation Point:
Below 213.80
Take Profit (TP) Targets:
TP1: 215.90
TP2: 217.00
Summary: Bias and Watchpoints:
I’m bullish on GBPJPY, and the structure makes that view straightforward. The trend is intact, the pullback respected demand, and buyers stepped in exactly where they needed to. That’s not coincidence, that’s controlled market behavior.
As long as price holds above 213.80–214.00, I’m expecting continuation toward 215.90 and potentially 217.00. The bigger picture here is still driven by carry trade dynamics, with GBP benefiting from yield advantage while JPY remains structurally weak.
This is not the time to chase — it’s a continuation setup that rewards patience. If the demand zone keeps holding, the next push higher is likely already building.

Could be a trade topIt's possible we topped today. If so, the market should keep dropping under 7k. If they hold 7k, then it's just a pullback and we'll go higher for sure. My feeling is things may go south very quickly. The president has another deadline for Iran on Wednesday, the market is probably waiting mostly to see how that latest development resolves.

How to trade with Dark Pools and Pro TradersIT is crucial to abandon the idea that everyone trading or investing in the stock market are buying in a herd mentality. There are 12 different market participant groups not two. When Dark Pools start accumulation it is done with such expertise that the accumulation is well hidden within the price range.
Dark Pools use a very narrow price range to setup TWAP Time Weighted at Average price for their hidden accumulation that can take months to complete.
Right now, Dark Pools have been accumulating many stocks since October of last year. Since January many stocks have been in a wide sideways trend that is too narrow for good trading profits for day or swing trading. The Dark Pools control price within their Buy Zones so if you do not SEE that Buy Zone your trade will take a loss often.
By identifying the price level where Dark Pools are accumulating, you can enter sooner and be ready for the earnings gap that is occurring during this strong earnings season.

Bearish Breakdown in Gold After a Compression StructureI observed a clear bearish structure forming after a prior bullish move, where price created a strong upward impulse followed by a sharp rejection, indicating the presence of supply at higher levels. After this rejection, the market transitioned into a sequence of lower highs and lower lows, confirming a shift in control from buyers to sellers. The formation of a descending trendline along with a small consolidation (triangle) highlighted continued weakness and compression before the next move.
As the structure developed, price attempted to hold the rising base but failed to sustain, leading to a breakdown from the triangle. This breakdown was impulsive and aggressive, showing strong selling pressure as price moved quickly toward a lower zone. The move also suggests a liquidity sweep below recent lows, where stop losses were taken before a slight reaction.
Currently, price has reached a key demand zone and is showing an initial reaction with a small bounce. However, the overall structure remains bearish unless price reclaims higher levels and breaks the sequence of lower highs.
Speculative Outlook:
Price is now reacting from a key demand zone, which acts as a critical decision area. If this zone holds, the market may form a short-term bounce or consolidation before deciding the next move.
There is also a possibility of a minor pullback toward the broken structure or trendline, followed by continuation downward, maintaining the bearish trend.
However, if price shows strong bullish momentum and reclaims the previous lower high, it would weaken the bearish structure and suggest a potential reversal. This makes the current area a key decision point between a temporary reaction or continuation of the downtrend.

ETH/USDT: Trend Breakdown and Bearish Continuation StrategyHi!
The technical landscape has shifted decisively. While we always keep an eye on the $2,355 "breakout or bust" level, the weight of the evidence is now heavily skewed to the downside. The market has signaled a fundamental shift in character, moving from a trend of higher lows to a structural breakdown.
The Bearish Thesis: Why Downside is the Priority
The probability of a move toward our lower targets has increased significantly due to three specific technical failures:
The "Engulfed" Concept: The fact that price has traded through and engulfed the previous support level is a major red flag. This isn't just a wick; it’s a total neutralization of the buy-side liquidity that was holding the trend together. Once a level is engulfed like this, it typically converts into a "supply wall" that prevents the price from recovering.
Trendline Invalidation: The primary ascending trendline—the backbone of the recent rally—is now officially broken. We are no longer in a bullish trend; we are in a bearish expansion phase.
Failed Recovery: The rejection at the green box shows that the bulls don't have the strength to reclaim the broken structure. Every attempt to move higher is being met with aggressive selling.
Execution Plan: Focus on the Targets
Primary Target ($2,200): This is the first major area of interest. Given the velocity of the trendline break, we expect a move toward this zone to test the strength of the remaining buyers.
Secondary Target ($2,140): This is the high-conviction target. If the $2,200 level doesn't provide a significant bounce, the "engulfed" momentum will likely carry us straight into this deeper demand pocket.
Strategy Summary
The market has spoken: the trend is now bearish. Unless we see a sudden and high-volume surge that closes above $2,355, we are strictly looking for downside continuation. Manage your risk accordingly and don't fight the new trend—the move toward $2,200 and $2,140 is the high-probability play here.

What Does Tesla's Chart Say Heading Into This Week's Earnings?Tesla NASDAQ:TSLA soared 7.6% one day last week -- its best single session in more than nine months -- and has gained some 15% in less than two weeks as the EV giant prepares to report Q1 earnings. I don't personally like when stocks run upward into earnings, but Tesla's technicals and fundamentals seem to be shaping up rather well.
Let's explore:
Tesla's Fundamental Analysis
TSLA plans to release earnings on Wednesday after the bell at a time when the stock is down some 13% year to date amid a beat-down that began in earnest in mid-December.
Wall Street expects the electric-vehicle firm's first-quarter results to show $0.36 in adjusted earnings per share on roughly $22.35 billion of revenue.
A print like that would reflect about 15.5% in year-over-year revenue growth, as well as a 33% y/y gain from the $0.27 in adjusted EPS that Tesla saw in the same period last year.
But interestingly, nine of the 26 sell-side analysts that I know to cover TSLA have lowered their earnings estimates for the period since the quarter began, while only four have raised them.
The remaining 13 analysts have made no changes. This tells me that more than a few of them don't really know what's coming.
Tesla's Technical Analysis
Now let's check out TSLA's chart going back some eight months and running through Thursday afternoon (April 16):
Readers will first note that TSLA saw a double-top pattern of bearish reversal this past autumn, as marked by the two red boxes at the chart's left. That pattern worked out quite well.
However, the stock has recently broken out of a downtrend, as illustrated here by a Raff Regression model (the orange-and-pink shaded area at the chart's right).
The stock has also retaken its 21-day Exponential Moving Average (or "EMA," marked with a green line), which has likely re-energized the swing crowd.
That said, Tesla has been recently butting up against resistance at its 50-day Simple Moving Average (or "SMA," marked with a blue line) and its 200-day SMA (the sloping red line) as well.
TSLA took both of them late last week, but it's not yet clear whether it can hold them. (It fell back below the 200-day SMA on Monday and the 50-day line intraday on Tuesday.)
If the stock does hold these two lines, that could cause portfolio managers with a financial interest in Tesla to consider increasing their long-side exposure in response.
Meanwhile, Tesla's Relative Strength Index (or "RSI," the gray line at the chart's top) has improved. So has its daily Moving Average Convergence Divergence indicator (or "MACD," marked by blue bars and black and gold lines at the chart's bottom).
However, neither one is postured very bullishly as of yet. Within that MACD, the histogram of the 9-day EMA (the blue bars) has moved above zero, sending short-term bullish signals.
Similarly, the 12-day EMA (the black line) has moved above the 26-day EMA (the gold line). That's bullish, but the fact that both lines remain below zero does temper that energy a bit.
An Options Option
Some option traders who are bullish on Tesla but also want to limit downside risk are probably using what's known as "bull-call" spread here.
That's where you buy one call on a stock and sell another with a higher strike price, but where both expire on the same day. Here's an example:
-- Long one TSLA call with an April 24 expiration (i.e., after earnings) at a $390 strike price (near the stock's 50-day SMA). That cost roughly $12.90 at recent prices.
-- Short one TSLA April 24 $405 call for about a $6.80 credit.
Net Debit: $6.10.
This trade risks the $6.10 net debit (the maximum theoretical loss) in an attempt to bring in $15, for a maximum theoretical profit of $8.90.
These options traders would see the $8.90 maximum theoretical profit if TSLA trades at or above $405 at expiration.
Conversely, traders would face the $6.10 maximum theoretical loss if Tesla trades at or below $390 at expiration.
(Moomoo Technologies Inc. Markets Commentator Stephen "Sarge" Guilfoyle had no position in TSLA at the time of writing this column.)
This article discusses technical analysis, other approaches, including fundamental analysis, may offer very different views. The examples provided are for illustrative purposes only and are not intended to be reflective of the results you can expect to achieve. Specific security charts used are for illustrative purposes only and are not a recommendation, offer to sell, or a solicitation of an offer to buy any security. Past investment performance does not indicate or guarantee future success. Returns will vary, and all investments carry risks, including loss of principal. This content is also not a research report and is not intended to serve as the basis for any investment decision. The information contained in this article does not purport to be a complete description of the securities, markets, or developments referred to in this material. Moomoo and its affiliates make no representation or warranty as to the article's adequacy, completeness, accuracy or timeliness for any particular purpose of the above content. Furthermore, there is no guarantee that any statements, estimates, price targets, opinions or forecasts provided herein will prove to be correct.
Options trading is risky and not appropriate for everyone. Read the Options Disclosure Document ( j.moomoo.com ) before trading. Options are complex and you may quickly lose the entire investment. Customers should consider their investment objectives and risks carefully before investing in options. Because of the importance of tax considerations to all options transactions, the customer considering options should consult their tax advisor as to how taxes affect the outcome of each options strategy. Supporting documents for any claims will be furnished upon request.
Options trading subject to eligibility requirements. Strategies available will depend on options level approved.
Maximum potential loss and profit for options are calculated based on the single leg or an entire multi-leg trade remaining intact until expiration with no option contracts being exercised or assigned. These figures do not account for a portion of a multi-leg strategy being changed or removed or the trader assuming a short or long position in the underlying stock at or before expiration. Therefore, it is possible to lose more than the theoretical max loss of a strategy.
Opening new options positions close to or on their expiration date comes with substantial risk of losses for reasons that include potential volatility of the underlying security, limited time to expiration. This type of strategy is not suitable for all investors and should be utilized only by sophisticated investors who understand the essentials of options and the risks associated with short interval trading.
Moomoo is a financial information and trading app offered by Moomoo Technologies Inc. In the U.S., investment products and services on Moomoo are offered by Moomoo Financial Inc., Member FINRA/SIPC.
TradingView is an independent third party not affiliated with Moomoo Financial Inc., Moomoo Technologies Inc., or its affiliates. Moomoo Financial Inc. and its affiliates do not endorse, represent or warrant the completeness and accuracy of the data and information available on the TradingView platform and are not responsible for any services provided by the third-party platform.
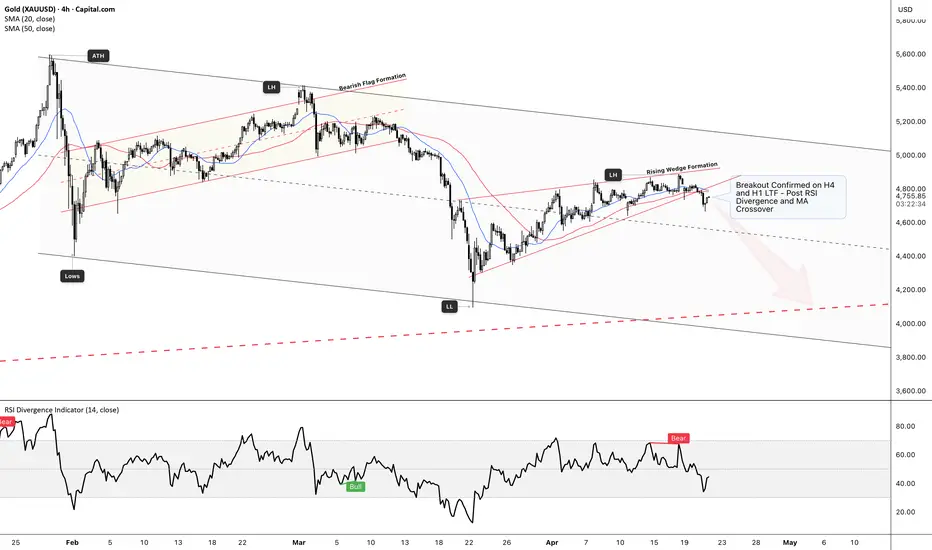
XAUUSD (Gold) – Structure Breakdown & Bearish OutlookHTF - D1 View
CAPITALCOM:GOLD is currently trading within a broader descending channel, respecting long-term bearish structure despite recent short-term bullish attempts.
On the left side of the chart, we saw a bearish flag formation form after the ATH, which led to continuation downside — setting the tone for the current macro bias.
Recently, price formed a rising wedge on H4, which is typically a weakening bullish structure. This wedge developed after a strong impulsive move from the lows (LL), but momentum started fading as price printed lower highs internally.
📝 Key confluences:
🔻RSI bearish divergence signaling weakening bullish momentum
🔻MA crossover suggesting a shift in short-term trend
🔻Rejection at wedge resistance + channel mid-zone
We’ve now seen a confirmed breakdown on H4, with LTF alignment (H1) supporting the move.
📉 Bias: Bearish
As long as price remains below the wedge and fails to reclaim that structure, the expectation is continuation towards:
◘ Channel support region & Long Term Support Confluence around $4200 - $4100 range
◘ Potential sweep of previous lows at $4100
📌 Any pullbacks into the broken wedge structure or moving averages could offer sell opportunities, not buys.
⚠️ Invalidation:
A strong reclaim and hold above the wedge resistance would weaken this bearish outlook.
Bottom line:
This isn’t a reversal market — it’s a corrective structure inside a larger downtrend. Treat rallies as setups, not signals of strength.
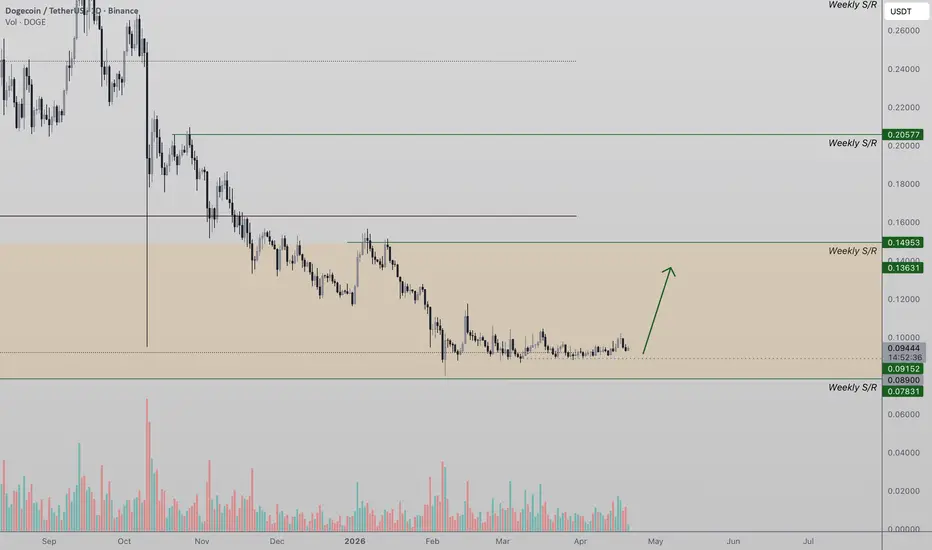
Dogecoin (DOGE) Update bullish potential Dogecoin is currently consolidating within a tight local range, signaling a potential expansion move on the horizon as volatility continues to compress.
Price action has been accompanied by declining volume, which typically precedes a breakout scenario. As the range tightens, the market is building pressure for a directional move, with volume expected to be the key driver.
Key Highlights:
- Tight range consolidation signaling expansion
- Declining volume suggests buildup phase
- $0.07 support remains key for bullish structure
The lack of volume during this consolidation phase indicates that neither buyers nor sellers have taken control just yet. However, this type of compression often leads to sharp expansion once participation returns to the market.
From a technical standpoint, as long as Dogecoin holds above the $0.07 support level, the structure remains favorable for a bullish breakout. This level acts as a key foundation for buyers, and maintaining support here keeps the upside scenario intact.
A strong influx of bullish volume will likely be the trigger needed to break above the local range highs and initiate the next leg upward. Until then, patience is required as price continues to coil within this tightening structure, preparing for its next move.
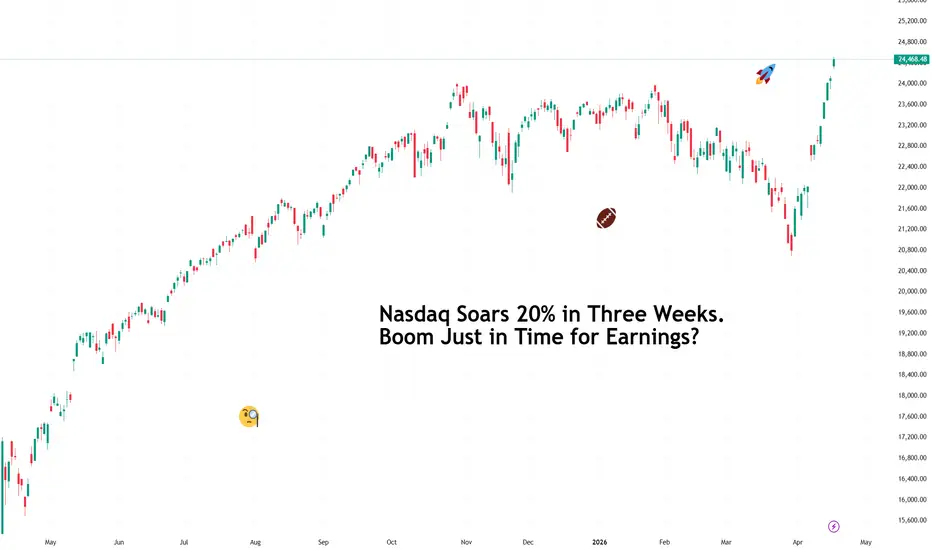
Nasdaq Soars 20% in Three Weeks. Boom Just in Time for Earnings?The tech-heavy Nasdaq Composite NASDAQ:IXIC has climbed nearly 20% from its March 30 low, delivering the fastest rebound traders have seen this year. Moves of that size usually arrive alongside strong catalysts, shifting expectations, or a sudden improvement in global mood.
This time the spark came partly from easing tensions around the US–Iran conflict, which helped calm energy markets and send risk assets to record highs . A relief rally quickly became a momentum rally, and momentum attracted fresh capital.
🏦 Earnings Season Opens with Confidence
At the same time, Corporate America stepped into earnings season with steady footing.
Major banks reported solid results, helping reinforce expectations for roughly 12% year-over-year earnings growth for the S&P 500. Strong margins continue to support profits even as inflation remains sticky and geopolitical uncertainty lingers.
Early reports suggest companies still know how to protect profitability in complex environments. That resilience tends to encourage investors to look ahead rather than backward.
📊 Tech Still Carries the Baton
Strip technology out of the earnings picture and projected growth drops closer to 3%, which highlights how much leadership still comes from the big players in the business.
The recent Nasdaq rebound could be seen as renewed confidence that artificial intelligence spending, cloud infrastructure expansion, and digital services demand continue shaping corporate investment priorities.
✈️ The First Big Names Step Up
This week brings results from several high-profile companies including Tesla NASDAQ:TSLA and Boeing NYSE:BA , along with Intel NASDAQ:INTC and United Airlines NASDAQ:UAL . Roughly 86% of early reporters have already beaten expectations, which adds momentum to the broader narrative of corporate resilience.
Airlines offer insight into travel demand, chipmakers reflect investment in infrastructure, and industrial giants help reveal global supply chain health. Together they provide a useful early read on economic direction.
💻 The Real Test Arrives Next Week
The most influential stretch of earnings arrives next week. Microsoft NASDAQ:MSFT , Meta Platforms NASDAQ:META , Alphabet NASDAQ:GOOGL , and Amazon NASDAQ:AMZN report on April 29, followed by Apple NASDAQ:AAPL on April 30.
Together these companies shape nearly every major market theme at once. Cloud spending, digital advertising, artificial intelligence infrastructure, and consumer demand all intersect during that single reporting window.
🔄 A Rotation Story in Reverse
Earlier this year investors shifted capital away from technology stocks amid concerns about heavy AI infrastructure spending and pressure on software business models. That rotation left valuations at more comfortable levels compared with previous earnings seasons.
Lower valuation multiples often create room for upside surprises. When expectations fall, steady results can look impressive.
⚡ Software Still Faces Questions
One area attracting close attention involves software companies adjusting to the pace of artificial intelligence innovation. Investors continue watching how automation reshapes pricing power, hiring strategies, and enterprise demand. Adobe NASDAQ:ADBE , Salesforce NYSE:CRM , Figma NYSE:FIG , and Progress NASDAQ:PRGS have been hurt badly.
At the same time infrastructure players continue benefiting from strong investment cycles. Winners here include CoreWeave NASDAQ:CRWV , Nebius NASDAQ:NBIS , and IREN NASDAQ:IREN . The contrast creates a layered picture inside the broader technology sector.
🛍️ Consumers Remain the Wild Card
Strategists also continue monitoring consumer strength as tariffs (yep, still here), higher energy costs, and AI-driven changes in employment reshape spending behavior. Premium brands and services companies often provide early signals about confidence across households.
Off to you : How do you plan to tackle this earnings season? Share your views in the comments!
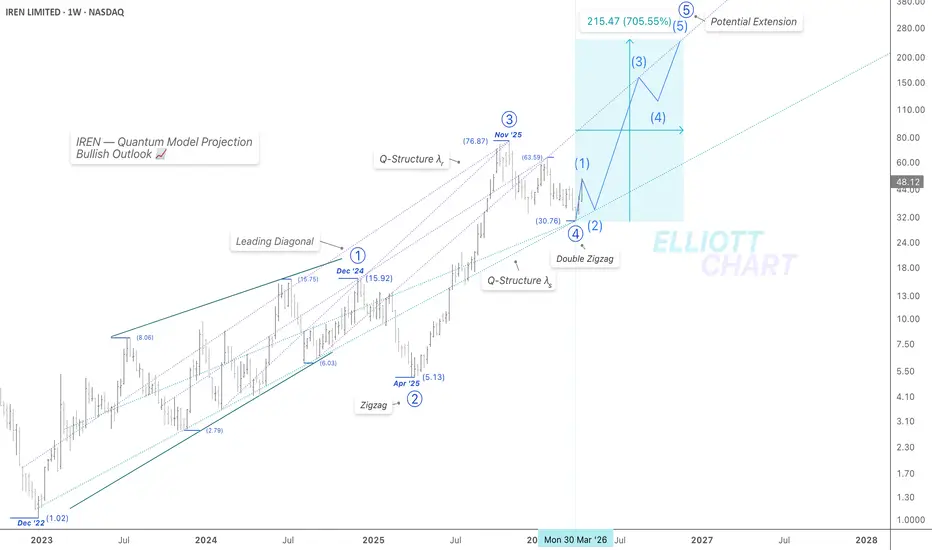
IREN | WeeklyNASDAQ:IREN — Quantum Model Projection
Bullish Outlook | Projected Extension Underway
IREN has advanced 62% since late March, firmly supported by the Q-Structure λₛ at precise confluence, as projected—reinforcing the Primary degree Extension in Wave ⓹ now underway.
Wave Analysis
This impulsive advance in Intermediate Wave (1), characteristically, indicates a broader Extension into Primary Wave ⓹.
As illustrated on the chart, a retracement at Intermediate degree is expected to follow as Wave (2) from current levels—aligning with BTC ’s projected corrective phase in Int (2).
🔖 Outlook is derived from insights within the Quantum Models framework. Within this methodology, Q-targets are high-probability projections generated by the convergence of equivalence lines. These Quantum Structures also function as structural anchors, shaping the model’s internal geometry and guiding the evolution of alternative paths as price action unfolds.
#CryptoStocks #CryptoMining #QuantumModels
ETH - Early Signs of WeaknessToday we have seen many headlines declaring the war is over, shooting all markets to the upside. But will this become a "sell the news" event?
The current market structure is lining up for that to be a real possibility. Here are all the early signs that ETH might be forming a top around current levels. Of course this can be negated and change at a moment's notice, but here is what to watch for the time being.
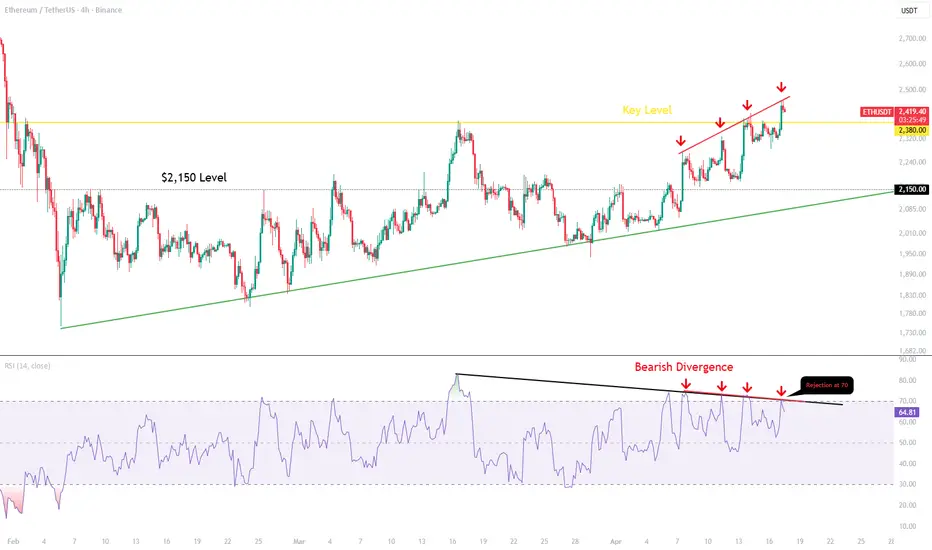
First and most importantly, the key level to watch on the 4H timeframe is $2,380 (yellow ray). If ETH closes at or below that level on the 4H, that will be the first major warning sign of a larger drop to follow.
However, the most important close will be tomorrow's. If bears are truly in control they will attempt to close tomorrow's candle (April 18) below $2,350. If successful, that would align with a double top forming on the 3D line chart which would be a very powerful signal for bears to regain momentum to the downside.
Price is also fighting crucial Fibonacci levels at this exact moment. On the macro Fibonacci trend price is right at the 0.786:
Even on the micro trend from the recent high to low, price has been battling the 0.618. So far every daily candle has closed below this level (teal arrows). This is the first candle potentially closing above it, but we still have 4 hours until today's close. More importantly, even if price does close above today, if it closes below tomorrow it will simply become a false break and reclaim the bearish trend:
Now take a look at the RSI. The 4H RSI is beginning to develop a clear bearish divergence with multiple higher highs in price followed by multiple lower highs on the RSI, showing the uptrend is weakening (red lines). The 4H RSI just got rejected exactly at the 70 level, which typically signals the final rejection before a major momentum drop. The RSI has also been developing a larger series of lower highs since the March 16th high (black trendline).
Multiple other timeframes are also showing rejections right at overbought conditions (red arrows):
Today's and tomorrow's close will be the big decision point for ETH. For now this looks like the top, but if price is able to confirm a break above these levels tomorrow then the move to $2,800 is on the table and I will make a follow up post on that development. For now, watch the RSI closely.