Strongest Levels That Can Signal Reversals⏱️ Reading time: 4–5 minutes
One of the most important skills in trading is the ability to see price levels on a chart. Price levels help us understand where the market has reacted before, where participants have been particularly active, and where the price may react strongly again in the future.
🔹 WHAT ARE HORIZONTAL LEVELS?
Horizontal levels are areas on a chart where the price has previously:
Accumulated
Sharply reversed
Market attention is concentrated in these areas.
Simply put, a level is an area where the market has already shown that this price is important to large and active participants.
⚠️ Important: Many novice traders perceive a level as a single, precise line. Most often, a horizontal level is not a specific price, but an area within which the market has already demonstrated a struggle between buyers and sellers.
📌 Therefore, when the price returns to such an area, the trader expects the market to:
Price stop
Reverse
Breakout
Make a false breakout
🎯 WHAT DO LEVELS MEAN FOR A TRADER?
Price levels are more than just chart markings. They are a practical tool for decision-making.
With their help, a trader can:
Identify a potential entry area
Understand where to place a stop-loss and take-profit
Decide where to take partial profits/move the trade to breakeven
✅ In other words, price level provide a guiding light for the trader.
They assist in planning a trade that is based on a clear market structure, rather than entering "out of nowhere."
⚡ WHAT ARE THE MOST CONFIDENT LEVELS?
Among the large number of levels, two types are particularly important to highlight:
1️⃣ Reversal level
2️⃣ First level of correction
These zones are often among the strongest in the market, because they are associated not simply with a local price stop, but with a change in the structure of the global movement.
1️⃣ REVERSAL LEVEL
A reversal level is an area where the market completes its previous move and reverses direction (point 1 on the chart below) . This means it's the point where a trend breaks (point 2 on the chart below) .
This level often appears as a "V-shaped" reversal, meaning a sharp rebound from the area followed by a strong momentum in the opposite direction.
📍 Why is this level so important?
Because this is where one side of the market loses control and the other side regains it. This means it's no longer a simple pause, but a critical point where trend shifts.
If the price subsequently returns to this area, the market often reacts to it again (point 3 on the chart above) .
The reason is simple: this zone has already proven its significance as a reversal point for the entire trend.
💡 This is why a reversal level often becomes one of the most powerful areas for monitoring price reactions.
2️⃣ FIRST LEVEL OF CORRECTION
After a market reversal, the price rarely moves rapidly in the direction of a new trend. Typically, a correction happens (point 2 on the chart below) after the first impulse (point 1 on the chart below) . The level at which this first correction ends and the price continues in the new trend direction is called the first level of correction (point 3 on the chart below) . Instead of the first correction of a new trend, accumulation may be observed, which is also suitable for defining the first level of correction .
📌 Essentially, this is the first confirmed point after the reversal, where the market shows: "Yes, the new direction is indeed holding."
📍 Why is this level also important?
Because it:
Appears after the change in trend
Confirms that the reversal was not random
Shows the first high-quality defense of the new trend
That's why the next price approach to this zone can also be expected to trigger a reaction and a potential reversal.
🛠 HOW CAN A TRADER USE THESE LEVELS IN TRADING?
Find areas on the chart where the price previously reversed
Identify the REVERSAL LEVEL
After the new movement forms, mark the first correction – this will be the FIRST LEVEL OF CORRECTION
Track the market's reactions as the price moves closer to these zones. Potential price reversals typically happen near these zones (unless the price has begun to form an accumulation)
⚠️ Important: A level is not a guarantee of a reversal.
This is the area where a trader's attention should be especially focused, because it is there that the probability of a market reaction is higher than at a random point on the chart.
Community ideas

Adobe - The 100 RMA, the Gaussian Channel, and the End of an Era
SYMBOL: NASDAQ:ADBE | DIRECTION: SHORT from $305 | TIMEFRAME: 5-Week
Published: April 2026
The business model worked beautifully for two decades. Lock customers into subscriptions, acquire every serious competitor before they can become a threat, and let the compounding revenue machine do the rest. The stock reflected it, thirty years of uninterrupted respect for the 100-week RMA. Not in 2002. Not in 2008. Not in 2011. Until now.
Three signals have just printed simultaneously on the 5-week, 7-week, and 12-day charts. Each is significant on its own. Together, they form an argument that the correction in Adobe is not over. In fact it may be only beginning.
On the above 5-week chart price action has printed below the 100 RMA for the first time in over 30 years. Several reasons now exist to consider significantly further downside.
They include:
1) The 100 RMA . Broken for the first time in 30 years. The black line on the 5-week chart has been respected without exception since the mid-1990s. It held through the dot-com collapse. It held through the financial crisis. It held through COVID. Every test — and there were many, resulted in a bounce. Price has now confirmed a break below it. On this timeframe, 30-year support levels do not break on noise. They break on structural change.
2) Adam and Eve double top confirmed. The formation is annotated clearly on the 5-week chart. Adam: the sharp, impulsive first peak. Eve: the broader, rounded distribution top that followed. The neckline of this pattern has broken. The measured move of an Adam and Eve double top on a 5-week timeframe projects significantly below current levels. This is not a speculative read. It is a textbook distribution pattern at the end of a multi-decade bull run. They do not print at the top for no reason.
3) First ever break of the Gaussian channel on the 7-week chart. The Gaussian channel has contained every correction in Adobe's listed history.
That’s 35 years of trading, every bear market, every drawdown. Price has now closed below it for the first time ever. When a channel that has never failed finally gives way, the implication is not a swift recovery to the mean. It is a regime change. The 7-week chart is not broken. It is telling you that the character of this stock has changed.
4) The business model is structurally challenged. Adobe's growth has rested on two pillars: subscription lock-in and competitive suppression through acquisition. Both are weakening. Subscription fatigue is not a headline; it’s a behavioural shift. Customers are auditing every recurring fee, and the value proposition of creative tools that have evolved marginally over five years is increasingly difficult to defend at premium pricing. The second pillar, buying out threatening competitors before they scale is meeting resistance. Regulators blocked the Figma deal. Competition from AI-native design tools is arriving faster than any acquisition strategy can absorb. The business is not broken today. But the compounding growth story that justified a 30-year premium multiple is under more pressure than the current sell-side consensus acknowledges.
5) RSI and the composite oscillator at multi-decade extremes. The short-term picture is unambiguously oversold, the 12-day Stochastic RSI is at the floor, and the composite oscillator is approaching its lowest reading in years.
A technical bounce from here is entirely possible and should be expected. It does not, however, change the macro argument. Structural breakdowns routinely produce violent countertrend rallies. Those rallies are not recoveries. They are selling opportunities for those who understand what the higher timeframe is saying.
Targets
• 1st target: $160. Expect a significant reaction here, it is the 50% level.
• 2nd target: $50. The lower boundary of the long-term resistance from the year 2000 until the 2014 breakout.
What about the upside?
A confirmed 5-week close back above the 100 RMA cancels the bearish thesis entirely. The line held for 30 years. If price reclaims it convincingly, that changes the argument. Until that happens, the burden of proof rests with the buyers, not the sellers.
The crowd
Adobe is still widely regarded as a great business. Analysts are still defending their price targets. The institutional consensus has not shifted. That is not a source of comfort, it is the setup. The most damaging corrections in technology stocks always unfold while the consensus is still constructive. The chart is already three signals deep into a structural breakdown. The narrative will catch up eventually.
Is it possible price finds support here and recovers? Sure. Is it probable given what the 5-week and 7-week charts are showing? Look left. Look at the 100 RMA. Look at the Gaussian channel. Is this time different?
Ww
Type: Speculative short / educational | Timeframe: 12–24 months
===================================================
Disclaimer : This idea is for educational and informational purposes only. It is not financial advice. Investing in equities involves substantial risk of loss. Always do your own research and consult a qualified financial adviser before making any investment decisions. Past performance is not indicative of future results.

Ethereum reclaiming structure… but bigger tests aheadBreak back above $2,386 — now key support
Price has reclaimed prior resistance and is attempting to hold it as support, a constructive shift in short-term structure. Holding here keeps the higher low sequence intact
Momentum building, not overextended yet
RSI continues to climb without being overbought, suggesting there’s still room for continuation if buyers maintain control
EMAs still bearish, but improving
The 100/50 remain bearishly crossed, though both are flattening and beginning to slope upward — early signs of a potential shift in trend
Heavy resistance cluster above ($2,623–$2,650)
This zone, combined with the 200-day EMA, is the real test. Even with strength here, price is moving into a dense supply area that won’t break easily
In Summary
Ethereum has reclaimed the $2,386 level and is attempting to build support above it, signalling improving short-term structure. Momentum is rising without being overstretched, which supports the case for further upside. However, the broader trend remains fragile with key moving averages still bearishly aligned. The real challenge sits above in the $2,600+ region, where strong resistance and the 200-day EMA converge. Holding current levels keeps momentum intact, but rejection from higher zones remains a clear risk.

The $10 VisionThe bullish case for SUI long-term is essentially a bet on it becoming the "operating system" for the next generation of the internet. While Solana was the breakout star of the previous cycle, the 2026-2027 bull cycle thesis for SUI is built on three pillars: Technical Superiority, Institutional Infrastructure, and Economic Velocity.
The "Object-Centric" Revolution
Most blockchains (like Ethereum or Solana) use an "account-based" model—like a giant spreadsheet where everyone waits in line to update their balance.
• Sui is different: It treats everything (tokens, NFTs, game items) as independent objects.
• The Result: If you send a token to a friend, it doesn't have to wait for a complex DeFi trade happening on the other side of the network. This allows for Parallel Execution.
• Why it hits $10: This architecture is the only one that truly scales for mass-market apps. In early 2026, Sui is already hitting 160M+ daily transactions, dwarfing most other L1s because it doesn't "clog up" when things get busy.
The Institutional "Glow-Up"
As of April 2026, Sui has transitioned from a "VC-backed experiment" to a "Financial Grade" network.
• Staking ETFs: We now have three U.S.-listed SUI staking ETFs. This provides a massive, permanent bid from institutional 401ks and pension funds that can't buy tokens on Binance but can buy an ETF.
• The Stripe Connection: A native stablecoin backed by Stripe’s infrastructure recently launched on Sui. This bridges the gap between traditional "Web2" money and "Web3" rails, making SUI the go-to for programmable payments.
• Privacy Features: Mysten Labs integrated protocol-level privacy. This allows big banks to use the chain while keeping their trade secrets hidden—a requirement for the "Real World Asset" (RWA) boom.
The AI & Gaming Narrative
The "Agentic Web" is the big buzzword of 2026.
• AI Agents: Because Sui handles "objects" so well, it is the perfect environment for autonomous AI agents to own and trade assets without human intervention.
• Gaming: Sui's sub-second finality (faster than a blink) makes it feel like a regular cloud-based game, not a "clunky blockchain game." As 2026 AAA titles launch on-chain, SUI becomes the "gas" for millions of players.
All of this to say one thing: Bullish

Why Trends Look Obvious Only in HindsightHello, traders! 😎
You’ve seen it a hundred times. Price moves, trend plays out, and suddenly the chart looks clean — almost too clean. Entries feel obvious, structure makes sense, and it seems like the market practically told you what was coming. That’s exactly where hindsight bias trading creeps in.
🌫️ It Never Feels That Clear in Real Time
The idea that trends are “easy to spot” mostly exists after the move is done. In live conditions, trading decision making is messy. Price action is noisy, signals conflict, and conviction is never 100%. What later looks like a clean breakout often felt like a coin flip in the moment. That disconnect is pure market hindsight bias — your brain smoothing out uncertainty after the fact.
🧠 The Brain Edits the Story
A big part of trading psychology hindsight is how memory works. You don’t remember the hesitation, the doubt, or the invalidations along the way. You remember the outcome. This is a classic case of cognitive bias trading, where the brain compresses a complex sequence of events into a simple narrative: “trend was obvious, I just missed it.” In reality, the psychology of markets is anything but obvious.
⚡ Bitcoin Trends Look Cleaner Than They Were
Take any bitcoin trend analysis. Zoom out, and it’s a textbook move. Higher highs, higher lows, strong continuation. But zoom into the actual execution phase, and it’s a different story. Pullbacks look like reversals, sentiment shifts fast, and liquidity grabs shake confidence. This is where crypto market psychology and real market behavior analysis come into play — not theory, but reaction.
🎭 Perception vs Reality
Most issues in trading mistakes psychology come from this gap. In real time, your market perception trading is influenced by emociones, uncertainty, and incomplete information. Your read on price action psychology evolves with every candle. But once the move is complete, your brain reframes it into a clean, logical sequence. That’s decision bias trading in action.
🏁 Final Take
The reason why trends look obvious is simple: your brain prefers clarity over chaos. But markets don’t operate in hindsight — they operate in uncertainty. Understanding crypto trader psychology means accepting that clean charts are a luxury you only get after the trade is over.
This content is for informational purposes only and should not be considered financial advice.

Intuitive Surgicals: A solid company to consider buyingHello,
Intuitive Surgicals, Inc. engages in the provision of robotic-assisted surgical solutions and invasive care through a comprehensive ecosystem of products and services. Intuitive develops, manufactures and markets the da Vinci surgical system. The company strives to make surgery more effective, less invasive and easier on surgeons, patients and their families. Da Vinci robotic surgical systems are systems designed to increasing the scale & efficiency of minimal invasive surgery.
Intuitive Surgical has demonstrated remarkable growth over the past five years, with significant increases in total revenue, net income and earnings per share. This underscores the company's ability to deliver consistent shareholder value. We see a situation where the total addressable market for this company will continue to grow over the medium and long term. In the Q4 earnings release, Intuitive delivered excellent results with strong performance in procedure growth and both domestic and outside-the-US system placements and utilization rates. The strength of general surgery, particularly in the U.S. and global markets, continues to reinforce the rising adoption of robotic-assisted surgery, a trend we expect to persist. We expect general surgeons to continue preferring robotic assisted surgery hence continue to see a market for intuitive surgical.
Surgical practice globally has undergone significant advancements with the advent of robotic systems. In Africa for example, a similar trend is emerging with the introduction of robots into various surgical specialties in certain countries. We noted from Intuitive surgical website that you can now purchase their machinery via their south African business agent with data confirming that the equipment are being used in a number of countries in Africa.
While growth in certain procedures—particularly in the U.S. market—may begin to slow as penetration rates approach their peak, we view this risk as limited. The company still has significant untapped potential in international markets, which should sustain attractive growth for some time. Moreover, even in the event of rising competition, we believe high switching costs will protect its market position. Clients would need a compelling reason to shift to alternative systems, given the expense and effort of retraining surgeons and adapting workflows.
The recent pullback presents a more attractive entry opportunity, with our medium-term price target of $720 reflecting the company’s solid fundamentals and strong market potential. We maintain a strong buy recommendation at current levels. Attention now turns to the upcoming Q1 2026 earnings release on April 21, 2025 , where historical data shows that Intuitive Surgical Inc. has consistently exceeded earnings expectations in each of the past ten quarters. Analysts currently project earnings per share of USD 2.12 for this quarter. From a technical standpoint, the recent correction further supports our bullish outlook, reinforcing our Buy bias both fundamentally and technically.
Opportunities
Intuitive launched its next-generation platform, which should give significant momentum to system placements in the next few years.
Intuitive Surgical is enjoying tremendous success in general surgery, which is now its highest-volume surgical area. The opportunity is particularly attractive internationally.
Intuitive's foray into bronchoscopy shows the company isn't resting on its laurels and is willing to look in other areas in need of robotic assistance.
Risks to consider
We may be seeing the emergence of some competition, particularly for lower-cost procedures.
Intuitive's margins have been declining as the company has been investing in its Ion platform and next generation Da Vinci system. Da Vinci robotic surgical systems are systems designed to increasing the scale & efficiency of minimal invasive surgery
You can find more details about the financials of the company via links www.tradingview.com

CTRA - Healthy Dip Before Next RallyCTRA is in a clear uptrend, but after a strong rally, it’s now taking a healthy pullback. Price got rejected near $37 and is slowly moving down toward a strong support zone around $29 , where buyers previously stepped in. Wave 4 can become a crucial demand zone for the current prices. Before the next big move, it may show a small bounce and then dip again into this zone to complete the correction.
The stock has already pulled back about 50% of its previous move, and now it’s approaching a strong support area. We’re watching for a possible reversal near the 61.8% Fibonacci level, which lines up with the previous support zone (earlier pullback area) and a known demand zone where buyers have stepped in before. Target for this setup is 33.45 - 34.64 - 36.10+ .
Entry is only possible after the price action confirmation or sub-wave formation.
We will update with further information soon.
By @BrightRally_Research

Nvidia (NVDA) Rally Resumes – Path Toward All‑Time HighsFrom its all‑time high on October 29, 2025 at $212.19, Nvidia (NVDA) began a pullback to correct the cycle that started from the April 2025 low. The decline reached $164.27, where the stock completed the correction and turned higher with improving momentum. The advance from the March 30, 2026 low is developing as a five‑wave impulsive structure, and this supports the view that NVDA is preparing for a new record high. Wave 1 ended at $177.37. Wave 2 then pulled back and finished at $170.23, as shown on the 30‑minute chart.
The stock has since progressed into wave 3, which subdivides into another five‑wave sequence in a lower degree. From the wave 2 low, wave ((i)) ended at $190. The pullback in wave ((ii)) concluded at $185.14. Wave ((iii)) extended higher and reached $200.4, confirming the strength of the current cycle. NVDA is expected to produce additional legs higher to complete the full five‑wave advance from the March 30, 2026 low. Once that structure finishes, the stock should enter a corrective phase to consolidate the move before the broader trend resumes.
In the near term, the bullish outlook remains valid as long as the pivot at $170.23 stays intact. Dips should continue to attract buyers in either a three‑swing or seven‑swing corrective pattern. This supports the case for further upside as the larger impulsive sequence continues to unfold.

How To: Bearish Breakaway w/ Tools, Indicators & StrategyHey everyone, thanks for joining! Below is the Quick Notes for the audio:
What is a Bearish Breakaway?
A Rare Reversal Candlestick Pattern that consists of 5 Candles, broken up into 3 parts:
Pt 1) Large Bullish Candle
Pt 2) 3 Small Bullish Candles
Pt 3) Large Bearish Candle (Confirmation)
What indicators can be used to Confirm?
1) Volume - Dwindles after the first Large Bullish Candle then Increases after the Large Bearish Candle
2) RSI - The reversal is part of a Bullish Divergence then drops below 50 after the pattern is formed
3) MACD - Crossover event with Signal above the MACD moving down towards 0 with Bearish bars developing on the Histogram
Strategy needed to trade the pattern?
Entry - On the Open of the candle after the 5th of Confirmation Candle
SL - Above the High of the Pattern
TP - Next areas of Support ( Conservative & Aggressive options )

80% of Traders Are Long USDCHFOver the past sessions, I’ve been closely monitoring USDCHF, and the current structure is starting to present a very interesting high-probability scenario.
From a price action perspective, the market has just rejected a major higher timeframe supply zone around 0.8000. This area has historically acted as a strong distribution zone, and the recent reaction confirms the presence of selling pressure.
At the same time, we are seeing a clear loss of momentum after the impulsive bullish move, with price now breaking internal structure and moving into a corrective phase.
Looking at retail sentiment, over 80% of traders are currently positioned long. This kind of imbalance typically acts as a contrarian signal, suggesting that the market is more likely to move against the crowd.
From a COT perspective, the US Dollar is starting to show signs of weakening, while the Swiss Franc positioning indicates potential accumulation. This divergence often precedes corrective or reversal phases.
Adding another layer, seasonality data for April shows a tendency for USDCHF to underperform, reinforcing the bearish or pullback scenario.
My Plan
At this stage, I am not interested in chasing the market.
Instead, I am focusing on two key scenarios:
1. Pullback & Continuation Short
If price retraces into the 0.7900–0.7950 area, I will look for bearish confirmations on lower timeframes to target a move towards 0.7800 and potentially 0.7750.
2. Reaction from Demand
If the market continues lower into the 0.7750–0.7800 zone, I will monitor for a structural shift (CHoCH) to potentially position for a short-term long back into premium.
Invalidation
A strong break and acceptance above 0.8050 would invalidate the bearish scenario and suggest continuation to the upside.

AUD/USD continues surging on risk-on revival ahead of China GDPAUD/USD is pushing higher ahead of Thursday's China data dump. With Middle East tensions easing and the US dollar softening, we break down the short-term setups and map out a medium-term reversal zone.
Key topics covered
China GDP: Markets expect Q1 growth to accelerate to 4.8% YOY. A strong print would support the Aussie.
Risk-on recovery : Easing geopolitical tensions have pushed the S&P 500 above pre-war levels, suggesting a broader recovery.
The 0.7250 cluster : Price is targeting a technical wall combining the 61.8% Fibonacci (0.7217), the upper channel resistance, and a broadening pattern top.
AUD/USD scenarios & trade plan
Bullish (Short-term) : If China data hits or beats 4.8%, traders may look for short-term longs targeting the 0.7188 peak and the 0.7217 - 0.7250 zone.
Bearish (Medium-term) : Watch for a spike into the 0.7200 - 0.7250 cluster. If we see wicky rejections and daily RSI divergence, the bias flips. Traders may fade the strength for a drop back to the mid-channel or the 0.6830 base.
Are you buying the Aussie into the China data or waiting to short the resistance? Share your thoughts in the comments.
This content is not directed to residents of the EU or UK. Any opinions, news, research, analyses, prices or other information contained on this website is provided as general market commentary and does not constitute investment advice.
ThinkMarkets will not accept liability for any loss or damage including, without limitation, to any loss of profit which may arise directly or indirectly from use of or reliance on such information.

Oil Market Disruption. A Game Changer.Introduction .
There have been three critical points in the chart that became the reference points in the last six years since the pandemic. The negative value of oil in the futures market during the pandemic (first time in history that you were paid to buy an oil futures contract); the fast expansion of the economy that created a huge demand of energy and put the oil to its highest level in years; and the War with Iran, where we are now.
Downtrend Channel.
After the pandemic the huge injection of liquidity in the economy created a large demand of goods and services, which require oil to move. “The army moves on its stomach.” Said Napoleon, the equivalent here is “The economy moves on Oil.” The economy grew too fast and the pace of production couldn’t catch up, creating a strong imbalance in the supply/demand equation, which was translated as inflation. The expansion of the inflation motivated the fed to increase interest rates to slow down the fast expansion and give the Economy room to catch up with the liquidity.
Cool down of the Economy.
The increase in the interest rates slowed down the economy, and we can indirectly measure it with the price of oil since the post pandemic peak. In a highly leveraged economy the way to reduce inflationary pressures is by increasing interest rates, this cools down the demand side of the equation and prevents a sudden recession, this was known as the “Soft Landing” strategy.
The Soft Landing.
It was working slowly but consistently and the goal was achieved. The economy continued to expand at a slower rate, the inflation went back to its target levels, the unemployment was kept in check and the Oil was heading down. Everything without triggering a harsh recession. The “Soft Landing” worked, and the next phase was to start slowly lowering the interest rates to allow the economy to expand at a slightly faster pace, keeping in check the Inflation. In a normal universe this would have completed the expansion/contraction cycle, but in this surrealistic environment where logic doesn’t seem to rule a big disturbance derailed the plans.
The World Oil Market disruption.
Out of the blue Trump decided that it was a great idea to hit Iran hard and decisively on the head, and what at first looked like a Venezuela II plan, it turned out to be just a shake in the wasp hive. Trump said there was no plan B, and I believe him. The original plan was to seek an Iran’s quick capitulation, but it was just an underestimation of Iran’s capabilities and an overestimation of USA’s. Overconfidence and underestimation in a strategical geopolitical region was a very bad miscalculation. For years the previous administrations acknowledged the difficulty of such an audacious campaign and decided to negotiate and keep the flow of the oil steady and uninterrupted rather than engaging in an endless war that could bring unforeseen consequences to the world economy. Now we see in practical terms why they went for a peaceful and consensual solution rather than a confrontational approach with Iran.
The consequences.
The Strait of Hormuz is a powder keg, and this conflict was the spark, we have a fire that only favored the BRICS coalition and greatly incentivized the use of PetroYuan over the PetroDollar, which puts the USA in a very unfavorable position where the adversaries have the upper hand now. The USA has the world reserve currency position compromised, and that’ll be another story. The immediate consequence of this war and disruption may trigger a stagflation, since the reason why the oil prices are high isn’t because of natural demand but for disruption of the supply after the War. This will create inflationary pressures since everything is indexed to the price of oil, and a lot of secondary and tertiary production chains depend on it. This is not about an overheated economy, so increasing the interest rates is not going to have the desired effect. The scenario is similar to the 1970’s stagflation when Paul Volcker had to put the economy to a halt because of very high interest rates and astronomical oil prices and he had to apply that sour medicine twice.
There’s hope in the future.
There is a dependency of oil because it is used for energy and petrochemical derivatives. We have to keep in mind that Oil is not going to last forever, and there’s a timer ticking that points to an exhaustion in oil reserves. Unless more powerful exploration and extraction technologies allow to safely go to the bottom of the ocean and extract oil from there or other sources, there will be a time when Oil will be done. This conflict only allowed Iran and the BRICS coalition to tighten their grip. The conflict approach was a bad idea and it is definitely not the solution now. Undoing this is going to span way over the Trump administration, a reconciliation approach is the immediate way to go. In the future alternative sources of energy like solar, electric, nuclear, eolic, have to be further developed for everyday needs, recycling and extraction of chemicals from different sources will break the dependency of the Economy from Oil.

Novo Nordisk - This is the end of the end!🦾Novo Nordisk ( NYSE:NVO ) just finished its bearmarket:
🔎Analysis summary:
Novo Nordisk remains in a clear uptrend despite the major correction of about -75%. But looking at the higher timeframe, Novo Nordisk is also retesting a significant confluence of support. This might actually be the end of the bearmarket and the start of something new.
📝Levels to watch:
$40
#LONGTERMVISION

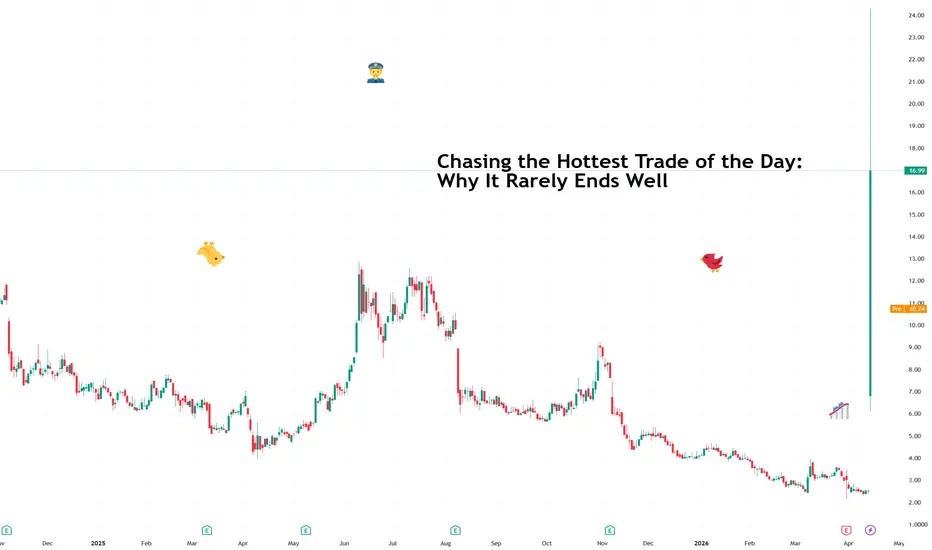
Chasing the Hottest Trade of the Day: Why It Rarely Ends WellYou’ve seen it happen. A forgotten stock suddenly explodes higher as headlines multiply, and you need to zoom out the chart to see where the candles went.
Yesterday it was Allbirds NASDAQ:BIRD , a footwear brand preparing to wind down operations that surged 583% after announcing a surprise pivot into artificial-intelligence infrastructure. Because, of course it’ll be AI.
The story is Netflix-worthy and in sync with the times we live in. The move looked irresistible and the attention arrived instantly. That combination often marks the exact moment when opportunity and risk begin competing for the same trade.
Markets love a comeback narrative. And that’s how Allbirds stock became the best-performing stock of the day.
📈 Momentum Feels Like Proof
Momentum simply means price is moving strongly in one direction. Strong momentum attracts capital because rising prices create confidence, and confidence invites participation.
The challenge appears when price strength becomes the reason for entry rather than the result of analysis. A stock moving quickly higher can feel like confirmation that something important is happening. In reality, it often means the move has already started without you.
Momentum works best when traders arrive early and manage risk carefully. Everything else is, you guessed it, FOMO.
🧠 Visibility Changes the Trade
Markets tend to move in stages. Early participants get in before headlines appear. The second group confirms the trend once price strengthens. The final wave arrives when the move becomes obvious to everyone watching the screen.
High visibility creates buzz and excitement. And that creates urgency. And urgency changes decision quality.
By the time a trade dominates conversations, early buyers are often managing profits while late arrivals are riding on hopium.
📉 Popular Trades Move Fast Both Ways
Crowded trades behave differently from quiet ones. When many traders hold the same position, price swings can accelerate quickly because everyone reacts to the same signals at the same time.
Liquidity describes how easily an asset can be bought or sold without moving price too much. In crowded situations, liquidity becomes fragile during reversals. A rally can extend rapidly, yet a pullback can travel just as quickly in the opposite direction.
Fast entries rarely come with calm exits.
🧭 A Smarter Way to Approach Hot Setups
Strong moves deserve attention because they often reveal where capital is flowing. That becomes useful when traders treat excitement as information rather than instruction.
Instead of chasing a breakout already making headlines, many traders wait for consolidation, which simply means a pause in price after a sharp move. It allows markets to reset and provides clearer structure for entries with defined risk.
Patience creates space for better decisions.
🎁 The Takeaway
The hottest trade of the day almost always looks convincing and hard to pass. Price strength attracts attention, narratives strengthen confidence, and participation builds quickly. That combination creates opportunity for just a few traders and pressure for the rest.
Examples like Allbirds show how quickly sentiment can shift when a new story captures the market’s imagination. The real edge comes from recognizing when a move is beginning and when it is already becoming crowded.
In the case of Allbirds, there was no way to know in advance unless you were an insider. But just so you wouldn’t feel bad — Allbirds shares are lower by 25% ahead of Thursday’s opening bell.
Off to you : How do you deal with rushed positions, hot trades, and meme stocks?
THE MYTH OF THE PERFECT TRADING STRATEGY🔥 THE MYTH OF THE PERFECT TRADING STRATEGY 🔥
Many traders waste years searching for a system that eliminates losses.
They find a strategy, experience early success, then abandon it after a series of losses and frustration. The cycle repeats, creating the illusion that the next method will finally deliver consistency.
The issue is not the strategy but the expectation of certainty.
📌 THE SYSTEM-HOPPING LOOP
Most traders operate within a predictable cycle:
Discover a new strategy
Experience an initial series of wins
Encounter an inevitable drawdown
Abandon the strategy and search again
This loop is driven by the desire for certainty.
Short-term success creates confidence. Losses then create doubt, even when those losses fall within normal statistical expectations.
Without a probabilistic mindset, every drawdown seems like a failure.
🧭 WHY THE “HOLY GRAIL” DOES NOT EXIST
First, there is no strategy that performs in all conditions.
Markets alternate between phases:
Trending environments
Range-bound conditions
Low volatility compression
High volatility expansion
A method designed for one environment will not do well in another.
Trend-following tools perform well in trending markets but struggle in consolidation. Range-based tools perform well in equilibrium but fail during expansion.
We cannot expect a static strategy cannot adapt to a dynamic market. Hence, consistency comes from selecting the right conditions, not from forcing one method across all conditions.
🎯 A STRATEGY IS ONLY A TRIGGER
A setup is not a complete trading plan.
On its own, it provides an entry signal. It does not define how to manage risk, evaluate context, or execute consistently.
A practical trading framework requires:
Context — understanding when the setup is valid
Risk management — controlling downside across trades
Execution discipline — following predefined rules under pressure
Review process — improving through reliable feedback
Without these, even a statistically sound setup can lead to net losses.
⚙️ CONTEXT DEFINES EDGE
The same setup can produce different outcomes depending on market conditions.
A pullback entry may perform well in a trending structure but fail repeatedly in a sideways range. A volatility breakout may succeed after compression but fail in already expanded conditions.
This is why it is important to evaluate the following:
Is the market trending or ranging?
Is volatility expanding or contracting?
Does the structure support continuation or reversal?
Context determines whether a setup is valid.
🧠 STRATEGY MUST MATCH THE TRADER
An often neglected consideration is that a method must align with the trader’s temperament.
Execution requirements vary significantly between approaches:
Short-term strategies require rapid decision-making and tolerance for frequent exposure
Longer-term strategies require patience and tolerance for extended drawdowns
High win-rate systems often involve smaller gains and occasional large losses
Low win-rate systems rely on infrequent but larger moves
Mismatch between strategy and personality leads to inconsistent execution and frequent frustration.
A method is only viable if it can be followed under pressure, not just understood in theory.
📉 CAPITAL AND DRAWDOWN REALITY
Every strategy includes periods of loss.
These are not anomalies. They are part of the cost of the trading business.
Failure often occurs due to insufficient capital to ride out the drawdowns (or position sizing that is too aggressive) rather than flawed methodology. But how do you know?
Key considerations:
Maximum drawdown must be understood before live execution
Position sizing must allow survival through losing streaks
Only risk capital should be deployed
If capital cannot withstand expected drawdown, the strategy will fail regardless of its edge. Having sufficient capital is a necessary, but not sufficient, condition for profitability.
📊 THINK IN SETS OF TRADES, NOT SINGLE TRADES
Evaluating a strategy based on a few trades is not meaningful.
Individual outcomes are random within a probabilistic system. Meaningful evaluation requires a sufficient sample size.
A structured approach:
Execute a minimum of 20–30 trades
Apply consistent rules across all trades
Record entries, exits, and context
Review results after the sample is complete
Without data, improvement is guesswork. You need reliable records to turn outcomes into actionable feedback.
🔍 FROM SETUP TO STRUCTURED PROCESS
To move beyond inconsistency, adopt this repeatable framework:
Select one strategy with clear rules
Define the conditions where it applies
Set fixed risk parameters per trade
Execute without deviation
Document all trades systematically
Review performance after a defined sample
This process shifts focus from outcome to execution quality.
📈 FINAL TAKEAWAY
The search for a perfect strategy is futile. No system eliminates losses, and no method performs equally across all conditions.
What matters:
Understanding when a strategy has edge
Managing risk across sequences of trades
Aligning the method with your temperament
Evaluating performance over meaningful samples
A strategy does not need to be perfect.
It needs to be consistent, repeatable, and applied within the appropriate context.
Stop searching for certainty. Start building a process that can operate within uncertainty.

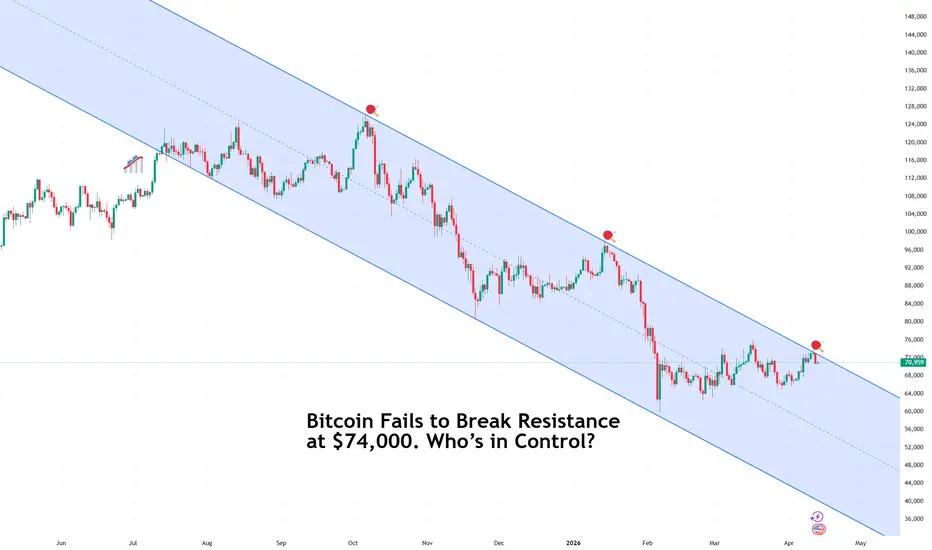
Bitcoin Fails to Break Resistance at $74,000. Who’s in Control?Bitcoin BITSTAMP:BTCUSD made another confident run toward $74,000 over the weekend, tapped the ceiling, and then stepped back as if reminded the door was still locked. Sellers showed up right on schedule, pushing the price down toward $70,500 early Monday.
This marks the third rejection at the top of a descending channel, a technical pattern where price moves between two downward-sloping lines. Traders often read this setup as a sign that rallies remain fragile until a clean breakout changes the structure.
🌍 Geopolitics Enter the Chat
The latest drop did not arrive quietly. Bitcoin slid to around $70,500 after the White House confirmed a naval blockade of the Strait of Hormuz , following failed negotiations between the United States and Iran over uranium enrichment limits.
Oil TVC:UKOIL responded immediately, jumping to $105 per barrel as the US Navy prepared to secure shipping routes and remove Iranian naval mines.
Crypto markets tend to react quickly when global risk rises. Traders reduce exposure, volatility increases, and Bitcoin behaves less like a hedge and more like a high-beta asset tied to broader sentiment.
📉 Descending Channel in Play
Technically speaking, Bitcoin remains inside a descending channel , which signals a market that is gradually trending lower despite occasional rallies.
Each time price approaches the upper boundary of that channel, sellers appear. And vice versa. At least until now. That pattern repeated near $74,000 last week, just as it did in January and again last October.
🧠 Why $70K Is Important
Round numbers matter more than most traders would admit. The $70,000 level has become a psychological anchor for Bitcoin in recent weeks.
Psychological levels are price zones where traders naturally cluster orders because they are easy and widely watched. When price holds above them, confidence improves. When price slips below them, caution spreads quickly.
As long as Bitcoin remains near this level, sentiment stays balanced between patience and concern.
⚠️ What If Support Slips
Analysts are watching $68,000 closely as the next technical checkpoint. A sustained move below that area could open the path toward $62,000, where stronger historical demand previously emerged.
Support levels function like floors in a building. One level breaks, traders look to the next one below for stability.
That possibility keeps short-term positioning cautious even as long-term conviction remains intact.
🎁 The Takeaway
Bitcoin’s rejection near $74,000 highlights a market still trading within a defined trend. Resistance remains firm, geopolitical tensions are shaping sentiment, and technical structure continues to favor caution over celebration.
At the same time, the $70,000 region continues to attract buyers and attention in equal measure.
Off to you : How are you trading the current setup? Bullish or bearish?
S&P 500 - at Massive Resistance
Point & Figure charts are a great tool to discover potential support/resistance areas.
Point and figure charts focus on price movements and trends without time consideration, using X’s for rising prices and O’s for falling prices.
The wider the row of X’s and O’s, the greater potential support/resistance.
The recent S&P 500 (SPX) bottomed out in a row of five.
Now the SPX is just below a row of eleven, this is potentially HUGE RESITANCE!
A significant SPX peak could be made in one or two trading days.

XAU/USD: Major Decision Zone Between 4,800 and 4,850Gold (XAU/USD) is currently in a corrective phase after a strong bullish impulse followed by a distribution phase near the highs around 5,300–5,400. After marking a peak, the market started an aggressive drop toward the 4,200 area, which represents a liquidity sweep and a key structural low. Since this bottom, price has entered a corrective rebound phase and is now retesting a major decision zone located around the 0.618 Fibonacci retracement between 4,800 and 4,850, which also aligns with a previous support area that has turned into resistance. The market is currently in a balance zone where buyers and sellers are competing, and the reaction at this resistance will be crucial for the next move.
A clear rejection below this zone would indicate weakness in the rebound and could trigger a new bearish move toward 4,400 and potentially 4,200 if selling pressure continues. On the other hand, a confirmed breakout above this zone would open the way for a bullish continuation toward 5,000, then 5,200, and potentially a retest of the 5,400 highs.
From a fundamental perspective, gold remains highly influenced by the US dollar and global risk sentiment, with the DXY being a key driver: a weaker dollar would support a bullish breakout, while a stronger dollar would increase the probability of a rejection at current resistance.
Overall, gold is in a strategic consolidation phase where the next major impulse will depend on the reaction at this key technical zone and macroeconomic conditions.

#QNT Quant — Two Falling Wedges - 80% Drawdown from ATHQNTUSDT Quant #QNT — Two Falling Wedges. One Decision Point with a retracement of over 80% from All time high of $430 from the charts.
Current price: $75.86
What's Happening
QNT has been in a slow, structured decline since its $430 high. But look closer at the weekly chart and you'll notice something most people miss — price isn't just falling randomly. It's compressing. Tightening. Coiling. Also There are two falling wedge structures nested inside each other, both pointing to the same zone. Both apexing right now.
What a Falling Wedge Actually Means
A falling wedge is not not always a bearish pattern. In this instance, It's a reset. Price pulls back in a controlled, narrowing range — seller momentum gradually weakens, buyers quietly absorb the pressure, and eventually the structure breaks in the direction of the larger trend.
What makes this setup significant? An inner wedge compressing inside an outer macro wedge means two layers of energy are being stored at the same price level. The release, when it comes, tends to be proportional to the full structure.
What Smart Money Is Likely Doing?
Before any real move higher, the $50–$60 zone below current price needs to be addressed. Stop losses from range participants sit there. Institutions typically clear that liquidity before committing to an upward move. If a wick into that zone appears — that's the bear trap and also an area of opportunity.
The Trigger to Watch:
A weekly close above the falling wedge resistance confirms the shift. That's the only signal worth acting on here. Until then, the structure is still compressing.
Price Targets If the Wedge Resolves Bullishly
TP1: $170.04
TP2: $243.67
TP3: $330.02
Macro extension: $417.66 → $666.53
Invalidation lives below a Weekly close under $50
Not financial advice. Always manage your risk and position size.*

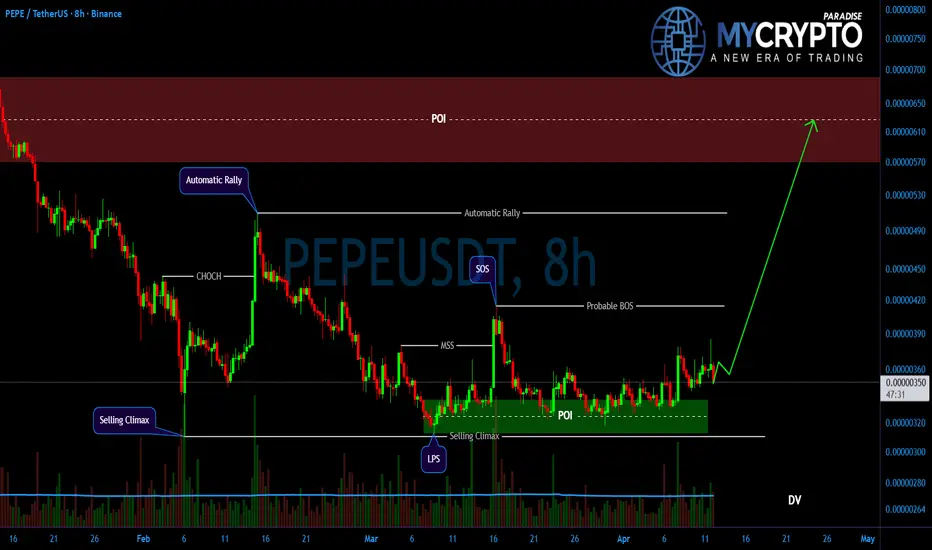
#PEPE Smart Money Accumulation Signals Bullish Expansion AheadYello Paradisers! Are you seeing the clean bullish transition on #PEPE, or are you still getting lost in lower timeframe noise while smart money builds positions?
💎#PEPEUSDT formed a clear Selling Climax (SC), where aggressive sell pressure was fully absorbed. This marked the likely end of the bearish phase and the beginning of accumulation.
💎Price then delivered a strong Change of Character (CHoCH), breaking the previous bearish structure and signaling that momentum was shifting in favor of buyers.
💎Following that, the market printed an Automatic Rally (AR), establishing a key resistance level and confirming the presence of bullish strength.
💎The pullback that followed formed a clean Last Point of Support (LPS), where buyers stepped in again, preventing further downside and maintaining structure.
💎A strong Bullish POI near the LPS was respected perfectly, with price reacting sharply from this zone, a clear sign of smart money accumulation.
💎Since then, price has started to rally upward, indicating growing bullish momentum and a potential transition into the markup phase. As long as the LPS holds, the bias remains bullish.
💎The primary target (Draw on Liquidity) sits at the Bearish POI, where price is likely to react next and where partial profits can be secured.
Discipline is key, Paradisers! Trust the structure, follow the sequence, and let the market confirm the move.
MyCryptoParadise
iFeel the success 🌴
KITE: Head and Shoulders ConfirmedKITE is behaving exactly according to the bearish scenario we outlined two weeks ago. The confirmation of the Head and Shoulders structure following a successful retest is a clear testament to the overwhelming dominance of the bears during this phase. When the price candles fail to breach the "neckline" – which was a former support level now officially transformed into a heavy psychological barrier – it signals that the macro downtrend has been firmly established. From a professional standpoint, the current decline is not a temporary correction but an inevitable consequence of exhausted buying power at higher price levels.
For investors currently holding Short positions from upper value zones, discipline is now the key to optimizing profits. Continuing to patiently hold toward lower target zones is the most rational strategy, as the market structure has yet to display any reversal signals. However, for those who missed the initial breakout move, it is crucial not to let the fear of missing out (FOMO) take control. Jumping onto a train that has traveled too far from its safety boundaries only increases risk and sabotages long-term risk management plans. In investing, opportunities always return, but your capital is limited. Keep a cool head and patiently await the next technical setup rather than trying to chase decisive red candles once smart money has already begun its exit.
this is not investment advice, DYOR

BTC Range Play: Rejection Likely Below $75K ResistanceCRYPTOCAP:BTC Range Still Intact 👀
Price is consolidating inside a clear range between $62.9K support and $74.9K resistance.
The recent move up looks like a push into the upper range, but still no breakout, just continued sideways action.
Structure remains weak overall, with price still trading below the major descending trendline.
This looks like a distribution rather than an accumulation.
Expecting rejection from the upper range and rotation back down toward $66K–$63K.
Until the range high breaks, there’s no reason to be bullish here.
DYOR, NFA
#Bitcoin

2008 IT CRASHED. 2022 IT CRASHED. 2026 — SAME WALL, SAME SETUP.One resistance line has stopped every major oil rally for 18 years. The market has never broken it.
📌 2008 — Hit the wall. Crashed from $147 to $33.
📌 2022 — Hit the wall. Collapsed from $130 to $65.
📌 2026 — Middle East conflict pushed WTI to $119.5. Resistance held. Already at $96.
Same wall. Three crashes. Watch closely.
🎯 TRADE SETUP
● Resistance: $115–$124
● Target: $70–$75
● Invalidation: Monthly close above $124
🌍 FUNDAMENTALS CONFIRM IT
● World producing 2.5M barrels/day more than consumed
● OPEC+ chose to pump more into an already oversupplied market
● EVs, efficient engines and remote work killing oil demand permanently
● J.P. Morgan NYSE:JPM : 60% global recession probability
● U.S. Energy Information Administration expects prices to fall through late 2026 and into 2027
The geopolitical spike is temporary. The oversupply is not.
📊 Putting It All Together
A rare geopolitical event just pushed NYMEX:CL1! directly into an 18-year resistance zone; the very wall that has stopped every major rally since 2008.
For educational purposes only. Not financial advice.
