Hello mates, have you noticed how Bitcoin often makes its biggest moves after periods of silence?
What looks like inactivity is rarely random it is usually preparation, so let’s understand what’s really happening.
Most traders approach Bollinger Bands with a very simplified mindset, often reducing it to overbought and oversold signals. While this interpretation is widely used, it fails to capture how markets actually behave in real conditions. Bitcoin does not react mechanically to indicators; instead, it moves through repeating cycles of volatility, expansion, and contraction. Bollinger Bands, when understood correctly, do not predict direction but provide a framework to observe how these cycles unfold over time.
At a structural level, Bollinger Bands expand and contract based on volatility. When volatility decreases, the bands tighten and price action becomes compressed within a narrow range. When volatility increases, the bands widen and price begins to move with momentum. This expansion and contraction is not random it reflects the natural rhythm of the market. In Bitcoin, this rhythm becomes even more pronounced due to its speculative nature and strong participation cycles.
One of the most important aspects to understand is the relationship between Bitcoin’s price and Bollinger Bands during different phases of the market. During trending environments, price does not simply reverse upon touching the upper or lower band. Instead, it often “rides” the band, especially in strong bullish phases where price consistently interacts with or remains near the upper band. This reflects sustained momentum rather than exhaustion. On the other hand, during ranging or low volatility conditions, price tends to oscillate between the bands without clear direction. This dynamic relationship shows that Bollinger Bands are not static boundaries, but adaptive structures that respond to how Bitcoin behaves in different environments.
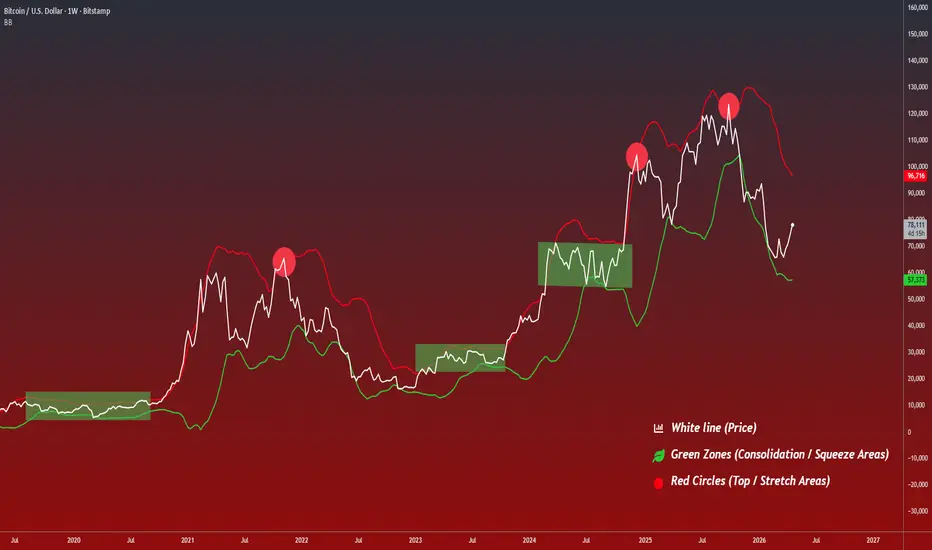
Periods where the bands contract tightly are often misunderstood as unimportant or inactive. In reality, these phases represent preparation. Price moves sideways, volatility drops, and the market appears quiet. However, this is typically where accumulation or re-accumulation takes place. Larger participants gradually build positions while retail traders lose interest due to the lack of movement. What looks like stagnation on the surface is often the foundation for the next major move.
As the market transitions out of this low volatility phase, expansion begins. The bands start to widen, and price breaks out of its range with increasing momentum. This is the phase where the market shifts from preparation to execution. The move that was previously hidden within a tight consolidation becomes visible, attracting more participants. It is important to note that by the time expansion is clearly visible, a significant portion of the move may already be underway.
In the later stages of a trend, price often stretches toward the outer bands, particularly the upper band in bullish conditions. This behavior is frequently misinterpreted as an immediate signal of reversal. However, it is more accurately a reflection of strong momentum combined with increasing volatility. Over time, as the trend matures, these extensions can begin to show signs of weakening. Price may still remain elevated, but the ability to sustain further expansion starts to diminish. This is where exhaustion or distribution-like behavior can emerge, often leading to slower price action or eventual corrections.
A common mistake among traders is to treat Bollinger Bands as direct trading signals rather than contextual tools. Assuming that every upper band touch is a sell signal or every lower band touch is a buy signal ignores the broader structure of the market. Similarly, dismissing low volatility phases as irrelevant can lead to missed opportunities, as these are often the periods where the most strategic positioning occurs.
A more refined approach is to interpret Bollinger Bands through the lens of behavior. A squeeze should be viewed as a phase where potential energy is building within the market. Expansion should be understood as the release of that energy, confirming that a move is in progress. Extended interaction with the bands should not be immediately faded, but rather analyzed in the context of trend strength and maturity.
The chart illustrates this repeating cycle clearly. The highlighted consolidation zones show how periods of low volatility consistently precede strong expansions. These expansions then transition into phases where price begins to stretch and gradually lose momentum. This sequence compression, expansion, and eventual exhaustion repeats across different timeframes and market conditions, forming a recognizable pattern in Bitcoin’s behavior.
Ultimately, Bollinger Bands are most effective when used to understand the timing and nature of market activity rather than to predict exact turning points. They provide insight into when the market is quiet, when it is becoming active, and when it may be approaching a stage of diminishing momentum. This perspective allows traders to shift from reacting to price movements toward anticipating structural changes.
In simple terms, value is often built when the market is quiet, and it becomes visible when the market expands. Recognizing this transition is what separates surface-level indicator usage from a deeper understanding of market behavior.
Volatility doesn’t appear randomly it expands after it has been quietly compressed. If you can read that transition, you stop chasing moves and start anticipating them.
Thanks for reading.
Regards- Amit.
What looks like inactivity is rarely random it is usually preparation, so let’s understand what’s really happening.
Most traders approach Bollinger Bands with a very simplified mindset, often reducing it to overbought and oversold signals. While this interpretation is widely used, it fails to capture how markets actually behave in real conditions. Bitcoin does not react mechanically to indicators; instead, it moves through repeating cycles of volatility, expansion, and contraction. Bollinger Bands, when understood correctly, do not predict direction but provide a framework to observe how these cycles unfold over time.
At a structural level, Bollinger Bands expand and contract based on volatility. When volatility decreases, the bands tighten and price action becomes compressed within a narrow range. When volatility increases, the bands widen and price begins to move with momentum. This expansion and contraction is not random it reflects the natural rhythm of the market. In Bitcoin, this rhythm becomes even more pronounced due to its speculative nature and strong participation cycles.
One of the most important aspects to understand is the relationship between Bitcoin’s price and Bollinger Bands during different phases of the market. During trending environments, price does not simply reverse upon touching the upper or lower band. Instead, it often “rides” the band, especially in strong bullish phases where price consistently interacts with or remains near the upper band. This reflects sustained momentum rather than exhaustion. On the other hand, during ranging or low volatility conditions, price tends to oscillate between the bands without clear direction. This dynamic relationship shows that Bollinger Bands are not static boundaries, but adaptive structures that respond to how Bitcoin behaves in different environments.
Periods where the bands contract tightly are often misunderstood as unimportant or inactive. In reality, these phases represent preparation. Price moves sideways, volatility drops, and the market appears quiet. However, this is typically where accumulation or re-accumulation takes place. Larger participants gradually build positions while retail traders lose interest due to the lack of movement. What looks like stagnation on the surface is often the foundation for the next major move.
As the market transitions out of this low volatility phase, expansion begins. The bands start to widen, and price breaks out of its range with increasing momentum. This is the phase where the market shifts from preparation to execution. The move that was previously hidden within a tight consolidation becomes visible, attracting more participants. It is important to note that by the time expansion is clearly visible, a significant portion of the move may already be underway.
In the later stages of a trend, price often stretches toward the outer bands, particularly the upper band in bullish conditions. This behavior is frequently misinterpreted as an immediate signal of reversal. However, it is more accurately a reflection of strong momentum combined with increasing volatility. Over time, as the trend matures, these extensions can begin to show signs of weakening. Price may still remain elevated, but the ability to sustain further expansion starts to diminish. This is where exhaustion or distribution-like behavior can emerge, often leading to slower price action or eventual corrections.
A common mistake among traders is to treat Bollinger Bands as direct trading signals rather than contextual tools. Assuming that every upper band touch is a sell signal or every lower band touch is a buy signal ignores the broader structure of the market. Similarly, dismissing low volatility phases as irrelevant can lead to missed opportunities, as these are often the periods where the most strategic positioning occurs.
A more refined approach is to interpret Bollinger Bands through the lens of behavior. A squeeze should be viewed as a phase where potential energy is building within the market. Expansion should be understood as the release of that energy, confirming that a move is in progress. Extended interaction with the bands should not be immediately faded, but rather analyzed in the context of trend strength and maturity.
The chart illustrates this repeating cycle clearly. The highlighted consolidation zones show how periods of low volatility consistently precede strong expansions. These expansions then transition into phases where price begins to stretch and gradually lose momentum. This sequence compression, expansion, and eventual exhaustion repeats across different timeframes and market conditions, forming a recognizable pattern in Bitcoin’s behavior.
Ultimately, Bollinger Bands are most effective when used to understand the timing and nature of market activity rather than to predict exact turning points. They provide insight into when the market is quiet, when it is becoming active, and when it may be approaching a stage of diminishing momentum. This perspective allows traders to shift from reacting to price movements toward anticipating structural changes.
In simple terms, value is often built when the market is quiet, and it becomes visible when the market expands. Recognizing this transition is what separates surface-level indicator usage from a deeper understanding of market behavior.
Volatility doesn’t appear randomly it expands after it has been quietly compressed. If you can read that transition, you stop chasing moves and start anticipating them.
Thanks for reading.
Regards- Amit.
Moderator, TradingView
(No Trading Advice)
(No Trading Advice)
Related publications
Disclaimer
The information and publications are not meant to be, and do not constitute, financial, investment, trading, or other types of advice or recommendations supplied or endorsed by TradingView. Read more in the Terms of Use.