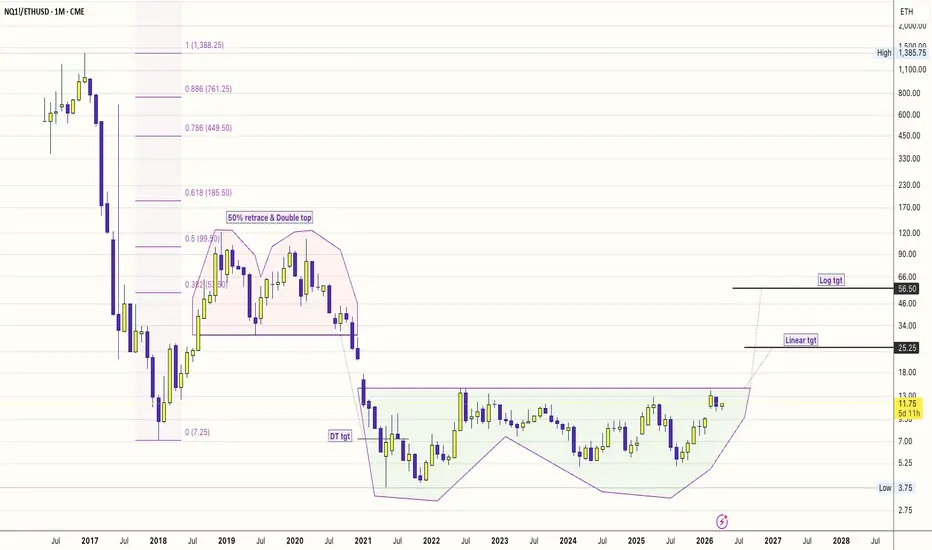
AI Infra > DeFi Infra: The 4-Year Relative Strength Breakout!1. The "Big Base" Logic
Observation: A 4-year base (2022–2026) in the NQ/ETH ratio.
This isn't just a price move; it’s a liquidity migration.
#DeFi (Ethereum) was the hero of the low-interest-rate era (2020-2021).
But in 2026, the "Real World" needs GPUs, data centers, and power grids.
The Nasd
NASDAQ 100 E-mini Futures
No trades
About NASDAQ 100 E-mini Futures
An index composed of the 100 largest, most actively traded US companies listed on the Nasdaq stock exchange. This index includes companies from a broad range of industries with the exception of those that operate in the financial industry, such as banks and investment companies.
Related futures
NQ: One hour_Up Fibonacci_+1,706 Ticks to targetThe NQ one hour time frame is in an up trend.
The market is making higher highs and higher lows.
The market has an up Fibonacci with an extension
price point 27472.50 about +1,706 Ticks above. As
long as the market does not take out the one boundary
price point 25933.75. The expectation is the mark

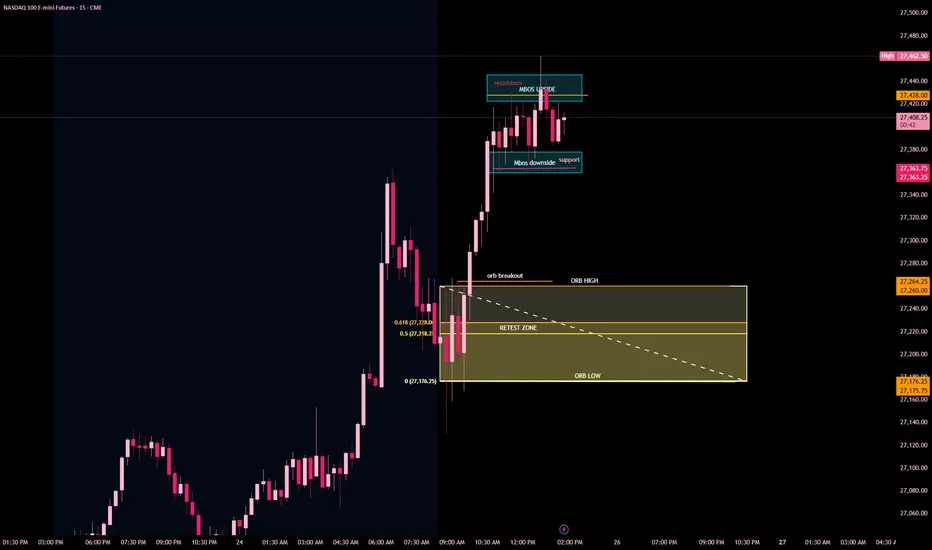
ORB strategy backtest
Planned this as an ORB retest play, but price never gave the clean pullback after the breakout. Instead of forcing it, I waited for an mBOS + momentum confirmation and took the entry there. Different model, same idea just let price lead I will try again with ORB soon
Why I Stopped Building Indicators and Started Building AgentsMost automated trading systems are built like single-purpose machines: one strategy, one set of rules, one set of conditions to meet. They work until the regime they were built for ends, and then they don't.
The interesting question isn't how to make a single strategy more robust. It's whether robus
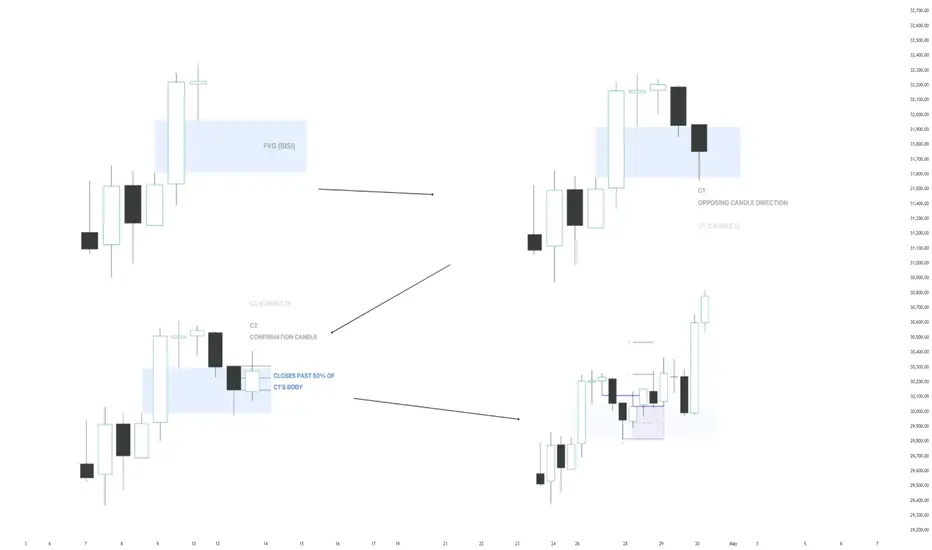
MBZ Model Type 4 - Continuation ModelMBZ Model Type 4 is a continuation pattern built around the failed displacement of a Fair Value Gap, followed by structural confirmation in the original trend direction. Once the formation completes, it projects forward extension levels that mark where delivery is expected to resume after a controll
DANGER WILL ROBINSON DANGER!Going to say it now - we make new ATHs and then something black swan-like (probably credit) will destroy the market shortly after. Maybe they give us a few weeks, or a few months, but this will eventually happen. Too much stress under the foundations of our financial and economic system. If you want

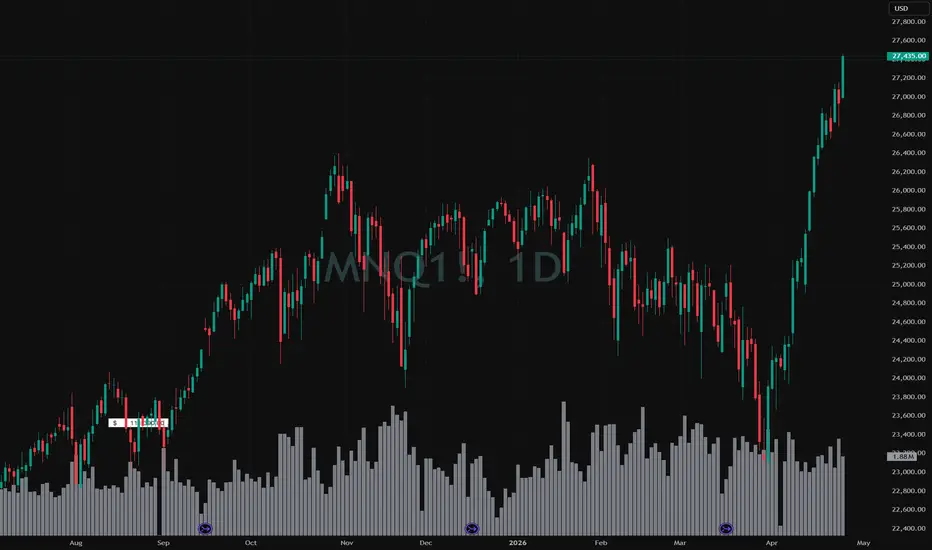
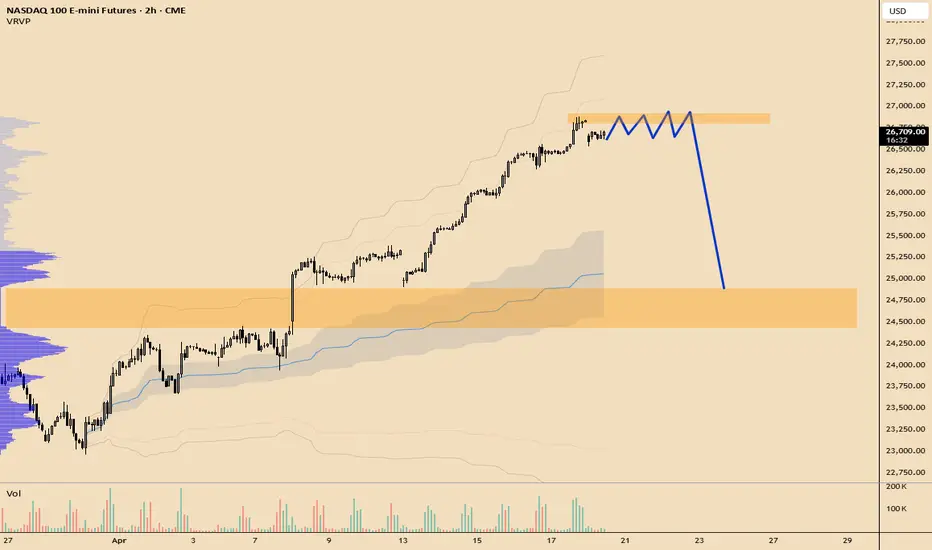
NQ Range (04-20-26)NAZ out above prior churn zone, looking for a pull back this week. Down yellow is the PB move, yellow at 27,200 is target and start of turn zone that goes to 28k. The CZ started in 2025, we had the 1,500 point move below and looking for the same above CZ only to return back into the CZ. Above 28k w

The end game, stagflation by 2027 then depression by 2029The generational economic cycle is closing the doors soon. Hard days are coming ahead and many will rush to exit doors. The oil shock impact will be fully in effect by YE in all sectors and supply chains. Hyperinflation will be fought by rising interest rates to record levels leading to a recession
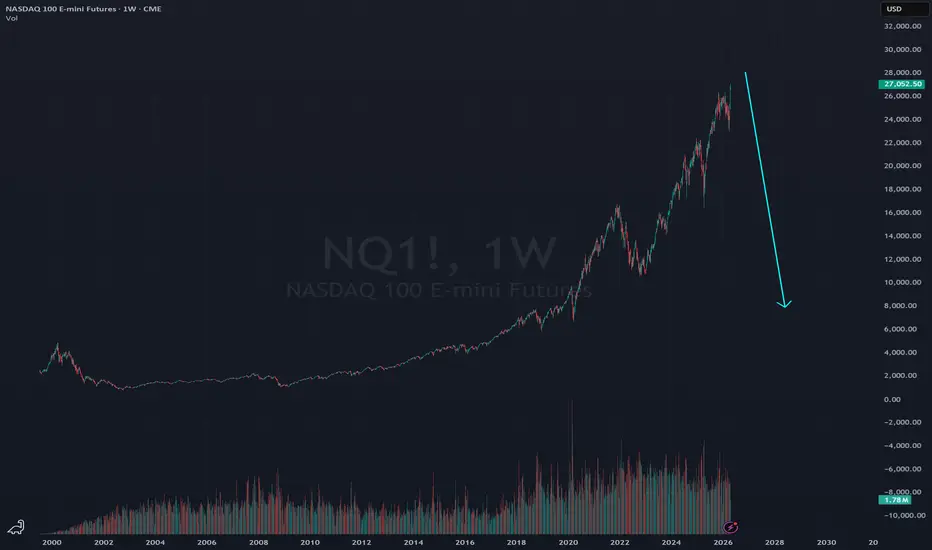
Nasdaq - time to make a drop Nasdaq - time to make a drop
price of nasdaq - overextended ofthen price come back to vwao
that's why i think we can see $25 000 - 25 500 this week
The Nasdaq Peak: Why Smart Money Is Scaling Out of NAS100The Nasdaq 100 is currently displaying classic signs of an overextended market, and if you’re still chasing the long side here, you might be providing the exit liquidity for smart money. In today's analysis, we break down the NAS100 price action, why the lack of daily red candles is a major red flag

See all ideas
Summarizing what the indicators are suggesting.
Neutral
SellBuy
Strong sellStrong buy
Strong sellSellNeutralBuyStrong buy
Neutral
SellBuy
Strong sellStrong buy
Strong sellSellNeutralBuyStrong buy
Neutral
SellBuy
Strong sellStrong buy
Strong sellSellNeutralBuyStrong buy
A representation of what an asset is worth today and what the market thinks it will be worth in the future.
Displays a symbol's price movements over previous years to identify recurring trends.
Frequently asked questions
The current price of NASDAQ 100 E-mini Futures is 27,491.25 USD — it has risen 0.18% in the past 24 hours. Watch NASDAQ 100 E-mini Futures price in more detail on the chart.
The volume of NASDAQ 100 E-mini Futures is 10.18 K. Track more important stats on the NASDAQ 100 E-mini Futures chart.
Open interest is the number of contracts held by traders in active positions — they're not closed or expired. For NASDAQ 100 E-mini Futures this number is 276.71 K. You can use it to track a prevailing market trend and adjust your own strategy: declining open interest for NASDAQ 100 E-mini Futures shows that traders are closing their positions, which means a weakening trend.
Buying or selling futures contracts depends on many factors: season, underlying commodity, your own trading strategy. So mostly it's up to you, but if you look for some certain calculations to take into account, you can study technical analysis for NASDAQ 100 E-mini Futures. Today its technical rating is buy, but remember that market conditions change all the time, so it's always crucial to do your own research. See more of NASDAQ 100 E-mini Futures technicals for a more comprehensive analysis.