Want to Know Where Gold is Heading? Look at JP10Y!Want to Know Where Gold is Heading? Look at JP10Y!
+0.89 correlation: Did you know about this relationship between Japanese bonds and gold?"
One of the most overlooked indicators by gold investors is Japanese Government Bonds (JP10Y). When we examine the price movement over the past 5 years, a surprising relationship emerges: wherever JP10Y goes, gold follows!
📊 Correlation Analysis
The correlation coefficient between the two instruments is at +0.89 level, which means a very strong positive relationship.
On the chart, the red (JP10Y) and yellow (XAU/USD) lines move almost parallel. When JP10Y enters an uptrend, gold ounce seriously follows it, especially since January 2024, gold has caught a strong bull trend together with the rise in JP10Y.
🧠 So Why Does This Relationship Exist?
Why does gold rise when Japanese bond yields go up?
Japan kept interest rates very low for years, almost at 0% level. That's why investors borrowed cheaply from Japan and invested this money in high-interest countries. This strategy is known as "Carry Trade" and was very profitable for years.
Now the situation has changed. Japanese bond yields have started to rise and borrowing from Japan is becoming expensive. Investors are beginning to review their carry trade positions, saying "this business is not that profitable anymore."
When JP10Y rises, investors think: carry trade risk is increasing, uncertainty in markets may rise, and I may need to flee to safe haven. Also, when JP10Y rises, the Japanese Yen strengthens, a strong Yen puts pressure on the dollar, and a weak dollar pushes gold up because gold is priced in dollars.
As a result, when JP10Y rises, both the safe haven search and dollar weakness feed gold.
💡 Important Note for Investors
JP10Y can be used as a leading indicator for gold.
When JP10Y is in an uptrend, the expectation of a rise for gold may strengthen, if a sudden drop is seen in JP10Y, a correction may occur in gold, and the breakdown of correlation can be an early warning signal for a trend change.
📌 Conclusion
When investing in gold, it's not enough to just look at the dollar, the FED, or geopolitical events. Indirect indicators like JP10Y can also seriously affect your portfolio strategy. Critical level to watch: JP10Y holding above 1,5 may give a positive signal for gold.
Thanks for reading.
Community ideas

Doge and a BIG rise!Hi!
As shown on the chart, DOGE has clearly broken above the long-term descending trendline, which had been acting as resistance for several weeks. Following this breakout, price moved higher and confirmed the shift in market structure.
Importantly, the breakout was supported by a strong bullish engulfing move, taking out the previous local high. This price action strengthens the case for a trend reversal rather than a simple relief bounce.
After the impulsive move up, DOGE is now pulling back toward a key demand zone around $0.11–$0.13, which aligns with prior structure support and the breakout retest area. This zone offers a favorable risk-to-reward opportunity for long positions.
As long as price holds above this support, the upside target remains around $0.17, which corresponds to the next major resistance level and the projected move from the breakout.

Netflix Stock Dives as Crowds Reach for the Remote: Binge Over?Netflix NASDAQ:NFLX investors who hit play heading into the earnings were expecting a feel-good episode. Instead, they got a cliffhanger — and not the good kind.
Shares of the streaming giant are lower by about 5% pre-market Wednesday, even after the company posted better-than-expected fourth-quarter earnings.
So what happened? In short: margins. Or rather, the lack of excitement around them.
Netflix reported a Q4 profit of 56 cents per share, edging past expectations , with revenue jumping nearly 18% year over year to $12.05 billion. Then Netflix dropped its 2026 margin guidance, and the mood changed fast.
💰 The Numbers
On paper, the quarter looked solid. Net income climbed to $2.42 billion, up from $1.87 billion a year earlier. Revenue beat forecasts. Subscriber momentum held with 325 million paid users around the globe.
Looking ahead, Netflix guided full-year 2026 revenue between $50.7 billion and $51.7 billion, comfortably around — and slightly above — Wall Street’s expectations. So far, so binge-worthy.
But then came the fine print. Netflix expects an operating margin of 31.5%, below the 32.6% analysts had penciled in. In an environment where every basis point is treated like a plot twist, that was enough to send shares tumbling.
🎬 The Warner Deal
Margins didn’t just slip on their own. Netflix said its outlook includes about $275 million in expenses tied to its planned acquisition of Warner Bros. Discovery’s NASDAQ:WBD streaming and studios assets — a move that’s ambitious, expensive, and not without controversy.
The deal carries a price tag of roughly $83 billion, valuing the Warner assets at about 25 times expected 2026 EBITDA. For comparison, Disney trades at around 11 times its expected EBITDA. Investors noticed the gap, apparently. Also, Paramount NASDAQ:PSKY is still trying to figure out how to grab the entire Warner Bros. studios.
Netflix has also paused its share buybacks, choosing instead to conserve cash to fund the acquisition. That may make strategic sense, but buybacks are a favorite comfort blanket for shareholders — and taking it away rarely goes well.
📚 The Content
Management made the strategic case clear. Warner’s library, development pipeline, and IP — plus HBO Max — would supercharge Netflix’s content offering and allow for more personalized and flexible subscription options.
Co-CEO Ted Sarandos called the deal a “strategic accelerant,” insisting Netflix can pursue it while still delivering “healthy growth.”
Still, investors aren’t just weighing the upside. There are real risks:
A hostile bid from Paramount Skydance complicating the landscape
Regulatory scrutiny that could delay or derail the transaction
Integration challenges that could pressure margins further
📉 The Stock
Markets don’t trade earnings only; they also trade expectations. And Netflix entered this report priced for near-perfection.
Shares are now set to open around $82, a one-year bottom, and are lower by more than 35% from the $134 peak hit last June. That’s a brutal correction for a company that still dominates global streaming.
But this is what happens when growth stocks promise expansion and efficiency at the same time. If one wobbles — even slightly — the reaction can be swift.
🛋️ A Buying Opportunity?
Not everyone is reaching for the remote, though. Some analysts argue the pullback creates a chance to snap up shares at a relatively attractive valuation, especially for a company that continues to grow profits and cash flow — whether or not the Warner deal closes.
Netflix still has scale, pricing power, and a global audience most media companies would happily trade their studios for. The question isn’t whether Netflix is broken. It’s whether investors are comfortable sitting through a more complicated chapter.
The earnings season continues with Intel NASDAQ:INTC reporting tomorrow. A bunch of Magnificent Seven folks are slated for updates next week, including Apple NASDAQ:AAPL , Microsoft NASDAQ:MSFT , Amazon NASDAQ:AMZN , Meta NASDAQ:META , and Tesla NASDAQ:TSLA .
Off to you : Are you looking to snap it up? Or waiting for the dip of the dip? Share your views in the comments!

XAUUSD (GOLD) – 4-Hour Timeframe Tradertilki AnalysisGuys,
I have prepared a XAUUSD-Gold analysis for you on the 4-hour timeframe.
My friends, the levels of 4657.0 and 4599.0 are the best buy entry points.
When price reaches these levels, I will definitely open a buy position and aim for the following targets:
My targets:
1st Target: 4690.0
2nd Target: 4730.0
3rd Target: 4790.0
My friends, since the U.S. president has recently imposed tariffs on Europe, there is currently strong buying volume in XAUUSD-Gold. From a fundamental perspective, this is the biggest reason for gold’s upward movement.
NOTE – Since the U.S. president has not lifted these tariffs regarding Greenland and has opened a trade war against European countries, XAUUSD-Gold may rise even from these levels and reach my 3 targets.
My friends, I share these analyses thanks to each like I receive from you. Your likes increase my motivation and encourage me to support you in this way.🙏
Thank you to all my friends who support me with their likes.❤️

Why Micron’s 26,000% Legacy is Just the BeginningWhy Micron’s 26,000% Legacy is Just the Beginning
To learn how to operate in the stock market it is interesting to stop thinking about money for a while and start understanding what is actually happening.
Today I bring you an example with NASDAQ:MU a company that in less than 20 years has offered a 26,000% return and is now a global benchmark.
However this has not always been the case and certain events have determined market movements for months and years. Learning from these movements helps you better capture the long term essence of the market what is valued and what is not. Understanding that suffering is temporary if the company knows how to reverse it and that these drops can offer wonderful opportunities.
1️⃣ Micron did not start as a multinational. In fact it was 4 people with a consulting vocation in the 70s but they quickly pivoted to manufacturing DRAM the short term memory of a computer and became famous for being the scrappy low cost leader . While many American chipmakers quit when faced with fierce Japanese competition in the 80s Micron survived by being leaner and more efficient than anyone else.
2️⃣ From the year 2000 Micron was a slave to PC cycles . As seen in the 2000 Dot Com crash and the 2015 price wars if people stopped buying computers Micron’s profits vanished . But they transformed the company. During these winters Micron played a game of Last Man Standing . When competitors like Qimonda in 2009 went bankrupt Micron did not just survive they expanded . By acquiring rivals like Elpida in 2013 they helped turn a crowded chaotic market into a stable Oligopoly dominated by just three players Samsung SK Hynix and Micron .
3️⃣ Recently Micron has made one more masterstroke . It has no longer just achieved being part of a commodity oligopoly. They are now the architects of HBM or High Bandwidth Memory. Think of HBM as a super highway for data . This is CRUCIAL since AI chips like those from Nvidia are incredibly fast but they need memory that can keep up. Micron’s transformation into a specialized AI partner means they now command higher prices and stronger loyalty than ever before.
On the other hand I leave you a chronology of the most outstanding fundamental events and how they fit with the chart and the trend change points.
Key Historical Market Movers
🔴 September 21 2000 -> The Dot Com Crash and Intel Warning Intel issued a massive profit warning due to weak PC demand in Europe triggering a sector wide collapse . Micron’s stock plummeted as the era of irrational exuberance for hardware components came to a violent end.
🔴 October 4 2006 -> Lexar Integration and Windows Vista Delay Micron reported disappointing quarterly margins following the acquisition of Lexar Media. The market reacted negatively to the integration costs and the delayed launch of Windows Vista which stalled the expected PC refresh cycle.
🟢 January 23 2009 -> Qimonda Bankruptcy and Market Bottom German rival Qimonda filed for insolvency significantly reducing the global supply of DRAM . This event created a long term price floor for the industry and marked the start of a massive recovery for surviving players like Micron.
🔴 January 7 2015 -> Samsung’s Price War and PC Weakness Concerns peaked as Samsung signaled aggressive capacity expansion despite slowing PC sales. Investors fled Micron fearing a return to the race to the bottom in memory pricing leading to a sharp double digit decline.
🟢 May 23 2016 -> The Bernstein Upgrade , analysts at Bernstein upgraded the stock spotting a fundamental shift toward supply discipline among the big three. This call accurately predicted the end of the memory winter and the start of a multi year bull run .
🟢 March 20 2024 -> AI Validation and Nvidia Partnership Micron reported a surprise profit and confirmed that its high bandwidth memory HBM3E was sold out for the year. This solidified the company’s role as a critical pillar in the AI infrastructure alongside Nvidia.
🟢 May 22 2025 -> The AI Supercycle Peak Guidance Capitalizing on the insatiable demand for AI servers Micron issued record breaking guidance for the second half of the year. This news triggered a massive rally as the stock broke through major psychological resistance levels.
🧑💻 Taking advantage
This transformation can make MU prices go to levels never before seen or imagined but we also have the support of the charts.
Recently we have broken a Double Top to the upside and this usually implies very very significant increases in the long term.
It seems that NASDAQ:MU can easily exceed 1,000 dollars in the coming years as it has such important technology for the new era of AI. I will not go into the technical part but almost 75 percent of cases of a double top breakout send the price to the equivalent of a 700 percent rally from the breakout of this double top.
That is why it is vital to be attentive to chart patterns to catch these types of operations where the fundamental and technical parts match perfectly. Furthermore knowing this about the long term it is very easy to find bullish entries in the short term and take advantage of the small rallies that arise within a rally of so many years like this one for MU.
👇 WANT MORE?
Hit the rocket , read my profile or follow so we can find each other again.

Magnificent 7: a decisive short-term technical compressionCan the S&P 500 index avoid a corrective move back toward its former all-time high zone (6,150–6,200 points) after posting nine consecutive months of gains and trading at very demanding valuation levels? This is the central question for equity markets in the first quarter of 2026, and the answer largely depends on the technology sector, particularly the Magnificent Seven stocks.
The key fundamental and technical factors are as follows:
• The technology sector represents 34% of the S&P 500 index calculation.
• The Magnificent Seven will begin reporting quarterly earnings from late January.
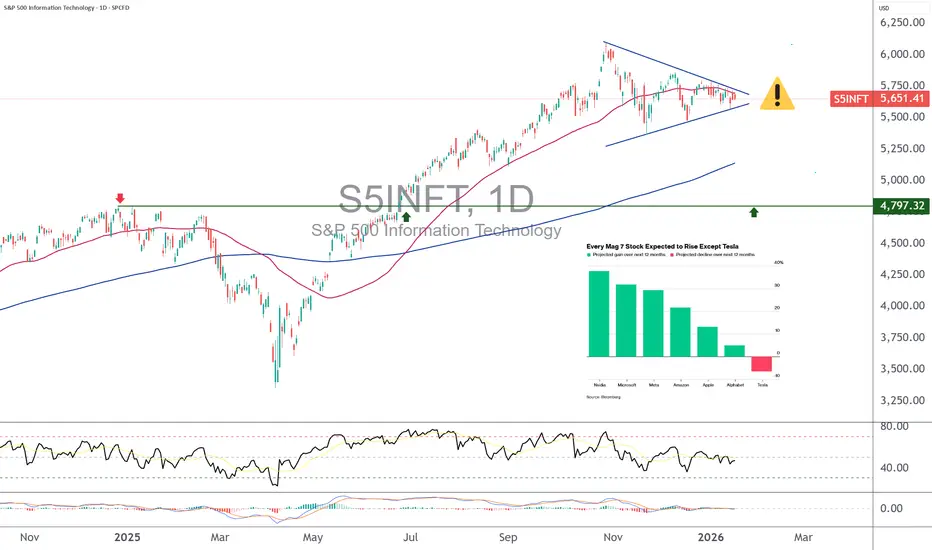
• Technical analysis of the technology sector index reveals a chart compression pattern that should resolve soon, with the direction of the breakout likely to have a strong impact on the S&P 500.
• At this stage, financial analysts remain optimistic about the 12-month performance outlook for Magnificent Seven stocks.
From a technical standpoint, the technology sector index has been trading for several weeks within a symmetrical triangle compression pattern. This setup reflects a temporary balance between buyers and sellers following the strong rally seen in 2025. As the compression matures, the eventual breakout tends to be more directional and impulsive. The direction of this breakout should provide a clear indication of the S&P 500 trend toward the end of January.
The market therefore appears to be waiting for a clear catalyst capable of triggering a decisive reallocation. That catalyst could well be the earnings season of the Magnificent Seven, which concentrate growth expectations, elevated valuation multiples, and a significant share of U.S. market capitalization.
On the fundamental side, consensus expectations remain broadly supportive. Twelve-month projections still point to upside potential for most stocks in the group, particularly Nvidia, Microsoft, and Meta, driven by themes such as artificial intelligence, cloud computing, and platform monetization. This confidence contrasts with the case of Tesla, where expectations appear more cautious or even negative due to margin pressure and a more challenging competitive environment.
The chart below shows the average upside expected by financial analysts (according to Bloomberg) for Magnificent Seven stocks over the next 12 months.
Finally, this analysis should be placed within the broader context of sector concentration. With nearly one-third of the S&P 500’s weight, technology acts as a true market pivot. A bullish breakout from the technical compression would reinforce the scenario of an S&P 500 capable of consolidating sideways or continuing higher without a deep correction. Conversely, a downside break, even a limited one, could trigger a more pronounced consolidation phase, with a move back toward medium-term support levels.
The table below highlights the weight of the 11 super sectors in the S&P 500 index. The technology sector alone accounts for 34% of the index.
In summary, the market is entering a decision phase. In the short term, the trajectory of the S&P 500 will largely depend on how the technology sector reacts to its earnings results and on the ability of the Magnificent Seven to justify, with hard numbers, already demanding valuations.
DISCLAIMER:
This content is intended for individuals who are familiar with financial markets and instruments and is for information purposes only. The presented idea (including market commentary, market data and observations) is not a work product of any research department of Swissquote or its affiliates. This material is intended to highlight market action and does not constitute investment, legal or tax advice. If you are a retail investor or lack experience in trading complex financial products, it is advisable to seek professional advice from licensed advisor before making any financial decisions.
This content is not intended to manipulate the market or encourage any specific financial behavior.
Swissquote makes no representation or warranty as to the quality, completeness, accuracy, comprehensiveness or non-infringement of such content. The views expressed are those of the consultant and are provided for educational purposes only. Any information provided relating to a product or market should not be construed as recommending an investment strategy or transaction. Past performance is not a guarantee of future results.
Swissquote and its employees and representatives shall in no event be held liable for any damages or losses arising directly or indirectly from decisions made on the basis of this content.
The use of any third-party brands or trademarks is for information only and does not imply endorsement by Swissquote, or that the trademark owner has authorised Swissquote to promote its products or services.
Swissquote is the marketing brand for the activities of Swissquote Bank Ltd (Switzerland) regulated by FINMA, Swissquote Capital Markets Limited regulated by CySEC (Cyprus), Swissquote Bank Europe SA (Luxembourg) regulated by the CSSF, Swissquote Ltd (UK) regulated by the FCA, Swissquote Financial Services (Malta) Ltd regulated by the Malta Financial Services Authority, Swissquote MEA Ltd. (UAE) regulated by the Dubai Financial Services Authority, Swissquote Pte Ltd (Singapore) regulated by the Monetary Authority of Singapore, Swissquote Asia Limited (Hong Kong) licensed by the Hong Kong Securities and Futures Commission (SFC) and Swissquote South Africa (Pty) Ltd supervised by the FSCA.
Products and services of Swissquote are only intended for those permitted to receive them under local law.
All investments carry a degree of risk. The risk of loss in trading or holding financial instruments can be substantial. The value of financial instruments, including but not limited to stocks, bonds, cryptocurrencies, and other assets, can fluctuate both upwards and downwards. There is a significant risk of financial loss when buying, selling, holding, staking, or investing in these instruments. SQBE makes no recommendations regarding any specific investment, transaction, or the use of any particular investment strategy.
CFDs are complex instruments and come with a high risk of losing money rapidly due to leverage. The vast majority of retail client accounts suffer capital losses when trading in CFDs. You should consider whether you understand how CFDs work and whether you can afford to take the high risk of losing your money.
Digital Assets are unregulated in most countries and consumer protection rules may not apply. As highly volatile speculative investments, Digital Assets are not suitable for investors without a high-risk tolerance. Make sure you understand each Digital Asset before you trade.
Cryptocurrencies are not considered legal tender in some jurisdictions and are subject to regulatory uncertainties.
The use of Internet-based systems can involve high risks, including, but not limited to, fraud, cyber-attacks, network and communication failures, as well as identity theft and phishing attacks related to crypto-assets.
GOLD: Bullish! Buys Only! Buy The Dips!In this Weekly Market Forecast, we will analyze Gold (XAUUSD) for the week of Jan. 19-24th.
Gold is climbing higher, with Trump tariff threats as winds beneath the wings!
There is no reason to consider longs! Pullbacks should be seen as dip-buying opportunities.
It's that simple.
Enjoy!
May profits be upon you.
Leave any questions or comments in the comment section.
I appreciate any feedback from my viewers!
Like and/or subscribe if you want more accurate analysis.
Thank you so much!
Disclaimer:
I do not provide personal investment advice and I am not a qualified licensed investment advisor.
All information found here, including any ideas, opinions, views, predictions, forecasts, commentaries, suggestions, expressed or implied herein, are for informational, entertainment or educational purposes only and should not be construed as personal investment advice. While the information provided is believed to be accurate, it may include errors or inaccuracies.
I will not and cannot be held liable for any actions you take as a result of anything you read here.
Conduct your own due diligence, or consult a licensed financial advisor or broker before making any and all investment decisions. Any investments, trades, speculations, or decisions made on the basis of any information found on this channel, expressed or implied herein, are committed at your own risk, financial or otherwise.

No One Is Talking About the Compounding EffectCompounding is the quiet force behind long-term trading performance, yet it receives far less attention than entries, indicators, or win rates. Most traders focus on how much they can make on the next trade. Very few focus on how consistently they can protect capital so growth can stack over time.
Compounding works only when losses are controlled. A small drawdown requires a modest recovery. A large drawdown demands exponential effort just to return to break-even. This is where many traders unknowingly sabotage themselves. They chase higher returns while ignoring how volatility, overexposure, and mistake clustering interrupt the compounding process.
The math is simple, but the behavior is difficult. Consistent gains, even small ones, build on each other. In contrast, irregular large losses reset progress. A trader who averages steady, controlled returns often outperforms one who alternates between big wins and deep drawdowns. The difference is not talent. It is durability.
Compounding is also sensitive to frequency. More trades do not automatically mean faster growth. Each trade carries execution costs, slippage, and decision risk. When frequency increases without a proportional increase in edge, the compounding curve flattens. Fewer, higher-quality trades allow gains to accumulate without being eroded by friction.
Risk scaling plays a critical role. Increasing size because the account grew is logical only when conditions remain supportive.
Scaling during volatility expansion or structural uncertainty increases the chance of giving back compounded gains. Accounts grow fastest when size increases follow stability, not excitement.
Time is another overlooked variable. Compounding rewards patience. It favors traders who stay in the game long enough for probabilities to express themselves. Missing a trade has little impact. Breaking discipline has a lasting one.
The compounding effect does not reward aggression. It rewards consistency, restraint, and respect for risk. Traders who understand this stop measuring success by single trades and start measuring it by how smoothly their equity curve progresses. Over months and years, that mindset separates short bursts of performance from sustainable growth.

MANA Ready for a Big Breakout! (4H)📈 MANA Price Analysis | Bullish Structure & Smart Money Perspective
The overall power and primary market direction of MANA (Decentraland) remain clearly bullish, indicating strong underlying demand and positive market sentiment. Recently, the price has experienced a sharp and aggressive corrective move, which is considered a healthy pullback within a larger bullish trend rather than a trend reversal.
It is important to note that buyers are actively waiting at two key demand zones marked on the chart. These levels represent high-probability entry areas, where institutional and smart money participants are likely to step in. Their buying pressure can act as a catalyst to push the price of MANA higher and resume the bullish momentum.
From a market structure and Smart Money Concept (SMC) perspective, we can observe multiple consecutive CH (Change of Character) and BOS (Break of Structure) formations. These signals confirm that the market structure remains bullish and that the recent correction is part of liquidity engineering, allowing the market to collect orders before the next impulsive move.
Additionally, the formation of liquidity pools below and above key levels suggests that the market is preparing for a strong upward displacement. As liquidity gets absorbed, the probability of a bullish jump (impulsive move) to the upside significantly increases.
To manage risk efficiently, two specific entry points have been identified where traders can enter the position using a DCA (Dollar Cost Averaging) strategy. This approach allows for better position management and reduces exposure to short-term volatility while aligning with the dominant bullish trend of MANA.
🎯 Profit targets are clearly marked on the chart, based on key resistance levels, liquidity zones, and previous highs. As long as the price respects the identified bullish structure, these targets remain valid.
🔍 Summary:
Asset: MANA (Decentraland)
Market Bias: Bullish
Structure: CH & BOS confirmation
Strategy: DCA entries at key demand zones
Expectation: Bullish continuation & upward impulse
Targets: Marked on the chart
If you would like us to analyze a coin or altcoin for you, first like this post, then comment the name of your altcoin below.

Silvers easy route to $100.Silver is currently positioned with a clear and relatively uncomplicated path toward the $100/oz level, largely due to a visible price vacuum above current levels. From a market structure perspective, there are only a few major zones of resistance overhead, meaning price does not need to fight through dense supply to continue higher. If recent support fails to hold, the most probable scenario is a reversal off the recent swing low and low-volume node (LVN), where prior acceptance was minimal and momentum can reaccelerate quickly. That area acts as a natural launch point, and if buyers step in as expected, silver has a high-probability move straight through the remaining zones toward the $100 target.

Behavioral Biases: Why Most Traders Make the Same MistakesHello, traders! 😎
Crypto markets may look chaotic, but they are driven by a single force: human psychology — the core of trading psychology. Every pump and dump is fueled by cognitive biases, fear and greed, and distorted decision-making under uncertainty, which is exactly why most traders end up repeating the same costly mistakes.
Fear-Driven Herding in a Sideways Market
Since late 2025, Bitcoin has spent months grinding sideways between roughly $80K and $97K, frustrating trend followers and wearing down traders who were betting on a clean breakout to new highs. Retail traders who bought panic dips often ended up selling into relief rallies — a textbook fear-and-greed cycle — while more seasoned players quietly rotated into BTC as a relative safe haven amid rising macro stress.
This wasn’t random price action; it was market psychology on full display . Those caught on the wrong side struggled to stay disciplined, letting emotion override their plans, chasing tops and dumping into support instead of executing a strategy.
Overconfidence and Risk Neglect Bias
Throughout 2025, futures markets were pushed to historic leverage extremes, only to be repeatedly wiped out by relentless volatility. Retail traders running 50× or even 100× got steamrolled when minor pullbacks triggered cascading liquidations. It was a brutal display of cognitive bias — especially overconfidence and optimism — as traders underestimated risk while wildly overestimating their edge, often blowing up their accounts in the process.
Hype-Driven Narrative Bias
The 2025–26 cycle has been littered with fiascos like the sudden collapse of “NYC Token” after its high-profile launch, wiping out speculative holders almost overnight. It wasn’t just a fundamental failure — it was a textbook case of behavioral finance bias: herd chasing and narrative addiction , where traders bought the story and ignored the absence of real underlying value.
Smart Money Anchoring Bias
From mid-2025 into 2026, institutional demand — driven largely by Bitcoin and altcoin ETFs — became one of the dominant forces shaping market structure. Record XRP ETF inflows pulled sidelined capital back into risk assets, pushing momentum traders to chase relief rallies without any real risk framework.
The irony is that professional money doesn’t chase highs the way retail does — but retail trader psychology tends to shadow institutional headlines, magnifying every move. Once ETF flows hit the mainstream narrative, FOMO breeds crowded positioning , turning yet another behavioral bias into a market-moving force.
News-Driven Anchoring Bias
Every macro headline — inflation prints, regulatory noise, or the latest Senate drama — becomes fuel for biased interpretation, amplified by emotions in trading and flawed decision making under uncertainty. Anchoring bias makes traders cling to whatever narrative they heard last: “Bitcoin is a safe haven” one week, “crypto is collapsing” the next.
When markets stop trending cleanly, traders swing between these extremes instead of relying on probability, structure, and risk management .
This macro-crypto feedback loop exposes how psychology drives risk appetite in often contradictory ways. Patterns keep repeating because people repeat the same mental errors — chasing price, overleveraging, anchoring to headlines, and letting emotion overrule strategy. Understanding that behavior is a far more powerful edge than any indicator.
This material is for informational purposes only and does not constitute trading or investment advice.

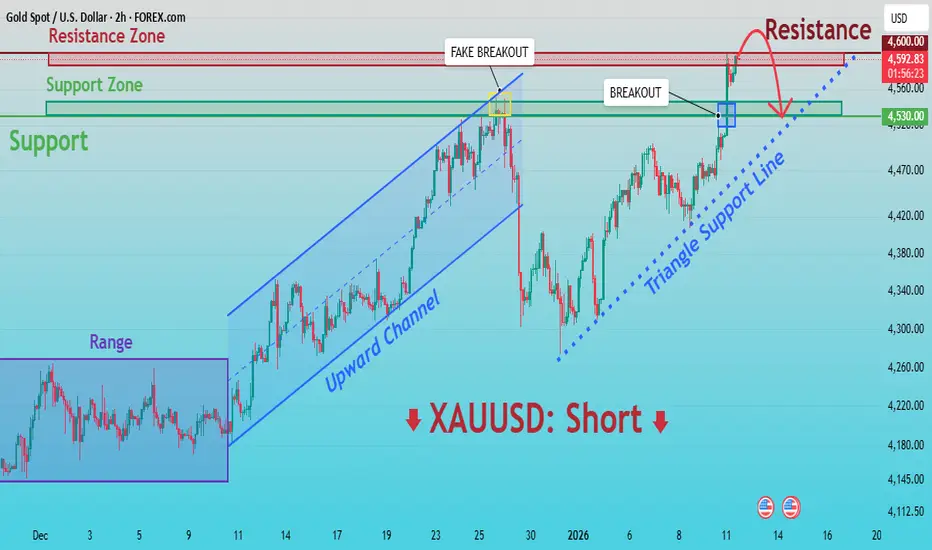
GOLD - A long squeeze of support could trigger growthFX:XAUUSD continues to consolidate, Friday's long squeeze (false breakdown) of support provides an opportunity for growth amid geopolitical issues...
The dollar is strengthening against the backdrop of Thursday's economic data and Trump's geopolitical actions, but against this backdrop, gold is behaving quite cautiously and looks quite strong.
Trump said that tariffs on eight European countries could rise to 25% if Greenland is not sold to the US - more tariffs and an escalation of the trade war could lead to a strong market reaction.
In the new trading week, we are awaiting Trump's speech (high volatility possible), US GDP, Core PCE, and PMI. The data may set the medium-term tone for the market...
Resistance levels: 4593, 4621, 4639
Support levels: 4581, 4561, 4550
The long squeeze has shifted the market imbalance towards buyers. Locally, we are seeing consolidation in the 4581-4593 zone. A close above 4593 or a retest of 4581 could trigger further growth within the current trend
Best regards, R. Linda!

The Math Retail Traders Ignore: Risk-Reward Ratios Are WorthlessA Quantitative Analysis of the Relationship Between Risk-Reward Ratios and Win Rates, and Why the Popular Money Management Narrative Fails Under Mathematical Scrutiny
1. Introduction
Open any trading course, scroll through any trading forum, or watch any YouTube tutorial on money management, and you will encounter some variation of the same claim: with a risk-reward ratio of 3:1, you only need to win 25 percent of your trades to be profitable. The implication is seductive. You can be wrong three out of four times and still make money. Suddenly, profitable trading seems achievable even for those who struggle with market prediction. The risk-reward ratio, often abbreviated as RRR in English literature or CRV in German-speaking markets, has become the cornerstone of retail money management education.
But here is a question that almost never gets asked: if setting a favorable risk-reward ratio were sufficient to generate profits, why would anyone ever lose money trading? Why would hedge funds employ teams of quantitative researchers when a simple rule about stop losses and profit targets would apparently suffice?
This study was designed to answer that question through rigorous mathematical analysis, Monte Carlo simulation, and empirical testing across multiple asset classes. Our findings reveal an uncomfortable truth that contradicts the foundation of retail money management education. The risk-reward ratio, as typically presented, contains a fundamental mathematical flaw that renders its supposed advantage illusory. What retail traders understand as money management bears no resemblance to how professional systematic traders actually approach position sizing and risk control.
Figure 1 displays the theoretical relationship between risk-reward ratio and win rate under random walk conditions. The curve represents the break-even line derived from first-passage time theory. Notice how the win rate decreases in exact proportion to the increase in risk-reward ratio. At RRR 1:1, the theoretical win rate is 50 percent. At RRR 2:1, it drops to 33 percent. At RRR 3:1, it falls to exactly 25 percent. This is not coincidence. It is mathematical necessity.
2. The Mathematical Foundation: First-Passage Time Theory
To understand why the retail risk-reward narrative fails, we must examine the mathematics that govern price movements and barrier hitting probabilities. The relevant framework comes from probability theory, specifically the study of first-passage times for stochastic processes.
Consider a trade entry at price P with a stop loss at distance S below and a take profit at distance T above. The question becomes: what is the probability that price reaches the take profit level before reaching the stop loss level? For a symmetric random walk, where price has equal probability of moving up or down at each step, the answer is given by a remarkably simple formula derived from the gambler's ruin problem:
P(Take Profit first) = S / (S + T)
If we express this in terms of the risk-reward ratio, where RRR = T / S, the formula becomes:
P(Take Profit first) = 1 / (1 + RRR)
This equation has profound implications. It tells us that for any given risk-reward ratio, there exists an exact win rate that produces zero expected profit. At RRR 2:1, that break-even win rate is 33.3 percent. At RRR 3:1, it is 25 percent. At RRR 5:1, it is 16.7 percent.
The retail money management narrative presents these numbers as if they represent some kind of advantage. The trader is told they only need 25 percent accuracy with a 3:1 ratio. What they are not told is that under efficient market conditions, they will achieve exactly 25 percent accuracy, no more and no less. The higher risk-reward ratio does not create an edge. It merely redistributes the probability mass from win rate to reward size. The expected value remains precisely zero.
Figure 2 presents a heatmap showing trade expectancy across different combinations of risk-reward ratio and win rate. The white dashed line represents the break-even condition derived from random walk theory. Areas above this line are profitable. Areas below are unprofitable. Notice how the break-even line traces the exact curve predicted by our formula. Any trading system operating at random walk efficiency will fall precisely on this line, generating zero expected profit regardless of the chosen risk-reward ratio.
3. The Retail Trader Illusion
Before examining what this means in practice, it is worth understanding why the risk-reward myth persists despite its mathematical invalidity.
The standard retail narrative proceeds as follows. Markets are unpredictable, so even skilled traders will have many losing trades. By setting a favorable risk-reward ratio, traders ensure that their winners are larger than their losers. This way, even with more losses than wins, the account grows over time. The advice typically includes specific recommendations: never risk more than one percent of capital per trade, always aim for at least 2:1 or 3:1 reward to risk, and let winners run while cutting losers short.
This narrative contains surface-level logic that appeals to intuition. It feels correct. The problem is that it treats the risk-reward ratio and win rate as independent variables that can be chosen separately. In reality, they are mathematically linked. You cannot simply decide to have a 3:1 ratio and maintain any win rate you choose. The market determines your win rate based on the distance to your profit target and stop loss.
Consider a practical example. A trader enters a long position in the S&P 500 with a 20-point stop loss and a 60-point profit target, establishing a 3:1 ratio. The market does not know or care about the trader's intended ratio. It simply fluctuates according to its statistical properties. If those fluctuations follow approximately random walk behavior, the probability of the 60-point target being reached before the 20-point stop is hit will be approximately 25 percent. The trader achieves exactly the win rate required for break-even, not because of skill or because the ratio was favorable, but because of mathematical necessity.
Figure 3 compares the theoretical win rates predicted by first-passage time theory with the results of 500,000 Monte Carlo simulated trades for each risk-reward configuration. The near-perfect alignment between theory and simulation confirms that the mathematical relationship holds under realistic price dynamics. The slight deviations visible at extreme ratios result from the finite time horizon imposed in simulations, where some trades neither hit their target nor stop within the allowed period.
4. The Illusion of Choice
The fundamental error in retail money management education is treating risk-reward ratio as a strategic choice that confers advantage. In reality, changing your risk-reward ratio does not change your edge. It changes the distribution of your outcomes while preserving the expected value.
To illustrate this concretely, consider two traders with identical entry signals but different risk-reward approaches. Trader A uses tight stops with 1:1 ratios, while Trader B uses the same entries but wider stops with 3:1 ratios. Under random walk conditions, Trader A will win approximately 50 percent of trades, each winning or losing the same amount. Trader B will win approximately 25 percent of trades, with winners three times larger than losers. The expected profit per trade for both traders is identical: zero.
The only difference lies in the psychological experience. Trader A experiences frequent small wins and losses, creating a sense of consistent activity. Trader B experiences infrequent large wins punctuated by strings of small losses, creating an emotional roller coaster that many traders find difficult to sustain. Neither approach is inherently superior because neither creates edge where none exists in the underlying entry signal.
This reveals the critical insight that retail education systematically obscures: the risk-reward ratio is not a source of edge. It is a preference about how to experience the variance of an existing edge, or lack thereof. If your entries have no predictive value, no choice of risk-reward ratio will make them profitable. If your entries have genuine predictive value, the risk-reward ratio determines how that edge manifests in your equity curve, but does not alter the fundamental profitability.
The distribution of trade outcomes for identical entry signals with three different risk-reward configurations follows predictable patterns. With RRR 1:1, the win rate approaches 50 percent. With RRR 2:1, it drops to near 33 percent. With RRR 3:1, it falls to approximately 25 percent. In all cases, the expected value per trade is identical. The only difference is the shape of the distribution.
5. What About Markets With Drift?
A natural objection to the random walk analysis is that real markets, particularly equity indices, exhibit positive drift over time. The S&P 500 has historically returned approximately 8 percent annually. Does this positive drift change the mathematics?
The answer is yes, but far less than most traders assume. When drift is present, the first-passage time formula becomes more complex, incorporating both the drift rate and volatility:
P(Take Profit first) = (1 - exp(-2*kappa*x)) / (1 - exp(-2*kappa*a))
where kappa = (mu - sigma^2/2) / sigma^2
For typical equity parameters with 8 percent annual drift and 16 percent annual volatility, the improvement in win rate is modest. At a 2:1 risk-reward ratio, the theoretical win rate increases from 33.3 percent under random walk to approximately 35 percent with drift. This represents an improvement, but a small one, certainly not the dramatic advantage that would justify treating risk-reward as a primary edge source.
More importantly, the positive drift is already priced into the market through the equity risk premium. Traders who simply hold long positions capture this drift automatically. The question is whether active trading with stop losses and profit targets captures more or less of this drift than simple buy-and-hold. Research consistently shows that in markets with positive drift, the use of stop losses tends to reduce rather than increase total returns. The stops trigger during normal fluctuations, causing traders to exit positions that subsequently recover and continue upward.
Figure 4 compares win rates across three market conditions: pure random walk, S&P 500-like drift of 8 percent annually, and forex markets with near-zero drift. The improvement from drift is visible but modest, ranging from 1 to 3 percentage points depending on the risk-reward ratio. For forex markets, which constitute the primary venue for retail speculation, the random walk approximation holds closely.
6. The Gain-Loss Time Asymmetry
Recent academic research has uncovered an additional phenomenon that further complicates the risk-reward picture. Studies by Siven, Perello, and others have documented that in equity markets, losses of a given percentage magnitude tend to occur faster than gains of the same magnitude. This gain-loss time asymmetry results from the clustering of downward movements during market stress, when correlations increase and selling becomes self-reinforcing.
The practical implication is sobering for traders using fixed risk-reward ratios. When targeting a 3:1 ratio with equal percentage distances to stop and target, the stop loss will typically be reached faster than the take profit when the trade goes wrong, while the take profit takes longer to reach when the trade goes right. This creates a temporal asymmetry that can psychologically devastate traders who experience rapid sequences of losses followed by slow, grinding recoveries.
Our Monte Carlo simulations confirm this asymmetry. For S&P 500-like parameters with a 2 percent stop loss and 6 percent profit target, the average time to hit stop loss on losing trades is approximately 15 trading days, while the average time to hit take profit on winning trades is approximately 45 trading days. Traders must endure three times longer in winning positions than losing positions, a patience requirement that few retail traders can maintain.
Figure 5 illustrates the time asymmetry between winning and losing trades across different risk-reward configurations. The left panel shows average bars to exit for wins versus losses. The right panel displays the ratio of loss time to win time, with values below 1.0 indicating that losses occur faster than wins. The asymmetry becomes more pronounced at higher risk-reward ratios.
7. How Professionals Actually Use Risk-Reward Concepts
If the retail interpretation of risk-reward ratios is mathematically flawed, how do professional systematic traders approach these concepts? The answer reveals a fundamentally different philosophy.
Professional traders do not select risk-reward ratios based on desired profit profiles. Instead, they determine position sizes based on the volatility characteristics of each instrument and the correlation structure of their portfolio. The risk-reward ratio that emerges from any individual trade is a consequence of the entry signal, the volatility-adjusted stop placement, and the exit rules, not a predetermined parameter chosen to achieve some target win rate.
The volatility-adjusted approach, documented extensively by Robert Carver and implemented by firms like AQR and Winton, sizes positions so that each trade contributes approximately equal risk to the portfolio:
Position Size = (Target Risk) / (Instrument Volatility x Price)
This formula ensures that a position in a volatile instrument like crude oil does not dominate the portfolio simply because it moves more. The stop loss distance is typically set as a multiple of recent volatility, often 2 to 3 times the 20-day average true range. The profit target, if used at all, is similarly volatility-adjusted or determined by the exit signal reversing.
Notice what is absent from this approach: any mention of achieving a specific risk-reward ratio. Professionals understand that the ratio emerges from the system's characteristics rather than being imposed upon it. They focus on developing entry signals with genuine predictive value and managing risk through position sizing and diversification, not through arbitrary ratio targets.
The contrast between retail and professional approaches to risk management is stark. The retail approach begins with a desired risk-reward ratio and works backward to set stop and target distances. The professional approach begins with signal generation, applies volatility-adjusted position sizing, and accepts whatever risk-reward ratio emerges from the system's natural characteristics.
8. The Kelly Criterion: When Risk-Reward Actually Matters
There is one context in which the risk-reward ratio becomes genuinely important for position sizing: when combined with a known, statistically verified edge. The Kelly criterion provides the mathematically optimal bet size for a sequence of bets with known win probability and payoff ratio:
Kelly Fraction = (p * b - q) / b
where p is the win probability, q = 1 - p is the loss probability, and b is the ratio of win size to loss size.
If a trader has genuinely verified that their system wins 40 percent of trades with a 2:1 payoff ratio, the Kelly formula recommends betting:
f = (0.40 * 2 - 0.60) / 2 = 0.10, or 10 percent of capital
The critical requirement here is that the win rate must be known and must exceed the break-even rate for the given payoff ratio. A 40 percent win rate with 2:1 payoff exceeds the 33 percent break-even threshold by 7 percentage points, representing genuine edge. The Kelly criterion then optimizes the exploitation of this edge.
However, most retail traders have not rigorously verified their win rates through out-of-sample testing. They operate with assumed or back-fitted parameters that typically degrade significantly in live trading. Applying Kelly sizing to unverified edge estimates is dangerous because the formula is highly sensitive to estimation error. Overestimating edge leads to overbetting, which can result in catastrophic drawdowns.
Professional systematic traders who use Kelly or fractional Kelly approaches invest heavily in statistical verification before deploying capital. They require hundreds or thousands of out-of-sample trades before trusting their edge estimates, and they typically use only a fraction of the Kelly-optimal size to provide margin for estimation error.
The Kelly optimal position size as a function of win rate varies dramatically across risk-reward ratios. The optimal bet size increases rapidly as win rate exceeds the break-even threshold, highlighting the importance of accurate edge estimation. For a 2:1 payoff ratio, the Kelly fraction jumps from zero at 33 percent win rate to 10 percent at 40 percent win rate, demonstrating the formula's sensitivity to edge magnitude.
9. Empirical Evidence From Real Markets
To test whether the theoretical relationships hold in practice, we analyzed historical price data for multiple asset classes, simulating trades at regular intervals with various stop loss and take profit configurations.
For the S&P 500 ETF spanning from 2000 to 2024, we initiated hypothetical trades at each trading day with a 2 percent stop loss and varying take profit levels. At 2 percent take profit, yielding a 1:1 ratio, the empirical win rate was 51.2 percent, slightly above the 50 percent theoretical prediction, consistent with the market's positive drift. At 4 percent take profit with 2:1 ratio, the empirical win rate was 34.8 percent, above the 33 percent theoretical but below what many retail traders assume. At 6 percent take profit with 3:1 ratio, the empirical win rate was 26.3 percent, only marginally above the 25 percent theoretical threshold.
The edge provided by drift, while real, is small. Converting it to annual terms, the improvement represents approximately 2 to 3 percent additional return compared to what would be expected under random walk conditions. This is meaningful over long horizons but negligible in the context of typical retail trading frequencies and transaction costs.
For forex pairs, where central bank intervention and mean-reverting tendencies create different dynamics, the results aligned even more closely with random walk predictions. The EUR/USD pair showed win rates within one percentage point of theoretical values across all risk-reward configurations tested, providing no evidence of exploitable drift.
The close alignment between observed and predicted win rates confirms that real markets behave approximately as first-passage time theory predicts, with only modest deviations attributable to drift or other market microstructure effects. This empirical validation across multiple asset classes and time periods strengthens confidence in the mathematical framework presented throughout this analysis.
10. What Retail Traders Can Actually Learn
Given that the traditional retail interpretation of risk-reward ratios provides no inherent advantage, what practical lessons can individual traders extract from this analysis?
First, stop treating risk-reward ratio as a source of edge. It is not. The ratio you choose affects the shape of your equity curve but not its expected slope. A 3:1 ratio will produce infrequent large wins and frequent small losses. A 1:1 ratio will produce balanced wins and losses. Neither is inherently superior.
Second, recognize that edge must come from entry timing, not exit parameters. If your entries have no predictive value, no stop loss or take profit configuration will make them profitable. Focus your energy on developing and verifying entry signals rather than optimizing exit ratios.
Third, if you believe you have edge, verify it rigorously before betting real capital. This means out-of-sample testing across multiple market conditions, accounting for realistic transaction costs and slippage, and achieving statistical significance with enough trades to rule out luck. The threshold for statistical significance in trading is high because multiple testing bias is severe.
Fourth, use volatility-adjusted position sizing rather than fixed dollar amounts or percentages. This ensures that your risk exposure remains consistent across instruments and market conditions. A 2 percent stop in a low-volatility environment represents different risk than a 2 percent stop during a volatility spike.
Fifth, consider whether active trading with stops and targets is appropriate for your market at all. In markets with positive drift like equities, research suggests that buy-and-hold strategies often outperform active trading after costs. The most reliable way to capture the equity risk premium is simply to remain invested.
A proper decision framework for evaluating risk-reward configurations must begin with verified edge characteristics. The framework emphasizes that ratio selection should follow from system properties rather than being imposed based on desired win rate characteristics. Only after establishing genuine predictive ability through rigorous testing should traders consider how to structure their exits.
11. The Professional Alternative
For traders determined to pursue systematic approaches, professional trend followers offer a template that differs fundamentally from retail risk-reward mythology.
The professional framework begins with signal generation through methods like time series regression, where the slope of price over a lookback window is tested for statistical significance. Only when the trend signal exceeds a confidence threshold is a position initiated. This contrasts with retail approaches that generate signals constantly based on simple indicator crossovers.
Position sizing follows volatility normalization, ensuring each position contributes equal expected risk to the portfolio. The formula incorporates recent volatility, correlation with existing positions, and total portfolio risk constraints. This systematic approach prevents any single position from dominating outcomes.
Exit signals typically mirror entry signals. Rather than using fixed take profit levels, positions are held until the trend signal reverses or weakens below threshold. This allows winning trades to continue as long as the underlying momentum persists, rather than being truncated by arbitrary targets.
Risk management occurs at the portfolio level through diversification across uncorrelated markets and strategy types. The goal is to generate returns that are uncorrelated with traditional asset classes, providing crisis alpha during market dislocations when traditional investments suffer.
This framework does not eliminate losses or guarantee profits. Professional trend followers experience extended drawdowns and multiple years of underperformance. What the framework provides is a statistically grounded approach to capturing genuine market inefficiencies rather than an illusory edge from ratio selection.
Figure 6 presents a summary dashboard illustrating the key findings of this analysis. The four panels show the theoretical RRR-win rate relationship validated by Monte Carlo simulation, the modest improvement from market drift, the time asymmetry between wins and losses, and the expectancy calculations that confirm zero expected profit under random walk conditions. Together, these visualizations demonstrate why the retail risk-reward narrative fails under mathematical scrutiny.
12. Conclusion
This Essay has demonstrated through mathematical analysis, Monte Carlo simulation, and empirical testing that the retail understanding of risk-reward ratios contains a fundamental flaw. The ratio does not create edge. It redistributes probability mass between win rate and payoff size while preserving expected value. Under efficient market conditions, choosing a 3:1 ratio means achieving approximately 25 percent win rate, exactly the proportion required for break-even.
The gap between retail mythology and professional reality is vast. Retail traders are taught to select ratios that feel comfortable, implying that profitability follows from proper money management. Professionals understand that edge must be generated through signal quality and captured through position sizing and portfolio construction. The risk-reward ratio that emerges is accepted as a system characteristic rather than manipulated as a profit lever.
This does not mean that risk management is unimportant. Quite the opposite. Proper position sizing, volatility adjustment, and diversification are essential components of sustainable trading. But these techniques work by managing the variance of an existing edge, not by creating edge where none exists.
The trader who internalizes this distinction will avoid one of the most common and costly errors in retail speculation: believing that money management rules substitute for genuine predictive ability. No stop loss placement or profit target selection will transform random entries into a profitable system. Edge must be earned through rigorous research and verified through disciplined testing. Everything else is variance management.
The mathematics is unforgiving but also clarifying. Once you accept that risk-reward ratios are not edges, you can focus your limited resources on what actually matters: developing and verifying entry signals that predict future price movement better than chance. That is a difficult task, one that requires statistical sophistication, market knowledge, and honest self-assessment. But it is the only path to sustainable trading profitability.
No evidence, no trade. That principle separates those who understand the mathematics from those who believe in magic ratios.
References
Baz, J., Granger, N., Harvey, C.R., Le Roux, N. and Rattray, S. (2015) Dissecting Investment Strategies in the Cross Section and Time Series. Working Paper, Man AHL.
Carver, R. (2015) Systematic Trading: A Unique New Method for Designing Trading and Investing Systems. Petersfield: Harriman House.
Hurst, B., Ooi, Y.H. and Pedersen, L.H. (2017) A Century of Evidence on Trend-Following Investing. Journal of Portfolio Management, 44(1), pp. 15-29.
Kelly, J.L. (1956) A New Interpretation of Information Rate. Bell System Technical Journal, 35(4), pp. 917-926.
Moskowitz, T.J., Ooi, Y.H. and Pedersen, L.H. (2012) Time Series Momentum. Journal of Financial Economics, 104(2), pp. 228-250.
Perello, J., Gutierrez-Roig, M. and Masoliver, J. (2011) Scaling Properties and Universality of First-Passage Time Probabilities in Financial Markets. Physical Review E, 84(6), 066110.
Siven, J., Lins, J. and Szymkowiak-Have, A. (2009) A Multiscale View on Inverse Statistics and Gain/Loss Asymmetry in Financial Time Series. Journal of Statistical Mechanics: Theory and Experiment, P02004.

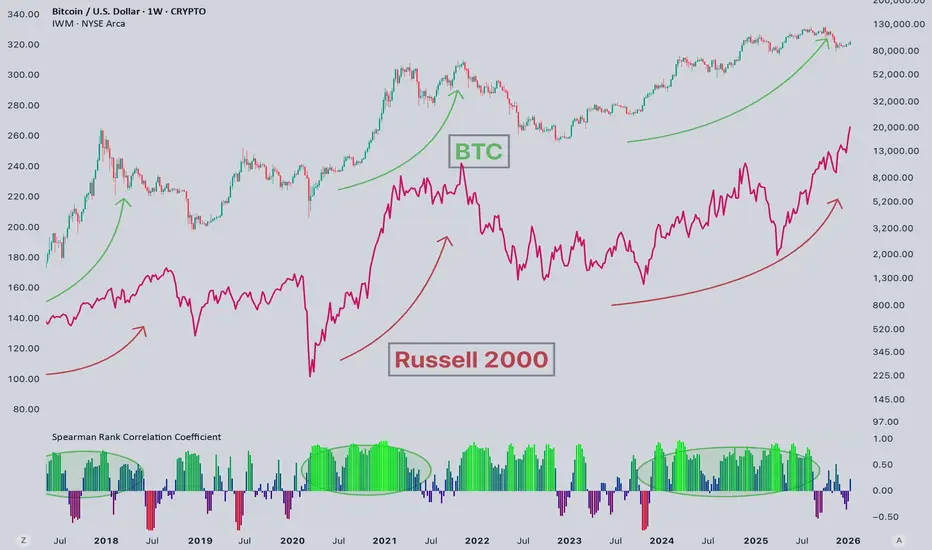
Why is Russell rising? And BTC not?#Russell2000 vs #Bitcoin, A Growing Divergence 📊
Over the last three months, the Russell 2000 has continued to grind higher, while Bitcoin has been moving lower. This divergence naturally raises the question: what’s driving such clear decoupling?
📝 Previously, I shared data showing Bitcoin diverging from the Nasdaq – a correlation that was historically very strong. One popular explanation was that the rally was isolated to AI and Big Tech, while the rest of the market lagged. However, the Russell 2000 challenges that narrative. It represents 2,000 small-cap companies, and they are clearly moving higher.
So why is Russell rising?
📍 The main driver is liquidity and expectations of a more accommodative credit environment. Small caps are highly sensitive to financial conditions, and markets are increasingly pricing in easier policy ahead.
Then why isn’t CRYPTOCAP:BTC rising, given that it’s also heavily liquidity- and credit-dependent?
📝 In my view, Bitcoin is currently at the center of a larger debate: what matters more right now – the 4-year halving cycle or global liquidity conditions? The answer largely defines whether your bias for 2026 is bullish or bearish.
📍I believe halving cycles remain a critical structural foundation for Bitcoin. They matter. But liquidity matters almost just as much. Because of that balance, I still view the current environment as a bear market for Bitcoin – but with important context.
💡 Just like the previous bull cycle was constrained by tight liquidity, this bear market will be different as well. Expect local bounces, short-term rallies, and even selective strength in some altcoins. In many ways, this will be the mirror opposite of the underfunded bull market we saw before.
This time, Bitcoin’s bear market is overfunded.
“Cut Your Losses, Let Your Profits Run.” Fine, But How Exactly?We’ve all heard it. It’s right up there with “buy low, sell high” in the Hall of Fame of obvious trading advice. Everyone agrees with it. Few people do it.
Why? Because cutting losses hurts. Letting profits run is scary (especially in the current macro ). And both go directly against how human brains are wired.
Still, that simple phrase sits at the core of nearly every profitable trading career ever built. So let’s talk about how traders actually do that in the real world.
🧠 Why Your Brain Hates This Rule
Your brain evolved to avoid the bad stuff and lock in the good stuff. Trading puts that wiring to the test.
When a trade is losing, your instinct is to wait — maybe it’ll bounce. So you avoid facing the bad consequences of your decision. It ain’t a loss unless you sell, right?
When a trade is winning, your instinct is to grab the money before it disappears. That’s called loss aversion, and it’s why so many traders end up with small wins and large losses. Revenge trading usually follows.
The goal here is simple: Make the average win bigger than the average loss. Or, even better, have one big winner that can take care of several small-size losses.
📉 Cutting Losses: Think in Probabilities
Cutting losses doesn’t mean being right less — it means being wrong cheaply. “It's not whether you're right or wrong, but how much money you make when you're right and how much you lose when you're wrong.”
Professional traders assume they will be wrong a lot. They build that expectation into their process and risk profile. When a trade moves against them beyond what they originally planned for, they step aside without drama.
“If you have a losing position that is making you uncomfortable, the solution is very simple: Get out, because you can always get back in.”
A small loss is just a data point. A big loss changes behavior.
The traders who make it treat exits like boring administrative work. Just a clean “this didn’t work, let’s see what’s next.”
📈 Letting Profits Run: The Harder Half
Cutting losses is uncomfortable — but letting profits run is even harder.
When a trade goes your way, your mind immediately starts calculating what you could buy with the gains or how much you’re up just for the day. The idea of losing those profits feels worse than the pain of an initial loss. So traders exit too early, again and again.
The result? They get paid for being right, but not enough to cover when they’re wrong.
Letting profits run means allowing the market to do the work. It means resisting the urge to micromanage every tick. It means giving strong trends time to show themselves.
🧮 The Math That Makes This Work
This rule isn’t philosophical — it’s mathematical (it’s fairly simple, though).
Imagine a trader wins half their trades. If their losses average 1 unit and their wins average 2 units, they’re profitable over time.
But flip it — small wins, large losses — and even being right 60% of the time won’t save you.
Cutting losses protects the downside. Letting profits run expands the upside. Together, they tilt probability in your favor, especially if you’re chasing asymmetrical bets .
That’s the whole game. One good trend pays for ten small losses and the equity curve starts to make some sense.
🧭 The Trader’s Secret Weapon: Risk Profile
The traders who follow this rule best don’t rely on willpower. They rely on a solid risk profile.
They decide in advance:
• How much they’re willing to lose
• Under what conditions they exit
• What signals a trade is still working
By making these decisions before emotions get involved, they remove most of the internal debate when it matters most, especially during high-impact economic data releases .
Trading becomes less about being brave and more about being prepared. In short, the whole thing about cutting your losses and letting your profits run is about embracing small losses without ego and allowing big wins without fear.
Off to you : How do you deal with your losses and wins? Share your approach in the comments!

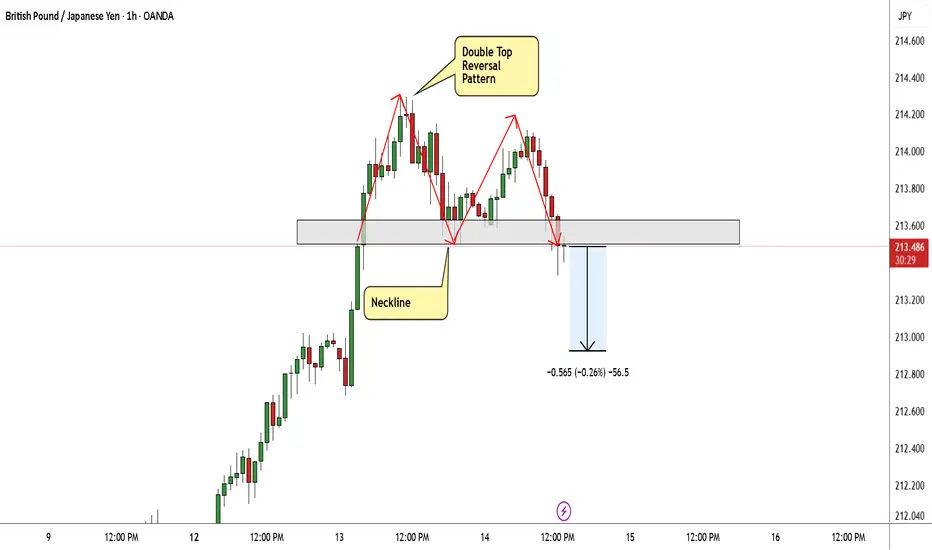
GBP/JPY Made A Reversal Pattern , Short Setup To Get 100 Pips !Here is my 1H Chart On GBP/JPY , And finally the chart made a reversal pattern The price creating a very clear reversal pattern ( double top) and the price made a very good bearish price action now from good res area But until now we have not a clear closure below our neckline to confirm the pattern , so we should wait for clear closure with 1H Candle at least below the neckline to can get a confirmation and enter a sell trade and in this case we can targeting from 50 to 100 pips cuz the high for the pattern not more than 100 pips , and if we have not a closure below the neckline this idea will not be valid anymore .
Reasons For Enter :
- Reversal Pattern
- Good Bearish Price Action .
- Over Bought .
Bullish continuation?GBP/JPY could make a short-term pullback to the support level, which is a pullback support, and could bounce from this level to our take profit.
Entry: 211.43
Why we like it:
There is a pullback support level.
Stop loss: 210.35
Why we like it:
There is a pullback support level.
Take profit: 214.60
Why we like it:
There is a resistance level at the 61.8% Fibonacci projection.
Enjoying your TradingView experience? Review us!
Please be advised that the information presented on TradingView is provided to Vantage (‘Vantage Global Limited’, ‘we’) by a third-party provider (‘Everest Fortune Group’). Please be reminded that you are solely responsible for the trading decisions on your account. There is a very high degree of risk involved in trading. Any information and/or content is intended entirely for research, educational and informational purposes only and does not constitute investment or consultation advice or investment strategy. The information is not tailored to the investment needs of any specific person and therefore does not involve a consideration of any of the investment objectives, financial situation or needs of any viewer that may receive it. Kindly also note that past performance is not a reliable indicator of future results. Actual results may differ materially from those anticipated in forward-looking or past performance statements. We assume no liability as to the accuracy or completeness of any of the information and/or content provided herein and the Company cannot be held responsible for any omission, mistake nor for any loss or damage including without limitation to any loss of profit which may arise from reliance on any information supplied by Everest Fortune Group.

Silver Prices Stabilise Near Record HighsSilver Prices Stabilise Near Record Highs
As the XAG/USD chart shows, the price of silver per ounce is consolidating near its all-time high, which lies above $85.
Bullish sentiment dominates the market, as concerns over the independence of the US Federal Reserve, heightened geopolitical tensions, and other factors have fuelled demand for safe-haven metals. According to media reports:
→ Official authorities are exerting pressure on the Fed to cut interest rates, having opened a criminal case against its Chair. Powell, in turn, described these actions as a “pretext” for influencing the decisions of an independent financial institution.
→ Traders are also closely monitoring the escalation of protests in Iran, which could lead to US military involvement, alongside President Trump’s statements about the annexation of Greenland. In the aftermath of the operation in Venezuela, such scenarios are increasingly being viewed as realistic.
Technical Analysis of the XAG/USD Chart
On 29 December, we updated the previously drawn ascending channel and suggested a potential decline in silver prices towards its lower boundary, with a possible bearish breakout attempt.
Indeed, prices moved down to the lower boundary. However, after the formation of an Inverted Head and Shoulders (IHS) pattern, bulls found support there and resumed the upward trend.
The current consolidation in XAG/USD confirms the role of the channel median, which appears to act as a reference level acceptable to both buyers and sellers. That said, today’s CPI release could disrupt this balance. Possible scenarios include:
→ a pullback towards the psychological support around $80, where the bullish impulse marked by the arrow began;
→ a rise towards the QH line, which divides the upper half of the channel into two quarters.
This article represents the opinion of the Companies operating under the FXOpen brand only. It is not to be construed as an offer, solicitation, or recommendation with respect to products and services provided by the Companies operating under the FXOpen brand, nor is it to be considered financial advice.

Litecoin: The Next PumpAfter years of posting my Monero KRAKEN:XMRUSD thesis based on its privacy use case it has finally catapulted into new All Time Highs and entered "price discovery."
So I now look to what is next... focusing on
PATTERN RECOGNITION
FUNDAMENTALS: PRIVACY
THE TRADE
Pattern Recognition
A recent post by Peter Brandt got me to check old, long dormant cryptocurrencies and I checked Litecoin $KRAKEN:LTCUSD.
At first glance of the long term historic chart I can't help but notice the eerie similarity between Litecoin and two other recent random pumps:
Silver and Monero
These are assets with history of sporadic, massive volatility pumps that come after long periods of low volatility price action. Imagine spotting the next big pump before the crowd. That is what I imagine when I see a chart that looks like Litecoin right now.
Fundamentals: Privacy Coins
I attribute my success in going all-in on Monero to identifying the market change to valuing privacy coins early (3 years ago). It became clear to me that this use case was NOT being services by Bitcoin.
There is value in privacy.
Monero is "privacy by default". I'm not even going to waste time with the centralized "Z". But then there is Litecoin.
Litecoin's Mimblewimble Extension Blocks (MWEB) provide optional on-chain privacy by hiding transaction amounts and breaking linkability between senders and receivers through confidential transactions, stealth addresses, and native mixing features. This opt-in upgrade keeps the main chain transparent while enabling private, fungible transfers in a parallel secure layer—perfect for cash-like digital payments without sacrificing Litecoin's speed or low fees.
Litecoin is the smart, optional privacy play that keeps things fast and cheap—value in privacy, without the hassle. And most importantly Litecoin is ubiquitously listed on every exchange. It arguably has more potential speculative inflows than Monero which is widely DE-listed.
The Trade:
As a trader what interests me the most is DEFINED RISK. And Litecoin stands out extremely well in this regard because of October 10th:
The October 10th, 2025 liquidation event - brought on by a random US market closed Friday evening Tweet by Trump - sent a shockwave across the cryptocurrency market. It liquidated billions in leveraged longs and put some market makers out of business.
But it did something of incredible importance to us NOW: It defines where price should not go.
Liquidations remove the excess leverage and stupidity of the market. Those traders are out, with less money, and frustrated. They are no longer there to fade rallies and may even FOMO back in when price finally goes the way they wanted. It's market psychology.
Defined risk means you sleep easy—knowing exactly where to cut losses, while the upside plays out. If one sets a stop below major liquidation spikes it is a very effective true level to GET OUT of a trade. Because once the leverage is removed AND price still continues on its downward path you can be confident that the bear trend is actually REAL.
"You know where your stop needs to be"
Here are a few examples I can recall off the top of my head:
The same October 10th, 2025 Spike on Bitcoin:
The December 2021 Spike that ended the last Bull cycle. A historic example with the same result.
We never can know for sure what will pump or dump but the patterns of price action around liquidation spikes let us know "Where our stop needs to be."
So from a place of knowing where to get out of a trade we can size our risk. Then all we have to do is wait for upside.
Trade wisely.

When Will Tesla’s Pilot Take Off?Hello Traders 👋
Hope you all are doing well and trading with discipline. Let’s analyze Tesla from a pure technical perspective and see where the next major move could unfold.
Tesla is trading inside a well-defined rising channel, respecting both the rising support and the rising resistance, which clearly confirms a strong bullish market structure.
After getting rejected from the 458–460 resistance zone, price did not break down. Instead, it formed a higher low on the rising support line, showing that buyers are still in control and dips are being accumulated.
Now price is again approaching the same resistance, which makes this level extremely important. Repeated attacks on resistance usually weaken sellers and increase the probability of a breakout.
A 4-hour close above 458 will confirm a range breakout, after which Tesla can quickly move toward the upper channel resistance around 510–520. This zone also aligns with a potential new all-time high breakout, making this setup very attractive from a risk-reward perspective.
As long as price stays above the rising support zone (~430–435), the overall structure remains bullish and this pullback should be seen as a trend-continuation move, not a reversal.
This is a classic example of smart money accumulation inside an uptrend before the next expansion.
Trade Plan-:
Entry: 4H close above 458
Stop-loss: Below 435 (rising support)
Targets: 500 -515- New ATH zone.
Regards- Amit.

Post-Rally Consolidation, Awaiting CatalystHello everyone,
Bitcoin is no longer in an expansion phase of the uptrend, but has shifted into a consolidation phase following the recent rally.
From a structural perspective, the medium-term uptrend remains intact. Bitcoin continues to print higher highs and higher lows, with price holding above both the EMA 34 and EMA 89, while these two moving averages are still sloping upward. The key point here is that sellers have not been able to trigger any meaningful breakdown, especially failing to force a clear close below the EMA 89 — the critical dynamic support of the current trend.
After setting a high around the 94,000 area, BTC pulled back and began moving sideways within a relatively tight range around 91,000–92,000. Many interpret this phase as a sign of weakness, but in my view, this behavior looks more like post-trend accumulation rather than distribution. The trading range is narrowing, volume is gradually declining, and each dip toward the EMA 89 is quickly met with buying interest, indicating that defensive capital is still present. A truly weak market would show a decisive break below the EMA 89, followed by aggressive selling on rebounds — and so far, that scenario has not materialized.

Bitcoin - Holding The Middle, Eyes On The EdgeBitcoin continues to trade within a clearly defined range, with price currently positioned in the upper half of that structure. After a strong move away from the lower boundary, the market has shown acceptance above the midpoint, suggesting buyers are still active but now approaching an area where reactions are more likely.
Range Structure And Key Zones
The broader structure remains range-bound, with a well-respected low acting as the base and a clear resistance zone marking the top. The upper boundary of this range stands out as the most obvious pool of liquidity, making it a logical magnet for price before any meaningful directional decision is made.
Internal Support Reaction
Within the range, price recently reacted cleanly from a strong internal support area. This zone has previously acted as a pivot, showing multiple reactions and confirming its relevance. The current bounce from this level adds confidence that the move higher is not random, but instead supported by real participation from buyers.
Liquidity Considerations
Given the clarity of the range high, resting liquidity above that area is highly likely. From a liquidity perspective, it would make sense for price to continue pushing higher, take out those highs, and invite breakout traders into long positions. This type of behavior often precedes a reversal rather than sustained continuation.
Projected Price Path
If price continues to build on the internal support reaction, a move toward the range high becomes the most logical next step. A sweep of that high followed by rejection would align with classic range manipulation, where liquidity is taken before price rotates back into the range.
Conclusion
As long as the internal support holds, further upside remains plausible. However, the real area of interest sits at the range high, where a liquidity sweep and reversal scenario becomes increasingly attractive. Patience is key here, allowing price to show its hand at the most obvious level before committing to directional bias.
___________________________________
Thanks for your support!
If you found this idea helpful or learned something new, drop a like 👍 and leave a comment, I’d love to hear your thoughts! 🚀

XAUUSD: Critical Supply Zone - Reaction May Define Next MoveHello everyone, here is my breakdown of the current XAUUSD setup.
Market Analysis
Gold is trading within a broader bullish environment, but recent price action shows signs of exhaustion near key resistance. After a period of consolidation inside a clear range, XAUUSD broke to the upside and formed a well-defined upward channel, confirming buyer control. This move brought price into the upper Resistance Zone around 4,590–4,600, where strong selling pressure emerged.
Currently, at this level, price printed a fake breakout, indicating a lack of acceptance above resistance and trapping late buyers. Following this rejection, gold pulled back sharply and then staged a recovery, breaking above the local structure again and retesting the Support Zone near 4,530. This area aligns with previous resistance turned support and a rising triangle support line, which is currently being tested. Despite the bullish recovery, price is once again approaching the major resistance area, where sellers have previously shown strong interest. The market structure suggests that the current move is corrective within a larger resistance context rather than the start of a fresh impulsive rally.
My Scenario & Strategy
My primary scenario favors a short setup while price remains below or reacts strongly from the 4,590–4,600 Resistance Zone. A rejection from this area could trigger a move back toward the 4,530 Support Zone and potentially lower if selling momentum increases.
However, a clean breakout and acceptance above 4,600 would invalidate the short bias and signal bullish continuation. Until that happens, the resistance area remains a key decision point, and caution is warranted near the highs.
That’s the setup I’m watching. Thank you for your attention, and always manage your risk.