XRPUSDT - A break in the uptrend. Are we heading toward 1.380?BINANCE:XRPUSDT has broken through the uptrend support and is consolidating below 1.450, indicating that the market is poised to head toward support. Crypto winter continues...
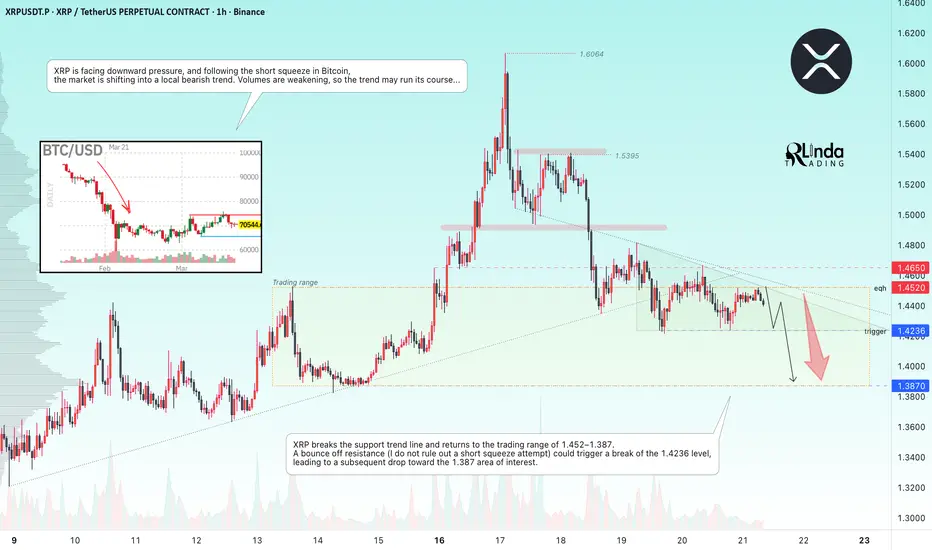
XRP is facing downward pressure, and following a short squeeze in Bitcoin, the market is shifting into a local bearish trend.
Volumes are weakening, so the trend may run its course...
XRP breaks the support trend line and returns to the trading range of 1.452–1.387. A bounce off resistance (I do not rule out a short squeeze attempt) could trigger a break of the 1.4236 level, leading to a subsequent drop toward the 1.387 zone of interest
Resistance levels: 1.452, 1.465
Support levels: 1.4236, 1.387
A bounce off the 1.452 resistance zone confirms a trend break and relatively bearish sentiment. The price may test 1.4236 before breaking through and falling further to the 1.387 area of interest.
Best regards, R. Linda!
Community ideas
ENS is following a bearish structure (2H)We have a bearish CH after the formation of a swing high (SWH), followed by a well-respected bearish structure with multiple bearish BOS.
A large liquidity pool has formed below the current price for some time, and it is expected to be taken soon, leading to further downside.
We are looking for sell/short positions in the supply zone using a DCA approach.
Targets are marked on the chart.
A daily candle close above the invalidation level will invalidate this analysis.
If you would like us to analyze a coin or altcoin for you, first like this post, then comment the name of your altcoin below.
What is your opinion about ENS?

SPY:A mostly fundamental discussionHey everyone,
Here are my thoughts on SPY.
Mostly focusing on the significance of the fundamentals currently.
The article I show with the EMA stats is here:
And I forgot to share the weekly forecast which is here:
Thanks for watching and safe trades everyone!

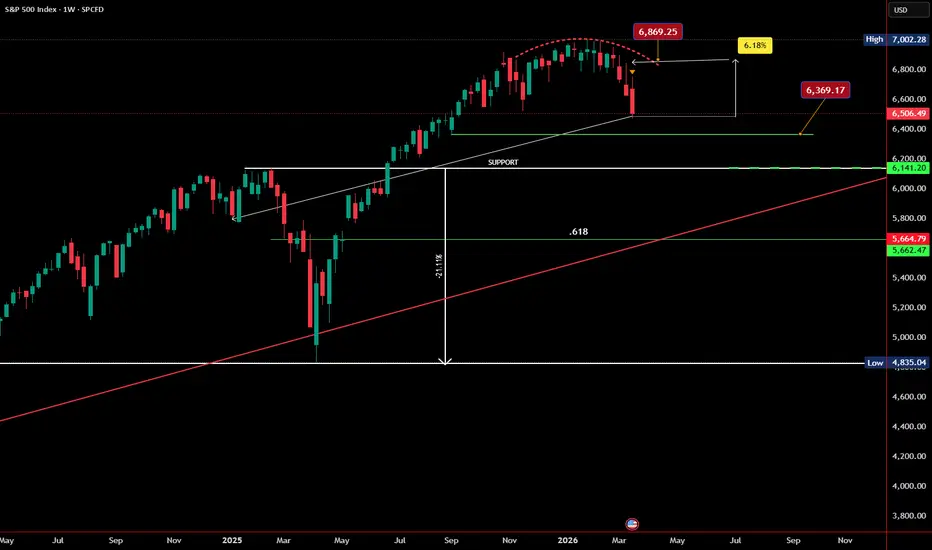
S&P 500 Weekly Outlook - Level Decides Everything March 23, 2026Looking at the weekly chart of the S&P 500, the market has now clearly rejected from the highs near the 6,800–7,000 region, and momentum is starting to roll over.
What stands out is how closely this structure resembles the move from January 6, 2025 when price pulled back into support before continuing higher. But this time, the market is at a much more extended level, and the reaction here will matter far more.
Right now, everything comes down to one level:
We need to close this week above 6,869.25 for the reversal to be bullish.
That level is no longer just resistance it’s the line that separates continuation from a deeper correction. If price can reclaim it with strength, this breakdown gets invalidated, shorts get trapped, and the market likely pushes toward new highs.
But if price continues to trade below it, the rejection we’re seeing now starts to look like the beginning of something bigger. In that case, a move into the 6,300–6,400 region becomes likely, with the major level at 6,141 acting as the last line of defense before a deeper pullback toward the 5,600–5,800 zone.
We’ve seen this setup before a pullback that led to continuation.
But this time, the market has to prove it.
Fail here, and this isn’t just a dip it’s the start of a larger unwind.
DOTUSDT is poised to reach 1,400 during the dump phasePressure is building on the 1.493 support level. A descending triangle is forming during the “dump” phase. A close below this key level could trigger a sell-off toward 1.400.
Volume is building on the bears' side, buyer strength is waning, and the bulls may not be able to hold the 1.493 support level on their own. The 1.493–1.407 range is quite loose, and the decline could be rapid.
Scenario: A break below the 1.493 support level could be accompanied by a sell-off toward the target of 1.407

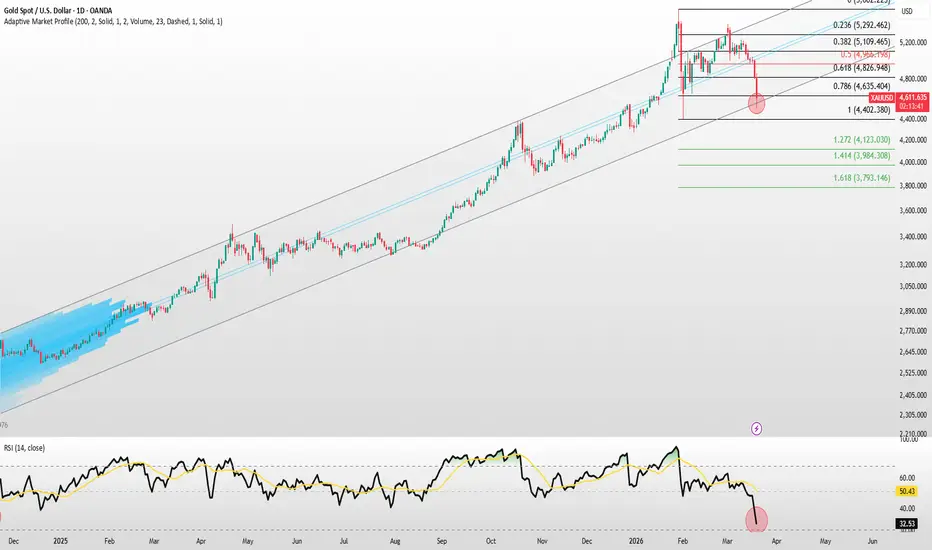
Gold Is Testing the Bottom of a 16-Month Rising Trend!Gold is currently testing the lower boundary of the rising trend channel that has been in place since November 2024.
Trading approximately 18% below its all-time high, momentum in gold is now at its lowest level since October 2023. When we check momentum through the RSI, it sits at 32.39 on the daily timeframe — the weakest reading in the last 2.5 years.
Technical Levels
Short-term pivot: 4,966. Why does this level matter? The SMA50, which I use for short-term trend tracking, sits right at this level — and the Fibonacci 0.5 retracement lands in the same zone. FRVP VAL is also in close proximity. In short, multiple metrics are pointing to the same price.
On the downside, I'm closely watching 4,500 — a level that carries both technical significance as the rising trend floor and psychological weight. As long as we don't see two consecutive daily or weekly closes below this level, there is no major structural threat. In a black swan scenario, however, the long-term Fibonacci support at 4,123 would become the area of maximum pain for gold investors.
Conclusion
In the current geopolitical environment, gold remains the locomotive of the markets — yes, all of them.
If gold holds the 4,500–4,600 band and begins to recover strength, a test of 4,966 becomes possible. A daily close above that level would bring the rising trend back into the conversation. On the other hand, consecutive closes below 4,500 could open the door down to the 4,100 region.
Thank you for reading — feel free to like and share if you found this useful.
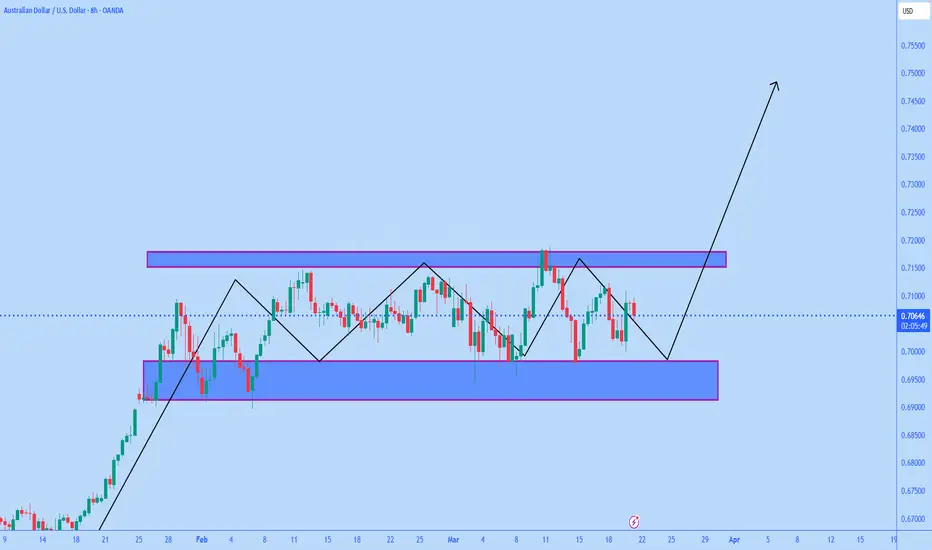
AUDUSD is looking for BreakoutAUDUSD is clearly ranging between strong demand near 0.6950 and supply around 0.7180, with price compressing and forming a liquidity buildup before a potential breakout, and current structure suggests accumulation with higher probability of upside expansion toward 0.7400+ if resistance breaks cleanly.
Fundamentally, AUD remains supported by RBA’s hawkish tone and elevated inflation, while the Fed is holding rates steady with concerns over persistent inflation and rising energy prices, keeping USD mixed and allowing AUD strength to build gradually.
At the same time, global risk sentiment is unstable due to geopolitical tensions and Middle East developments, which is creating short-term volatility but not invalidating the bullish bias unless price loses the 0.7000 support zone decisively.
Overall, I am watching for a clean breakout above the range high to confirm bullish continuation, as liquidity sweep and consolidation indicate a strong expansion move is approaching with smart money positioning for upside.
XAU/USD Pullback Into Sell Zone – Bearish Continuation LikelyTechnical Analysis Of XAUUSD
Gold (XAU/USD) is currently trading within a clear downtrend, confirmed by a sequence of lower highs and lower lows and a well-respected descending trendline.
Price recently broke down from a prior range area, showing a shift from consolidation to bearish momentum. The breakdown was followed by a strong impulsive move lower, indicating increased selling pressure.
A corrective pullback has now brought price into a resistance zone aligned with the descending trendline. This confluence area is critical: it combines prior support-turned-resistance with dynamic trendline resistance, making it a high-probability rejection zone.
If sellers defend this level, the market is likely to resume its bearish leg toward the support/target area near 4,537, which represents the next key liquidity zone.
However, a sustained break and close above the resistance zone would weaken the bearish structure and could signal a deeper correction.
Bias: Bearish below resistance
Key Levels:
Resistance: 4,730
Support/Target: 4,537
Conclusion: The trend remains bearish, and rallies into resistance are likely to be sold unless a structural breakout occurs.

Trading History Series — episode 1: Conflict & CapitalMarkets don’t just react to numbers, they react to uncertainty.
And nothing injects uncertainty into the global system faster than war.
This is not about politics. This is about behavior.. price behavior.
If you strip away headlines, opinions, and narratives, wars leave behind one thing traders can study objectively: footprints on charts.
The Pattern Most Traders Miss
Across decades, different regions, and different causes, wars tend to follow a surprisingly consistent market sequence:
1. Pre-Conflict Positioning
Smart money moves before headlines confirm reality.
Commodities begin rising. Safe havens quietly bid.
2. Initial Shock (Volatility Spike)
The moment conflict becomes official, volatility expands aggressively.
Liquidity thins. Spreads widen. Emotional trading dominates.
3. Trend Formation
After the shock, markets don’t stay chaotic forever.
They trend often strongly based on the economic consequences of the war.
4. Normalization / Repricing
Markets adapt. The “war premium” either fades or becomes structurally priced in.
This cycle has repeated more times than most traders realize.
Case Study 1: Gulf War (1990–1991)
When Iraq invaded Kuwait in 1990, markets didn’t wait for confirmation.
Gold surged sharply as fear spread through global markets.
Oil spiked aggressively due to supply concerns.
Equities initially sold off.
Gold rallied aggressively into the Kuwait invasion, pricing fear early. Once military action began, uncertainty dropped and price reversed despite ongoing conflict.
TVC:GOLD
Oil didn’t wait for supply disruption confirmation, it priced the threat immediately. The peak formed during maximum uncertainty, not maximum damage
CFI:WTI
But here’s the insight:
Once military action began and uncertainty started decreasing,
markets reversed faster than the news sentiment did.
Case Study 2: Iraq War (2003)
Leading into the invasion, equities were weak. Fear was already priced in.
But when the war officially began:
Stocks rallied.
Why?
Because the unknown became known.
This is one of the clearest examples of:
“Sell uncertainty, buy clarity.”
SP:SPX
Downtrend into early 2003
Strong rally immediately after invasion begins
The market sold uncertainty for months. When war officially began, clarity replaced fear and price rallied.
Case Study 3: Russia–Ukraine Conflict (2022–Present)
TVC:GOLD
Pre-invasion accumulation then sharp breakout on invasion then structured consolidation after following a strong rally
This is one of the most recent and clean examples of multi-asset reaction.
Gold rallied sharply as safe-haven demand surged
Oil exploded higher due to supply chain disruptions
EUR weakened due to geographic and economic exposure
But again, after the initial spike:
Markets transitioned from chaos into structured trends.
Oil didn’t just spike, it trended.
Currencies didn’t just react they repriced long-term expectations.
Present Day Insight
In the 2026 Israel–Iran conflict, oil didn’t rise because of war alone, it rose because supply risk became real. Strikes on key energy infrastructure and disruptions around the Strait of Hormuz... a route responsible for nearly 20% of global oil flows triggered immediate fear of shortages. Markets quickly priced this risk, pushing crude above $110 as traders anticipated reduced supply and higher transport costs.
EASYMARKETS:OILUSD
Every active conflict today is being processed through the same lens:
Energy dependency
Supply chain exposure
Central bank reaction
Risk sentiment
The instruments may differ, but the behavior does not.
You’ll still see:
Gold acting as fear’s first responder
Oil reacting to supply threats
Indices reflecting economic confidence
Currencies adjusting to capital flow shifts
What This Means for Traders
This is where most traders get it wrong:
They trade the headline.
Professionals trade the reaction to the headline.
Wars create volatility — but volatility is not random.
It leaves structure.
If you study enough charts, you start to notice:
The spike is emotional
The trend is logical
The retracement is inevitable
How to Read War Through Charts (Practical Framework)
When conflict headlines hit, ask:
1. What is being threatened?
(Oil supply? Currency stability? Economic growth?)
2. What asset reflects that threat?
(Gold, oil, indices, specific currencies)
3. Has the move already started?
(If yes — you’re late to the reaction, early to the structure)
4. Where is liquidity likely resting?
(Previous highs/lows, psychological levels, imbalance zones)
Final Thought
Wars feel unpredictable.
But market behavior around war is not.
If you remove emotion and focus on structure,
you’ll realize something powerful:
The chart often knows before the headline.
And it always reacts before the crowd understands.
put together by : Pako Phutietsile as @currencynerd

Gold in Times of Global Turmoil I How the Crisis Shaped GoldGold has always been the world's instinctive response to fear. When people lose trust in governments, currencies, or financial systems, they buy gold. The years from 2020 to 2026 gave the world more reasons to be fearful than any period in recent memory — a pandemic, a land war, a global trade war, and an active military conflict in the Middle East. Through all of it, gold responded in a consistent and predictable way. This article traces that journey in plain terms.
1. The COVID-19 Pandemic (2020)
When COVID-19 brought the world to a standstill in early 2020. Financial markets panicked, stocks crashed, then gold- despite its safe haven reputation- also dipped initially, falling to $1,451 in March 2020, as investors sold everything just to raise cash.
But the real story came after. Governments worldwide unleashed trillions in emergency spending. Central banks slashed interest rates to bare minimum. With much new money flooding the system, every dollar in existence became worth a little less- and gold, which cannot be printed, became worth more.
By August 2020, gold had surged to a new all-time high of $2,075. A 43% gain from the panic low in just five months. Gold ended 2020 up 25% for the year- one of its best annual performances in over a decade.
➡ Gold dips in the initial panic. The real surge comes afterwards.
2. The Russia-Ukraine War (2022–2024)
Russia's invasion of Ukraine in February 2022 sent gold sharply higher- it briefly touched $2,070 on fear alone. But then something unexpected slowed it down- the US Federal Reserve raised interest rates aggressively to fight post-COVID inflation. Higher rates make bonds attractive, which reduces demand for gold. Despite an active war in Europe, gold fell back to $1,614 by September 2022.
What supercharged Gold was de-dollarization because eventually the countries like China, India, Turkey, Poland, and Saudi Arabia began buying gold at record levels to reduce their dependence on the US dollar. This was a structural shift- not short-term fear, but long-term strategy.
Gold responded sharply and by October 2024, it had climbed to a new all-time high of $2,790. The year 2024 closed with a 28% annual gain.
➡ Rising interest rates can slow gold even during a war. But when sovereign nations start replacing dollar reserves with gold, it creates a long-term floor under prices.
3. The US-China Trade War (2025)
Entering 2025, the US imposed sweeping tariffs on China and other major trading partners- in some cases over 100%. Retaliation followed and Global supply chains, still fragile from COVID, further fractured. Inflation fears returned. Growth forecasts were cut. The US dollar weakened as investors began questioning the stability of the dollar-centric global trading system.
For gold, this was a near-perfect environment. Economic uncertainty, a weaker dollar, rising inflation fears, and waning confidence in the existing financial order- all at once. Gold crossed $3,000 in March 2025 for the first time ever and reached $3,500 by April 2025. The trade war added a powerful new leg to an already strong bull market.
➡ Trade wars weaken the dollar and raise inflation fears simultaneously — both are directly positive for gold.
4. The Israel-Iran War (February 2025 – Present)
Recently, the Israel-Iran turmoil entered into a direct armed conflict. The impact was immediate and severe. Oil prices surged, adding an energy shock on top of already elevated inflation from the trade war. Middle East instability and concerns about a wider regional conflict added a significant fear premium to gold.
Gold entered overdrive. Already at elevated levels from the trade war, it climbed through $4,000, $5,000, and peaked at $5,602 in January 2026- the highest price gold has ever traded at in nominal terms. In roughly one year, gold had risen 113% from the start of 2025.
As of mid-March 2026, gold has pulled back to approximately $4,502. A hotter inflationary environment is pushing back expectations for interest rate cuts, causing a short-term correction. This may be entirely normal. Every major gold rally in the discussed time period has included pullbacks along the way- before eventually moving higher.
➡ Wars in oil-producing regions has brought uncertainty in gold too. Higher chances that the current pullback is potentially a correction, not a reversal.
What Happens Next? Possible Scenarios
The Israel-Iran war is still active. The trade war has not been resolved. Central banks are still buying gold. Interest rates are still expected to fall. Based on how gold has behaved through every crisis in this period, here are the three realistic paths from here:
Key Takeaways
Six years, four crises, one consistent story. Every time the world has been shaken- by a pandemic, by war, by trade conflict- gold has ultimately moved higher.
The current pullback from $5,602 to around $4,502 could be noise, not a long-term trend change. History from this very period shows that gold corrects and then resumes. As long as the underlying conditions remain in place, so does the gold bull market.
Disclaimer: This writeup is for informational/educational purposes only- neither from a gold expert nor from a global economist. It does not constitute any financial or investment advice. Always consult a qualified professional before making investment decisions.

Gold Goes Full Niagara in $400 Wipeout. Is It Over & What Next?Gold, you had one job.
When the world gets scary, gold OANDA:XAUUSD typically goes up. Wars, inflation, geopolitical mess: gold is supposed to be the adult in the room, the asset that holds its nerve while everything else panics.
On Wednesday and Thursday, gold forgot its job entirely, shed nearly $400 in less than 24 hours, and left a lot of traders wondering what just happened.
🌊 The Niagara Drop, Explained
The fall did not come from nowhere, even if it felt that way. Gold had been testing a key support zone at $4,970 to $5,000 for several days.
Support, for the uninitiated, is a price level where buyers have historically stepped in to stop further declines. Think of it as a floor. When a floor gets tested repeatedly, it eventually either holds or gives way.
This one gave way.
Once the $4,970 floor cracked, the selling accelerated fast. By early Thursday, gold was printing new lows with nearly every tick, eventually landing at about $4,600 per ounce. A $600-plus move in total from recent highs.
📐 The Chart Was Sending Signals
Here is the part that stings a little. The setup was readable, at least in hindsight, and arguably in real time for anyone watching closely.
Gold had been travelling inside an ascending channel, a pattern where price moves upward between two parallel rising lines, one acting as support below and one as resistance above.
The upper resistance line proved stubborn throughout: it held at $5,096 on February 4, $5,205 on March 4, and $5,238 on March 10. Three rejections at the ceiling, each one a quiet warning that buyers were running out of conviction at the top.
When resistance holds that firmly and support starts getting tested at the bottom, the channel is telling you something. If you missed the full 6400 move, the support break alone offered a tradeable $400 leg lower once $4,970 gave in.
☮️ Gold's Identity Crisis
Let’s see what the fundamentals are saying.
The Iran war escalating further , with oil reserves now taking direct hits, should theoretically have sent gold soaring.
Geopolitical shock, supply disruption, market fear: that is the exact environment where gold historically shines as a safe haven asset, meaning a place investors park money when they want safety over returns.
Instead, the opposite happened. Traders appear to be selling gold as a highly liquid asset, meaning it is easy to sell quickly at a fair price, to raise cash. The US dollar strengthened as a result, and a stronger dollar typically pushes gold lower since gold is priced in dollars globally.
Gold is having something of an identity crisis. The safe haven playbook is not running the way it usually does.
🏦 Powell Pours Cold Water
Federal Reserve Chair Jay Powell added another layer on Wednesday, telling reporters that inflation remains a very real threat to the US economy.
The Fed kept interest rates unchanged, in one of the higher-impact events on the economic calendar , but the tone was cautious enough to send the dollar higher and gold even lower.
The mechanism here is worth understanding. When interest rates stay elevated, fixed-income assets like bonds become attractive because they pay a guaranteed yield.
Gold pays nothing. It just sits there looking shiny. So when rates are high, the opportunity cost of holding gold, meaning what you give up by owning it instead of something that pays interest, rises.
Higher rates technically equal a stronger dollar and that usually means a less compelling case for gold. Powell just confirmed rates aren’t going anywhere soon.
With energy prices surging on the Iran conflict and threatening to keep inflation elevated, analysts are now asking not when the Fed might cut rates, but whether rate cuts are on the table at all.
Powell himself flagged the concern: an energy shock layered on top of the tariff shock and the pandemic legacy is precisely the kind of sequence that makes inflation expectations difficult to manage.
🧭 What Comes Next
Gold is now trading well below its former support zone, which often becomes resistance on any bounce back up. Watch the $4,970 to $5,000 area closely. On the flip side, the $4,600 to $4,570 range is a nice chance for some much-needed support.
If gold tries to recover and stalls there, sellers are back in control. A clean reclaim of that zone would be the first sign that buyers are regrouping.
The fundamental picture, rates staying put, dollar staying firm, energy prices staying hot, keeps the pressure on gold for now.
The trade that worked for months has shifted. Until the rate narrative changes or the dollar softens, gold's next move is far from the straightforward climb it looked like just a month ago.
Off to you : Did you catch the falling prices? Just make sure not to YOLO-FOMO now.

XAU/USD | Gold Breaks $5000 – Liquidity Fill Before Next Drop?By analyzing the #Gold chart on the 4-hour timeframe, we can see that after the previous update, price failed to hold above the key $5050 level and entered a strong bearish expansion.Gold experienced a sharp sell-off and even dropped to the $4835 level, clearly breaking below the major $5000 psychological support, confirming strong selling pressure in the market. However, this aggressive move created a liquidity void between the $4978 and $4988 region, which is a key imbalance that price may attempt to fill in the short term. Following this drop, we may expect a short-term corrective move toward this imbalance zone, as markets tend to revisit and fill such gaps.
At this stage, the $5000 level becomes the key rejection zone for determining the next move. If price fails to reclaim and hold above $5000 and instead shows rejection from this level, we may see a continuation of the bearish trend. In that case, the mid-term downside target stands around $4785 , which could be reached if selling pressure continues to build. As always, this analysis will continue to be updated step by step as price reacts to the next important levels.
Please support me with your likes and comments to motivate me to share more analysis with you and share your opinion about the possible trend of this chart with me !
Best Regards , Arman Shaban

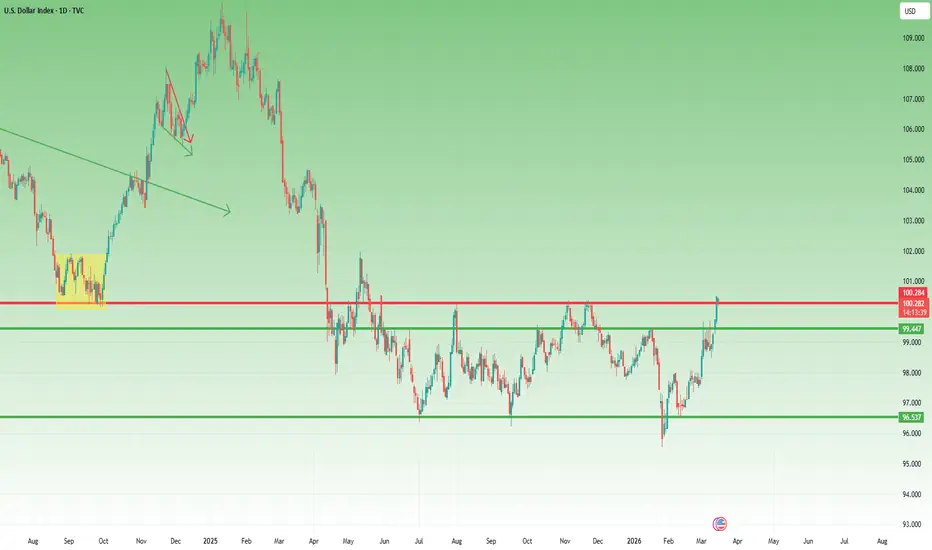
DXY Tests the 100 Resistance After a Strong Rally- What's next?After the false break at the end of January, the US Dollar Index began a steady recovery that has now developed into a rally of more than 5%. Over the past six weeks, the move has been relatively consistent, gradually pushing the Dollar higher and bringing the index to an important technical area.
At the moment, DXY is trading near the 100 level, a figure that carries both psychological and technical significance. Round numbers such as this often act as natural reference points in the market, where price reactions tend to appear as participants reassess positioning.
A Strong Rally Meets Resistance
Following such a sharp advance in a relatively short period of time, it would not be unusual for the Dollar to experience a period of consolidation or correction.
For this reason, some short-term retracement or sideways movement around the current levels would not be surprising.
The Medium-Term Picture
However, despite the possibility of a short-term pause, the broader structure appears to have shifted.
The recovery following the January false break suggests that the medium-term trend for the Dollar is gradually turning to the upside. The market has shown the ability to maintain higher levels and sustain buying pressure over the past several weeks.
In that context, any correction that develops could simply represent a natural pause within a broader upward move.
Looking Ahead
Once the current rally stabilizes and the market completes a potential correction phase, the next technical area of interest on the upside sits around the 103 zone.
This level represents the next meaningful objective if the Dollar’s upward momentum continues to develop.
Implications for Currency Pairs
A stronger Dollar environment naturally has implications across the major currency pairs.
If the broader bullish structure for DXY continues to unfold, it could translate into downside pressure for Dollar-denominated pairs, particularly:
- EURUSD
- GBPUSD
- AUDUSD
- NZDUSD
For that reason, once the Dollar completes its potential corrective phase, these pairs may present opportunities on the short side.
Conclusion
The Dollar has delivered a strong rally of more than 5% since the January false break, bringing the index to the important 100 resistance level.
While a short-term correction could appear after such a move, the medium-term structure increasingly suggests strength.
If that structure continues to develop, the next upside objective for DXY could be found around the 103 area, with corresponding pressure likely to appear across several major currency pairs. 🚀
Micron on the Brink as AI Momentum Pressures a Break Above 460Micron is setting up in a very strong position here, with both the fundamental and technical backdrop leaning in the same direction. The AI memory theme remains the core driver, and that narrative is being reinforced by HBM4 production, capacity expansion, and elevated expectations into the March 18, 2026 earnings report. On the chart, the daily and weekly structures are both firmly bullish, with price holding above the 20-day, 60-day, and 120-day moving averages while market structure continues to print higher highs and higher lows.
What stands out technically is the bull flag developing just under the $460 area. That level is the immediate Resistance zone and the key trigger for continuation. A daily close above $460 would confirm the breakout and open the door toward $475 first, with $500 to $515 as the broader extension if momentum carries through. Support sits at $425, which is the most important level to hold in the near term and also lines up with the breakout base and rising short-term trend support.
The primary path remains bullish while price stays above $425 and continues to pressure the top of the flag. Momentum studies support that view, with a bullish MACD crossover, squeeze conditions favoring expansion, and a clear BOS-up structure across both timeframes. The alternative scenario is a failed breakout or post-earnings sell-the-news reaction. A daily close below $425 would weaken the setup and shift focus toward the $415 area first, then the $375–380 zone

How Much Risk Per Trade? Less Than You Think. With One ExceptionPicture this: third week of trading. You've done the reading, watched the tutorials, and found a setup that looks absolutely bulletproof.
Your gut tells you to buy. So you go in big. The trade reverses, takes 40% of your account with it, and leaves you staring at a red screen wondering where it all went wrong. Sounds familiar, silver traders from earlier this year ?
🎯 The Number Most Beginners Ignore
Professional traders obsess over risk per trade. Beginners obsess over entries and dreamed-up profits. That gap in priorities explains a lot of blown accounts.
The standard rule, used by traders who keep things tight, is to risk no more than 1% to 2% of total capital on any single trade. On a $10,000 account, that's $100 to $200 per trade. It sounds modest. And that's the point.
The 1% rule keeps you alive long enough to get good (or lucky). A trader risking 1% per trade can lose twenty consecutive trades and still have most of their capital intact.
A trader risking 20% per trade on that same streak is essentially finished. The math is uncomfortable, but it is consistent.
📐 How to Calculate It
Risk per trade is the distance between your entry and your stop loss, multiplied by the number of units you hold. Work backwards from your maximum acceptable loss to determine how large a position to take.
Say you're buying a stock at $50 with a stop at $47. Your risk per share is $3. On a $10,000 account with a 1% risk limit, your maximum loss is $100.
Divide $100 by $3 and you get roughly 33 shares. That's your position size. The numbers give you the answer. Your gut does not get a vote.
Apart from thousand of stocks , you can apply that strategy to virtually any trading instrument out there, including currency crosses , and the volatile crypto assets .
🧘 Why Small Risk Feels Wrong at First
New traders resist this framework because small positions feel pointless. If you're only risking $200 into a trade, what's the upside worth getting excited about?
More than you expect, over time (especially if there’s leverage involved, which is most cases). Trading is a game of repetition and compounding.
A strategy with a solid edge, applied consistently at sensible position sizes, builds capital steadily. A strategy applied at reckless sizes might win big once, then erase everything on the following loss. One of those paths leads somewhere useful.
Small risk also does something underrated: it keeps your psychology intact. When you risk 20% of your account, every tick against you becomes a physical experience.
Judgement deteriorates. You close too early, hold too long, or freeze entirely. Risk 1% and the trade becomes almost academic and routine. You follow the plan because the plan is what you're managing, not the outcome.
⚡ The Exception: When Everything Lines Up
Here is where the rulebook earns a torn page, applied carefully and with full awareness.
Occasionally a trade arrives that is the convergence of everything. The technical setup is clean and unambiguous. The fundamentals support the direction. Market sentiment is moving in agreement.
Price action, story, and crowd psychology all pointing at the same target simultaneously. These moments are rare. When they arrive, sizing up is an appropriate response to a genuinely higher-probability opportunity. Call it a one-way bet, or an asymmetric bet , it happens sometimes.
Stretching to 3% or 5% of capital in these situations is a legitimate, considered decision. The most seasoned traders in the world reserve their largest positions for exactly these setups, keeping the rest of their book tight while concentrating firepower on the high-conviction, high-impact ideas.
The distinction worth burning into memory: conviction earned versus conviction felt. Conviction earned means the chart structure is there, the macro backdrop supports the trade, and the market is already moving in agreement.
Conviction felt means you really like the story and the stock or the currency cross went up last week. One of those justifies a larger bet. The other justifies the standard 1%.
📌 The Rule, Restated
Risk 1% to 2% per trade as your baseline. Treat it as the default, with room to stretch on the rare occasions when technicals, fundamentals, and market sentiment converge into a single coherent argument. When all three agree, listen and size accordingly.
The rest of the time, stay small, stay consistent, and let the edge do the work.
Off to you : What’s your risk per trade? Share your strategy in the comments!

GER40 — Global Outlook | MTF 1M → 1W → 1DGER40 — Global Outlook | MTF 1M → 1W → 1D
Higher-timeframe resistance | Global short scenario toward monthly discount
Overview
GER40 is trading inside a higher-timeframe resistance zone and is entering a corrective phase on the higher timeframes. Price has reached the monthly order block inside the monthly order flow and is now getting its first reaction from this area.
At this stage, the market remains in the monthly premium zone , while signs of weakness are gradually forming on the weekly and daily timeframes. The base scenario is a continuation of the downside move toward the monthly discount .
Higher-Timeframe Context (1M → 1W)
Monthly Timeframe (1M)
Price has reached the monthly order block , located inside the monthly order flow , and is now getting its first reaction from this area
This is the first major resistance zone for buyers, from which a bearish continuation may begin
If this area fails to hold price, the next target will be the untested monthly order flow in the discount zone of the last bullish impulse
The last bullish impulse and its corresponding discount zone are also clearly visible on the quarterly timeframe
Monthly focus
First resistance zone: 18 800 – 22 700
Next monthly area of interest in discount: 11 800 – 16 500
Weekly Timeframe (1W)
Price swept the monthly fractal and expanded toward the monthly order block
For bearish confirmation, the key condition is the formation and retention of the weekly MTV zone
This area contains the highest traded volume of the last year
A закрепление below 23 350 would confirm seller strength
In that case, the 23 350 – 25 500 range can be treated as a resistance zone that sellers continue to defend
An additional confirmation of buyer weakness is the RSI divergence between the extremes of March 2025 and February 2026
Weekly focus
Seller strength confirmation below: 23 350
Weekly resistance / MTV zone: 23 350 – 25 500
Execution Context (1D)
Daily Timeframe (1D)
A daily MTV zone has already formed on the daily chart inside the potential weekly MTV zone
This provides a more precise working area inside the higher-timeframe resistance
If price returns for a retest, this area may be considered a zone of interest for building a short position
Daily focus
Confirmed daily MTV inside weekly resistance
Potential retest zone for building a short position
❗ Invalidation
The global short scenario will weaken if the market manages to accept above the current higher-timeframe resistance zone and return buyer control over this area. Until then, any upside move is treated as limited or corrective.
Analysis Summary
1M: price is reacting from the monthly order block inside the monthly order flow and remains in the premium zone
1W: the monthly fractal has been swept, the weekly MTV zone is forming, and RSI divergence is present
1D: the daily MTV zone has already formed inside the weekly resistance zone
Base scenario: continuation of the downside move toward the monthly discount
Next major area of interest: 11 800 – 16 500
Your thoughts?
Which scenario do you see for GER40: continuation lower from the current resistance, or an attempt by buyers to regain control of the zone?
This is not investment advice. Analytical market structure overview.

Gold Sliding Toward 5000 — Correction or Start of a Bigger Drop?Gold continues to trade under pressure on the H2 timeframe, with price gradually losing bullish momentum after the recent macro-driven volatility.
Despite periods of geopolitical tension and market uncertainty, gold has struggled to regain strong upside traction.
This raises an important question for the coming week: is the current decline simply a correction inside a broader range, or the early phase of a deeper liquidity move?
Macro Narrative
• Recent US economic data remains relatively strong, supporting the US Dollar.
• Lower unemployment claims suggest the labor market remains resilient.
• A stable or stronger USD environment typically pressures gold.
• Geopolitical risk still exists but has not yet triggered strong safe-haven flows.
News Context
Markets are entering a new week with focus shifting toward upcoming US economic releases and Federal Reserve expectations.
After last week’s CPI data aligned with expectations, traders are now reassessing the next macro catalyst that could drive volatility in gold.
IF–THEN News Scenarios
If the USD remains strong next week:
Gold may extend its decline toward deeper liquidity zones below 5000.
If risk sentiment weakens or geopolitical tensions escalate:
Safe-haven demand could stabilize gold and trigger a recovery.
Technical Overview
On the H2 chart, gold remains inside a corrective structure after failing to maintain its previous bullish impulse.
Price recently rejected the 5068 resistance zone, which aligns with a Fibonacci retracement level and prior liquidity area.
The current structure suggests the market may still be searching for liquidity below, with the next significant support appearing near 4848, which coincides with the 1.0 Fibonacci extension of the current corrective leg.
Until price reclaims the broken resistance zones, short-term momentum appears to favor the downside.
Key Levels
Resistance: 5068
Current price area: ~5020
Psychological support: 5000
Major liquidity target: 4848
Market Debate
Is gold preparing for a liquidity sweep below 5000 next week?
Or will buyers defend this area and trigger a reversal?

Natural Gas Stock Forecast | Oil | Dollar | Silver | Gold0:00 Weekly Commodities Market Overview
0:26 Natural Gas (NG) Technical Analysis
3:54 Crude Oil (WTI) Technical Analysis NYMEX:CL1!
5:26 US Dollar Index (DXY) Analysis
7:38 Gold (XAUUSD) Price Analysis COMEX:GC1!
9:46 Silver (XAGUSD) Technical Analysis COMEX:SI1!
11:52 Weekly Commodities Wrap Up

Meta bets on independence in AI chipsMeta bets on independence in AI chips and strengthens its technological strategy
[/b ]By Ion Jauregui – Analyst at ActivTrades
The race for artificial intelligence continues to accelerate and Meta Platforms has decided to take a strategic step to reduce its dependence on large hardware providers. The company has presented a new generation of its own chips intended to boost its artificial intelligence systems, in a move that seeks to optimize performance and reduce energy costs in the long term.
Among the new developments, the MTIA 300 stands out, already used to manage recommendation systems on platforms such as Facebook and Instagram. Added to this is the MTIA 400, a more advanced architecture designed for large data centers, with liquid cooling systems and configurations that can occupy several complete racks.
The company’s technological roadmap does not stop there. The MTIA 450 and MTIA 500 models are planned between 2026 and 2027 and will be mainly focused on AI inference processes, a segment where demand is growing exponentially. With this strategy, Meta aims to reduce its dependence on external suppliers such as Nvidia and Advanced Micro Devices, although the development still relies on strategic partners such as Broadcom in design and Taiwan Semiconductor Manufacturing Company in manufacturing.
However, this technological bet has a considerable cost. Meta plans to allocate between 115 and 135 billion dollars in infrastructure during the year, reflecting the magnitude of the global race to dominate artificial intelligence.
Technical analysis of Meta
From a technical point of view, Meta Platforms shares have recently moved within a range between 600 and 700 dollars, with the maximum recorded in January around 740 dollars being the upper ceiling of the range observed during 2025. The stock has remained sideways during the month of February and the first half of March, recording in the last session a bearish close at 632 dollars, placing itself in the middle zone of the range and near the point of control (POC) of traded volume, located approximately at 662 dollars.
In terms of trend structure, the market maintains a consolidation behavior after the bearish moving average crossover (“death cross”) recorded on February 19, which has resulted in a phase of price lateralization. During this period, the asset has tested the support zone around 630 dollars on four occasions, reinforcing this area as a relevant technical consolidation level.
Below this level, the next support is located at 600 dollars, while the relevant minimum of the current range is found at 579 dollars. The consecutive loss of these two levels could increase selling pressure and open the door to a deeper correction in the short term.
On the bullish side, the main resistance is located around 680 dollars, a zone that has acted as one of the most relevant rejection levels during the last twelve months, with four failed breakout attempts, excluding the specific maximum reached in February. A consistent breakout above this zone would allow the price to try to recover the 700-dollar area, which would then act as dynamic support within the current range. Once this level is surpassed, the next technical objective would be located at 739–740 dollars, corresponding to the previous highs of the year.
Regarding momentum indicators, the RSI remains at neutral levels around 48.19%, reflecting the absence of overbought or oversold conditions, while the MACD continues to show a sideways structure with the averages below the histogram, signaling the bearish movements observed in recent sessions.
Technological independence
Meta continues to develop a strategy of technological independence through the development of its own artificial intelligence chips, a movement that could strengthen its competitive positioning in the long term within the AI ecosystem. However, from a technical point of view, the stock currently remains in a consolidation phase within a wide sideways range, where the 630-dollar zone will be key to defining the short-term structure.
As long as the price remains within the 630–680 dollar range, the market could continue to show sideways movements. A breakout of the resistance would open the path toward the 740-dollar highs, while the loss of the indicated supports could activate a deeper corrective phase.
*******************************************************************************************
The information provided does not constitute investment research. The material has not been prepared in accordance with the legal requirements designed to promote the independence of investment research and such should be considered a marketing communication.
All information has been prepared by ActivTrades ("AT"). The information does not contain a record of AT's prices, or an offer of or solicitation for a transaction in any financial instrument. No representation or warranty is given as to the accuracy or completeness of this information.
Any material provided does not have regard to the specific investment objective and financial situation of any person who may receive it. Past performance and forecasting are not a synonym of a reliable indicator of future performance. AT provides an execution-only service. Consequently, any person acting on the information provided does so at their own risk. Political risk is unpredictable. Central bank actions can vary. Platform tools do not guarantee success.

Global Stress, Market Response: What Crypto History Reveals✌️Hey folks!
You know how it goes — every time another global crisis hits, markets start to get nervous. But in crypto, things tend to get a lot wilder. Over time, we've seen how the crypto market reacts uniquely to global stressors, sometimes acting as a safe asset, and other times just feeding the panic.
Let’s break down some key moments in crypto history where geopolitical events, economic fears, and global uncertainty drove the market’s reaction.
🦠 March 2020: Pandemic Panic and the Crypto Market's Rollercoaster
When COVID-19 hit in early 2020, global markets freaked out. Stock prices plummeted, oil prices went negative, and the crypto market wasn’t immune to the chaos. Bitcoin, often hailed as a "protective asset", dropped over 60% in just a matter of days, a clear sign of crypto volatility spikes. This dramatic decline happened during one of the most severe market panic behaviors in recent memory.
However, what’s interesting is the crypto market reaction that followed. As governments ramped up stimulus measures and inflation fears grew, Bitcoin began its climb back, fueled by institutional adoption and concerns over fiat currency devaluation.
Bitcoin during crisis periods like these revealed its dual personality – one of initial shock and market fear, followed by a subsequent rebound driven by bitcoin macro correlation and global risk sentiment.
At the same time, we saw just how volatile the market was. The RVI (Relative Volatility Index) repeatedly broke the 80-mark, highlighting the extreme price swings and the high levels of market uncertainty during that period.
⚔️ February 2022: War in Ukraine and the Global Stress Test
Fast forward to February 2022. The geopolitical tensions surrounding Russia’s invasion of Ukraine turned the world upside down. As traditional markets scrambled to adjust, crypto once again showed its own form of market psychology under stress. Bitcoin, along with other cryptocurrencies, initially took a hit.
However, in the days that followed, crypto seemed to decouple from traditional assets.
Many viewed Bitcoin as a crypto safe haven, particularly in regions with high inflation and unstable currencies. The crypto market’s reaction to geopolitical risk markets was more nuanced this time, with investors seeing Bitcoin as a store of value amid the escalating geopolitical risks.
On the flip side, there was also a significant crypto uncertainty as market participants weighed the potential for regulatory crackdowns in the wake of financial sanctions and capital controls.
😰 Other Macro-Driven Stress Periods
Looking at other periods of crypto volatility history, it’s clear that the market’s response to global stress isn’t always predictable. Risk‑on / risk‑off behavior often dictates how crypto moves amid heightened uncertainty.
For example, in January 2026 , Trump made statements about the potential threat from Iran, suggesting that the U.S. needed to be prepared for military action if necessary. Following these remarks, Bitcoin began to hit new lows, dropping nearly 39% to $60,000 as market uncertainty and geopolitical tensions intensified.
When the U.S.–Iran operation began , the market dropped only 4.5% due to the fact that tensions had already been priced in, with investors anticipating some form of escalation.
After the initial dip, risk-on sentiment and expectations of limited conflict sparked a rebound, leading investors back into assets like Bitcoin.
The market reacted cautiously, as traders believed the situation wouldn't escalate into a full-scale war, which helped stabilize prices.
🏁 Final Take
What does this reveal about Bitcoin and crypto in general? While crypto often experiences sharp volatility at the start of a crisis, what follows is a complex mix of market panic and macro factors.
Crypto’s role as a “safe asset” is still debated, as it can both provide refuge during geopolitical stress and mirror the crypto market fear in times of uncertainty.
As global risk sentiment crypto shifts , so will the market's response, with Bitcoin showing time and again that crypto uncertainty is an inherent, unpredictable form of volatility.
This material does not constitute financial advice. Always do your own research and consider the risks before making any decisions.

TheGrove | USDCAD Buy | Idea Trading AnalysisUSDCAD is falling towards a support level which is a pullback support and could bounce from this level to our take profit.
We expect a decline in the channel after testing the current level which suggests that the price will continue to rise, to Support line..
Hello Traders, here is the full analysis.
I think we can soon see more fall from this range! GOOD LUCK! Great BUY opportunity USDCAD
I still did my best and this is the most likely count for me at the moment.
-------------------
Traders, if you liked this idea or if you have your own opinion about it, write in the comments. I will be glad 🤝

13.03.26 Daily ForecastPairs on Watch -
FX:USDJPY : I am looking at a short on this today as price is sat at highs where we could see it turn around for sells. There is a value area above price could be getting pulled to, so if it does break out long I am open to this idea as well. I also include a little overview of a 5M advanced position on this pair yesterday that I have logged for data, which would have been a 4.5% manual close.
FX:NZDCAD : Not on watch today but I decided to include a mini breakdown of a short position I took yesterday on this pair for a 3% take profit, and the details behind the structure/entry itself.

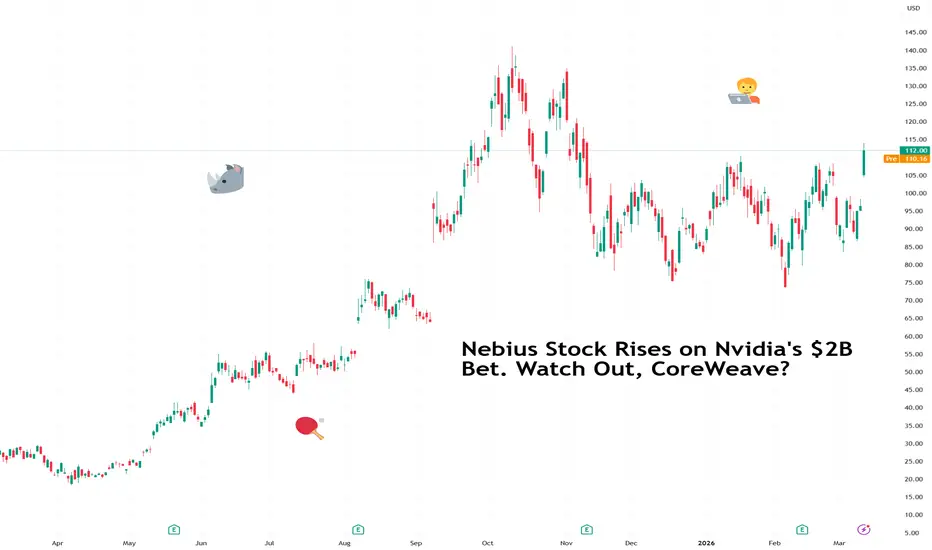
Nebius Stock Rises on Nvidia's $2B Bet. Watch Out, CoreWeave?Most people couldn't have named Nebius NASDAQ:NBIS yesterday. By this morning, it was up 16% and everyone had it on their watchlist.
The Amsterdam-based cloud company, spun out of Yandex's international operations, just landed a $2 billion investment from Nvidia NASDAQ:NVDA .
The stock responded the way any company would when Jensen Huang personally decides it's worth backing: with considerable enthusiasm.
🤑 The $2 Billion Vote of Confidence
The capital comes with a mandate. Nvidia's investment is earmarked to help Nebius deploy more than five gigawatts of computing capacity by 2030. Five. Gigawatts. That's a small country's worth of power pointed squarely at AI workloads.
For Nvidia, this is a familiar playbook. The chip giant holds a major stake in CoreWeave NASDAQ:CRWV , announced a further $2 billion share purchase in January, and recently put $30 billion into OpenAI.
At some point it stops being strategic investment and starts being something more deliberate: Nvidia building a vertically integrated AI empire, one neocloud at a time.
Jensen Huang put it with his usual cinematic composure: "Together, we are scaling the cloud to meet the surging global demand for intelligence." Mission statement or sci-fi thriller opening line. Possibly both.
📈 The Neocloud Trade Is Very Much Alive
Nebius wasn’t the only one getting a lift. CoreWeave climbed 9.4% on the news. IREN, a smaller peer, added 10%. Who said the AI infrastructure trade was cooling off? The year-on-year gains tell the story well.
• Nebius NASDAQ:NBIS is up roughly 300% over the past twelve months to a market cap of $28 billion.
• IREN NASDAQ:IREN has done better still, up 500% to $16 billion.
• CoreWeave NASDAQ:CRWV , the heavyweight at $43 billion, has doubled. In any other sector a 100% return would be the headline. Here it is the consolation prize.
🏗️ From Yandex Spin-Off to AI Infrastructure Contender
Nebius did not begin life as an AI cloud company. Carved out of Yandex's international operations in late 2023, it spent time working out what it wanted to be. The answer turned out to be: extremely relevant.
The company built its base serving AI startups and smaller customers. Then the enterprise wins started arriving. Microsoft NASDAQ:MSFT agreed to purchase $17.4 billion of capacity over five years. Meta NASDAQ:META followed with a $3 billion contract.
The financials back it up. Nebius posted 2025 revenues of $529.8 million, up 479% year over year, and swung from a net loss of $641.4 million in 2024 to net income of $101.7 million.
It expects to close 2026 with annual recurring revenue of $7 to $9 billion. For a company that was a blank canvas less than three years ago, that is a remarkable amount of canvas filled in.
🔮 Nvidia's Ecosystem Play
Nvidia investing in its own customers raises eyebrows in some areas of the market. The sceptic's read: circular. Nvidia funds companies that buy Nvidia chips, demand rises, more investment follows.
The optimist's read: brilliant. Nvidia diversifies its partner/customer base, locks in long-term demand for future chip generations, and ensures whoever wins the infrastructure race is running on its hardware.
As the earnings season comes to a close, Oracle's NYSE:ORCL results, out earlier this week , added another data point.
The company secured more than 10 gigawatts of power and data centre capacity coming online over three years, and holds a $300 billion cloud contract with OpenAI. The infrastructure spending wave is the dominant capex theme of the decade, and Nvidia is positioning itself at every layer of it.
🏁 Pick Your Horse
The neocloud field is getting crowded and will get more so. Nvidia-backed startups Crusoe, Lambda, and Together AI are three private companies that may go the IPO way sooner rather than later. When they arrive, this conversation gets considerably more competitive.
Presently, the three major public neocloud rivals fight for attention. Each is a different bet. Nebius is the momentum story with enterprise tailwinds. CoreWeave is the blue-chip neocloud. IREN is the high-octane smaller-cap play for those who like their risk undiluted.
The AI infrastructure buildout is gathering pace. The question is which players are still standing when the gigawatts start generating returns.
Off to you : What horse are you betting on?