Germany 40 Index – Pure Relief Rally or Something More?The strength of yesterday’s risk rally in the Germany 40, from a close on Tuesday at 23181 up to a high of 24240 yesterday, a spike of 4.5%, shows how much traders want to believe that the 14 day ceasefire is going to hold, oil will restart flowing through the Strait of Hormuz and on-going talks between the US-Iran will lead to further deescalation and an eventual end to the conflict.
However, there is still a lot to be resolved, and a high level of uncertainty remains. In the short term, claims from Iran that the ceasefire proposal has already been contravened have helped to put a cap on the rally, but the dip has been shallow (23910, 0730 BST) with traders initially willing to look beyond this and focus on the potential outcome of direct talks between the US-Iran which are currently scheduled to begin on Saturday morning in Islamabad, Pakistan. This situation could still change quickly.
Looking forward, general risk sentiment could also be impacted by the outcome of 2 key US inflation updates. The Fed’s preferred inflation gauge, the PCE Index, is due for release later today at 1330 BST, and then the CPI reading is due tomorrow at the same time. Any print above expectations could weigh on the recent risk rally, while an in-line or below expectation print could help to calm market concerns that the surge in global energy prices may force central banks, like the Fed and ECB, into interest rate hikes later in the year.
It is important to note, 48 hours is a long time to hold positions in this current volatile environment so there could be bigger moves on the horizon if traders feel the need to reposition or bank some profits on the recent Germany 40 rally into the Friday close.
Technical Update: Risk On Support Sees Retracement Resistance Challenged
While the Germany 40 Index had already entered a phase of price strength, it was the announcement of the 14-day ceasefire between the US and Iran that triggered further risk on sentiment, adding to the momentum of the latest recovery. Putting this move into numbers, the March 23rd low (21850) into Wednesday’s high (24240) saw the index rise around 11%.
Looking forward, much will clearly depend on future developments in the Middle East, including if the ceasefire holds. However, as the chart above shows, traders may now also be focused on a key potential resistance level at 24040, which is equal to the 61.8% Fibonacci retracement of the February 27th to March 23rd decline.
Potential Resistance Levels:
While the 24040 level was briefly broken within yesterday’s initial price strength, it held on a closing basis. For this reason, traders may now feel that 24040 needs to give way on a closing basis to open the potential of further positive momentum to extend the recovery move.
A close above 24040 could shift attention to 24357, which is the March 5th session high. A break above 24357, could open the way for moves toward 24676, which is the March 3rd upside extreme.
Possible Support Levels:
Of course, for now at least, the 24040 level is holding on a closing basis, which could suggest risks of a slowing in upside momentum. If this is the case, tests of downside supports may be seen, with the first level now perhaps marked by Wednesday’s low of 23751.
As the chart above highlights, closing breaks below 23751 could shift focus toward 23322, which is the 38.2% Fibonacci retracement of the latest advance. Closes below 23322, if seen, might then warn of further downside ahead, opening the way for declines to 23041, the deeper 50% retracement, even 22760, the 61.8% level.
The material provided here has not been prepared accordance with legal requirements designed to promote the independence of investment research and as such is considered to be a marketing communication. Whilst it is not subject to any prohibition on dealing ahead of the dissemination of investment research, we will not seek to take any advantage before providing it to our clients.
Pepperstone doesn’t represent that the material provided here is accurate, current or complete, and therefore shouldn’t be relied upon as such. The information, whether from a third party or not, isn’t to be considered as a recommendation; or an offer to buy or sell; or the solicitation of an offer to buy or sell any security, financial product or instrument; or to participate in any particular trading strategy. It does not take into account readers’ financial situation or investment objectives. We advise any readers of this content to seek their own advice. Without the approval of Pepperstone, reproduction or redistribution of this information isn’t permitted.
Community ideas

USDJPY H1 | Bearish Reaction Off Pullback ResistanceMomentum: Bearish
Price is currently below the ichimoku cloud.
Sell entry: 159.234
- Pullback resistance
- 61.8% Fib retracement
- 78.6% Fib projection
Stop Loss: 159.580
- Pullback resistance
Take Profit: 158.855
- Overlap support
High Risk Investment Warning
Stratos Markets Limited (fxcm.com/uk), Stratos Europe Ltd (fxcm.com/eu):
CFDs are complex instruments and come with a high risk of losing money rapidly due to leverage. 69% of retail investor accounts lose money when trading CFDs with this provider. You should consider whether you understand how CFDs work and whether you can afford to take the high risk of losing your money.
Stratos Global LLC (fxcm.com/en): Losses can exceed deposits.
Please be advised that the information presented on TradingView is provided to FXCM (‘Company’, ‘we’) by a third-party provider (‘TFA Global Pte Ltd’). Please be reminded that you are solely responsible for the trading decisions on your account. Any information and/or content is intended entirely for research, educational and informational purposes only and does not constitute investment or consultation advice or investment strategy. The information is not tailored to the investment needs of any specific person and therefore does not involve a consideration of any of the investment objectives, financial situation or needs of any viewer that may receive it. Past performance is not a reliable indicator of future results. Actual results may differ materially from those anticipated in forward-looking or past performance statements. We assume no liability as to the accuracy or completeness of any of the information and/or content provided herein and the Company cannot be held responsible for any omission, mistake nor for any loss or damage including without limitation to any loss of profit which may arise from reliance on any information supplied by TFA Global Pte Ltd.
Stratos Trading Pty. Limited (fxcm.com/au):
Trading FX/CFDs carries significant risks. FXCM AU (AFSL 309763), please read the Financial Services Guide, Product Disclosure Statement, Target Market Determination and Terms of Business at fxcm.com/au

Is BITCOIN Preparing the Next Wave Down? Wyckoff Distribution!Hello There,
welcome to my updated analysis about Bitcoin and the Wyckoff distribution I mentioned in my first analysis about this topic. In recent times, major bearish pressure increased, pushing the price below crucial zones. Also, massive bearish dumping accelerated. Over 100 million long liquidations took place. Speculative bearish pressure also increased because of the oil price hike.
Initial Analysis About the Ongoing Wyckoff Distribution:
Looking at my chart, Bitcoin completed the major Wyckoff distribution I mentioned in my previous analysis. As it tested the $97,000 level, it hit a strong resistance from which it pulled back bearishly. Since this pullback, it has completed the LPSY as I expected and mentioned in my previous analysis. Since this very decisive price move took place, Bitcoin pulled heavily downwards below previous lines of support.
The fact that Bitcoin broke out below this heavily crucial $84,000 level makes the whole setup highly bearish now. Currently Bitcoin is forming the next crucial formation. This formation is a potential bear flag. As Bitcoin is just testing the resistance levels again, this could be a major acceleration point for upcoming bearish pressure.
Bitcoin is now validly trading within phase D of this whole Wyckoff distribution. This means that supply is higher than demand. With the main resistance within the $84,000, a next bearish pullback from this zone is likely to complete the bear flag. A drop below the $62,000 level is completing the bear flag. From there on, massive bearish pressure is going to unfold decisive price action.
With this being said, thank you a lot for the support!
We will watch how the market evolves in the next times.
VP

The Weekend Habit That Separates Pros From AmateursHey whats up traders as it's Friday. it's time to remind an importance of Weekly Reviews and Journaling. This is your time and most important process in the consistent growth. Every weekend allow some time for yourself for not only reviewing the trades you took, but also you didn't took so you take them next time and put it all in to your journal. I was not doing this for years. Then when I started I finally identified the mistakes I repeat over and over and then I was able to eliminate them. And this is actually how I explored my strategy and found myself - by taking notes again and again. This is where you grow. If you learning some concept go step by step. Don't try to learn everything in a day or weekend. Our brain doesn't have capacity to it. There is a great book - Limitless - Jim Kwik (about brain and learning) hence I recommend doing notes with pen and paper. Your brain leans better this way than just doing a screenshot when watching a videos. ✅ Every weekend ask yourself these questions:
🧪 What worked well this week and what didn’t?
- Was there a type of trade that did/didn’t work well?
- Was there a particular market that I did/didn’t trade well?
- Was there a particular day/time that I did/didn’t trade well?
- Did I enter trades too soon?
- Did I enter trades too late?
- Did I take profits too soon?
- Did I take profits too late?
- Did I put my stops loss too tight?
- Did I use an unnecessarily big stop loss?
- Did I take take any trades with poor Risk:Reward ratio?
- Did I risk too much?
- Did I risk too little?
- Did I deviate from my trading model?
- Did I deviate from my plan?
🧪 Are there any recurring answers [positives or negatives?
📍For Positives: - How can I make sure I do more of this?
📍For Negatives:
- What is the problem?
- Why do I have this problem?
- What is the solution?
- How can I precent this from continue happening?
🧪What can I do to improve moving into next week? Example
- Entries were mostly well timed after manipulation and confirmation.
- Stop losses were generally placed correctly beyond structure.
- Risk:Reward was mostly acceptable but could still improve by waiting for cleaner entries.
💊 Create a column in you journal for mistakes
Every time you make some mistake or deviate from your plan writhe it there. Read this mistakes before every trading session. This is first step how you eliminate them.
🧠 Remember - No Journal - No success. Thats it.
David Perk

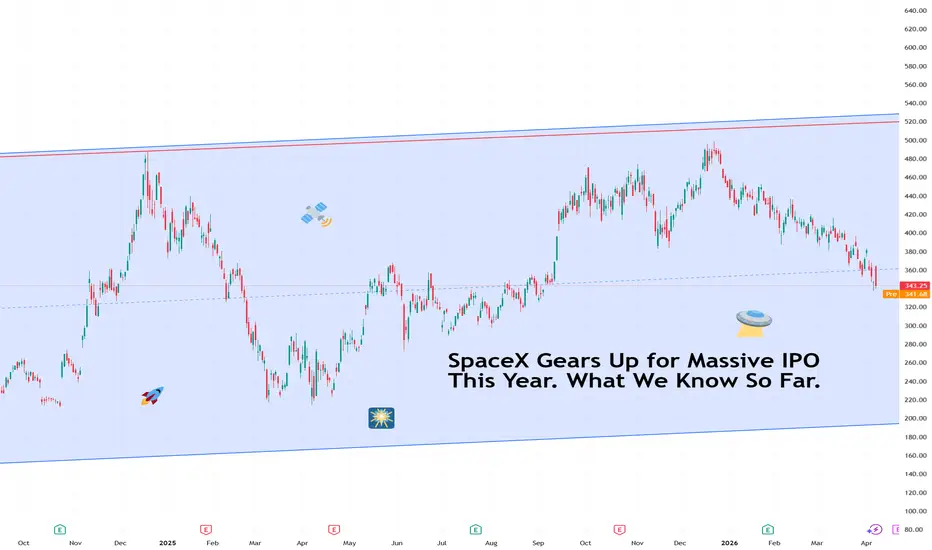
SpaceX Gears Up for Massive IPO This Year. What We Know So Far.At some point in the next few months, you may have the opportunity to own a piece of a rocket company . Not just any rocket company.
It’s the biggest privately-held rocket company that lands boosters on drone ships in the middle of the ocean and has made reusable spaceflight so routine that the launches barely make the news anymore.
SpaceX NASDAQ:SPACEX has confidentially filed IPO paperwork with the Securities and Exchange Commission, and if everything goes to plan, shares could be trading by July.
It’s the largest initial public offering in history and the most retail-friendly.
📋 The Confidential Filing
An IPO, or initial public offering, is the process by which a private company sells, or floats, shares to the public for the first time. Before it can do that, it has to file detailed financial and business disclosures with the SEC, the US markets regulator.
SpaceX has done this confidentially, which is standard practice and perfectly legal. The confidential route allows the company and regulators to have a back-and-forth dialogue about disclosures without the whole world watching over their shoulders.
The practical consequence for most investors is that the financials stay private until closer to the listing date. SpaceX plans to make its prospectus, the formal document laying out the business, risks, and financials for prospective investors, public in late May.
The IPO roadshow, the week of investor presentations where executives and bankers pitch the offering to institutional buyers, is expected to launch the week of June 8. A market debut by July is the goal.
💰 The Numbers
SpaceX NASDAQ:SPACEX is targeting an IPO raise of between $40 billion and $80 billion, according to the Wall Street Journal. That range alone would make it the largest IPO ever recorded, surpassing Saudi Aramco's $29.4 billion raise in 2019.
On the valuation question, Elon Musk himself stepped in on X to dismiss a Bloomberg report suggesting SpaceX was targeting a valuation above $2 trillion.
"Don't believe everything you read. Bloomberg publishes bs," Musk wrote , with characteristic restraint.
What is less contested: SpaceX last year generated earnings of $4 to $5 billion, with EBITDA, a measure of operating profitability before interest, taxes, depreciation, and amortisation, of $8 billion. Revenue was $15 billion to $16 billion, according to a Reuters report.
A valuation above $1.5 trillion looks ambitious against those numbers, implying a multiple of roughly 185 times earnings (or above 300, depending on your metrics of choice). But SpaceX is not being valued as a mature business. It is being valued as an infrastructure monopoly for the next century of space activity, which is a different animal entirely.
One notable side effect of a $1.5 trillion valuation: Musk, who owns roughly 43% of SpaceX, would instantly become the world's first trillionaire.
🚀 The xAI Merger
Before the IPO news, SpaceX made a different kind of headline. In February, SpaceX merged with Musk's artificial intelligence company xAI in what became the largest corporate tie-up by value in US history, creating a combined entity valued at $1.25 trillion.
xAI, which operates the Grok AI chatbot and competes directly with OpenAI and Anthropic, needed more financial firepower to stay in the race. Attaching it to SpaceX, which generates cash and owns critical infrastructure including the Starlink satellite internet network, solves that problem.
What do you own when you buy into the SpaceX IPO? You buy a rocket company fused with an AI company sitting on a global broadband network. And data centers in orbit.
👥 The Retail Investor Play
One key detail sets this IPO apart from most. SpaceX plans to reserve a significant portion of shares for retail investors, meaning ordinary individual investors rather than institutional funds.
Reuters reported that Musk wants to set aside up to 30% of shares for smaller investors, compared with the 5% to 10% that most companies allocate. The company also plans to host 1,500 retail investors at an event in June, following the roadshow launch.
Most large IPOs are dominated by institutional allocations, with retail investors getting whatever is left over after the big funds have been served.
🌐 The Three Mega-IPOs
SpaceX would be the first of three potential mega-offerings in 2026. OpenAI and Anthropic, the two most prominent AI companies, are both reportedly considering IPOs before year-end.
Watch the IPO calendar to keep track of all dates you need to know.
If all three list in 2026, it would represent an extraordinary concentration of market-defining (who said market-tanking?) companies entering public markets in a single year.
🎯 The Outlook
If the prospectus drops in late May, the details to look into are the Starlink revenue trajectory, which represents the most scalable part of the business, the financial structure of the xAI integration, and how the company accounts for its government contracts, which include substantial NASA and Department of Defense relationships.
The risk factors section, which every prospectus contains and most investors skip, will also be worth reading in this case.
A company whose core business involves putting big things into orbit, competing in AI, operating a global satellite network, and being led by arguably the most polarizing CEO on the planet has a risk factor section that will be, at minimum, interesting.
The IPO of the decade may or may not be priced at $2 trillion. But it will definitely be worth paying attention to.
Off to you : How do you see the IPO drop? A massive pump or a massive dump? And are you looking to snag some shares?
BTC Structure at Decision Point Hold $60K or Correct to $34KPrice is currently pulling back into a key horizontal level (Support & Resistance Block) which previously acted as a strong resistance, rejecting price on multiple occasions before the eventual breakout. That breakout flipped the level into support, and the current retest is a critical validation of its strength.
So far, price is showing a reaction (bounce) off this zone, indicating buyers are still defending it. This makes the current structure a potential classic breakout–retest scenario, where holding above the level keeps the broader bullish structure intact.
If this bounce gains strength and price pushes through the resistance block around 78K–98K, it would confirm continuation and open the path for a larger upside expansion with projected target pointing towards $300k.
However, if price fails to build momentum off this support and faces rejection from the resistance block, it will indicate structural weakness, opening the door for a deeper correction toward the $34K region, aligning with a typical rising wedge breakdown target.
At this stage, the market remains at a decision point, and the reaction from this support will determine whether price continues higher or transitions into a broader pullback. We are currently positioned long from around $65K, with risk already secured (stop above entry), and will continue to hold until price invalidates the setup.
Key level to watch remains $78K a clean break above this zone should trigger strong upside momentum expansion.

BTCUSD: We are exactly halfway through the Bear Cycle.Bitcoin remains extremely bearish on its 1W technical outlook (RSI = 36.027, MACD = -9332.300, ADX = 26.249) despite the consolidation of the past 2 months. One would assume that would make the market neutral but being in a Bear Cycle, this consolidation is simply an accumulation period for sellers. This week also marked the price completing its first half according to the 1-year duration model of the previous two. Even the 2014 Cycle which was 2 months longer, displayed similar behavior. A consolidation period before the half and then strong decline in the 2nd half.
The 1W MA200 didn't support last Cycle even though it did the two before that, so it is highly likely to break. Whatever the circumstances, this highly accurate model tells us when we should start getting ready to buy again for the long term (and that would be close to October 2026) and not particularly the exact price. And being halfway through a Bear Cycle, is never an optimal time to buy.
## If you like our free content follow our profile to get more daily ideas. ##
## Comments and likes are greatly appreciated. ##

EUR/USD testing AB=CD resistancesFrom the daily chart of the EUR/USD, the pair gained traction today amid a broad-based USD sell-off following the recent US-Iran ceasefire.
Technically, the unit is now shaking hands with a resistance zone between US$1.1734 and US$1.1690 – a base made up of a 1.272% Fibonacci projection and a 100% projection (AB=CD resistance levels). Complementing this area is an ascending resistance, taken from the low of US$1.1468.
Current AB=CD sellers will likely target the 38.2% and 61.8% Fibonacci retracements at US$1.1596 and US$1.1527, respectively, derived from legs A-D of the larger AB=CD pattern.
Written by FP Markets Chief Market Analyst Aaron Hill

GOLD: Bulls Denied at the Ceiling! Target $4,640 in SightGold's recent recovery has slammed into a massive wall of institutional supply. On the 2-hour chart, the technical confluence is screaming "rejection," and history looks ready to repeat itself.
The Macro Context: The Great Compression 🛰️
Since the mid-March volatility, Gold has been coiling within a massive Triangle Pattern. We are now approaching the terminal point of this multi-week structure, and the technical tension is peaking.
The Setup: A Classic "Bull Trap" 🧩
Local Breakout: We saw a clean exit from the local Triangle Pattern (micro), which initially baited many into thinking a moonshot was starting.
The Resistance Wall: That move ran straight into the descending Macro Resistance Line and a heavy Sell Area (red box) near $4,840.
Rejection Confirmed: The swift price rejection at this confluence suggests that big players are using this liquidity to fill short orders.
The Roadmap: Destination Support 🎯
As indicated by the black "zig-zag" projection, the path of least resistance has shifted back to the downside:
Immediate Support: Watch the $4,760 level (the previous breakout point).
Main Objective: A full slide back to the macro triangle floor around $4,640.
Invalidation: A clean daily close above the red supply zone ($4,860) would invalidate this bearish setup.

A Simple Way to Identify Market Structure
Market structure is the sequence of price movements expressed through highs and lows, which allows you to determine the current direction of the market and its underlying logic.
Simply put:
Market structure is the “skeleton” of the chart that shows where the market is moving and who is in control — buyers or sellers.
How Market Structure Is Formed
A downtrend structure is a sequence of lower highs and lower lows.
An uptrend structure is a sequence of higher highs and higher lows.
However, in reality, charts rarely look this clean. Trying to map structure on a live market often results in something like this:
Internal and External Structure
To make the chart clear and analyzable, it is important to distinguish between external and internal structure.
External structure forms the sequence of higher highs and higher lows, or lower highs and lower lows, that we use to analyze the trend.
Internal structure refers to the movements within the external structure — essentially, corrections within the trend.
To mark the external structure on the chart, identify a clearly defined swing. In our example, this is the move highlighted by the blue rectangle:
The upper and lower boundaries of the rectangle define the range of the external structure:
Everything inside the boundaries is internal structure (a correction).
Everything that breaks beyond the boundaries is external structure (a new impulse wave).
Where I drew the red line, price updated the external structure:
If we wanted to map the external structure, it would look like this:
Next, we shift our rectangle to the move that updated the external structure.
We then extend it and observe where price breaks the boundary of this rectangle.
Since price is in a downtrend and the break occurs in the direction of continuation (price breaks the lower boundary), this is a BOS. In other words, BOS is a move that confirms trend continuation. For a downtrend, it is the break of a key low; for an uptrend, it is the break of a key high.
At this stage, we can already draw the external structure like this:
Next, we repeat the same technique by shifting the rectangle (from the correction high to the break of the previous structure’s low):
At this point, our structure looks like this. Agree, it now closely resembles the clean example we saw at the beginning:
From here, we continue applying the same logic until the structure is fully mapped:
An Important Detail
One aspect that may cause confusion is identifying a confirmed external swing. If the chart looks like this:
We would define the external structure like this:
We would not mark it like this:
Because we do not yet know whether the break will occur to the upside or downside. As long as price remains within the rectangle, it is in a local range relative to the overall trend.
We determine trend continuation or reversal based on the external structure.
BOS and MSS
In market structure analysis, two key concepts are Break of Structure (BOS) and Market Structure Shift (MSS).
BOS is a break of structure in the direction of the trend, confirming its continuation.
What it looks like:
In an uptrend, price breaks the previous high (Higher High), which for us is a break of the upper boundary of the rectangle.
In a downtrend, price breaks the previous low (Lower Low), which for us is a break of the lower boundary of the rectangle.
In other words, the market does exactly what it is supposed to do — it continues moving in the current direction.
MSS is a structural break that signals a potential trend reversal.
What it looks like:
In an uptrend, price breaks the last Higher Low to the downside, meaning it breaks the lower boundary of the rectangle.
In a downtrend, price breaks the last Lower High to the upside.
Try applying this on your charts — after a few attempts, you will realize how logical and simple it really is.
If this post gets 150 🚀, in the next one we will break down how to filter false signals and identify a confirmed trend reversal.

Litecoin | Logics Say One Thing But Market Structure Say OtherLTC is in a very interesting situation similar to 2022, where the political situation and tensions were similar or even lighter compared to current one but the psychological impact on traders showed that we had a quick dip and recovery before a bigger downside momentum here.
So maybe we will see a similar movement this time? LTC to $20 would be a mad fire sale
More in-depth info is in the video—enjoy!
Swallow Academy

Oil Crash + Softer USD | Ceasefire Sparks Risk-On NASDAQ Rally!Hey Traders, in today’s trading session we are monitoring NASDAQ for a buying opportunity around the 24,600 zone. NASDAQ was previously trading in a downtrend and has now successfully broken out of that structure. Currently, price is in a correction phase and is approaching the retracement area near the 24,600 support and resistance zone.
From a macro perspective, this setup is supported by a major shift in global risk sentiment after a two-week ceasefire was officially reached between the US and Iran, including the reopening of the Strait of Hormuz. This is the best short-term outcome markets could have priced, as it removes the immediate worst-case scenario of a prolonged energy supply shock. As a result, oil prices have sharply dropped below $100 while global equities are rallying on relief flows, creating a highly supportive backdrop for US indices and especially growth-heavy tech stocks.
The NASDAQ is particularly sensitive to this macro pivot because lower oil prices help reduce inflation fears, which in turn eases pressure on bond yields and improves the valuation environment for technology stocks. At the same time, the US dollar has come under downside pressure as safe-haven demand fades, reinforcing the risk-on environment that tends to favor equities for the rest of the week.
Technically, the 24,600 retracement zone becomes a high-probability buy area, combining the breakout retest structure with a powerful bullish macro catalyst. If buyers defend this level, NASDAQ could continue its upside expansion toward fresh weekly highs as the market keeps repricing the ceasefire as a short-term growth-positive event.
The key idea here is simple: peace headlines + lower oil + softer USD = bullish equities, which keeps the buy-the-dip narrative very strong for NASDAQ into the next sessions.
Trade safe,
Joe

GC: Holding the Line After a Historic UnwindMacro Crosscurrents Driving Gold’s Volatility
Reaching a meaningful milestone in any ongoing market coverage often coincides with periods of reflection, and the current backdrop in gold provides exactly that. The macro landscape surrounding Gold Futures has been anything but stable, offering a fitting environment to examine both past developments and what may lie ahead.
Gold’s surge into early 2026 was driven by a convergence of macro forces rather than a single catalyst. In January, expectations around monetary policy shifted notably after Federal Reserve officials signaled a slower pace of rate cuts than markets had anticipated late in 2025. At the same time, real yields remained volatile, which historically has had an inverse relationship with gold.
Geopolitical tensions also played a significant role. The ongoing instability tied to the Iran-Israel conflict escalation in 2026, contributed to safe haven demand, particularly during periods of heightened rhetoric and reported disruptions in regional security conditions. These developments supported flows into precious metals broadly, including silver and platinum.
Another key driver has been persistent central bank demand. Data released through late 2025 and reaffirmed in early 2026 showed continued accumulation of gold reserves by major economies, notably China and India, reinforcing a structural bid underneath the market.
This constructive backdrop began to shift in the first half of March. Gold’s sharp selloff during this period was driven by a repricing in macro expectations rather than a single catalyst. A more hawkish stance from the Federal Reserve, reinforced by firmer inflation data and an energy driven surge in oil prices tied to escalating Middle East tensions, pushed real yields and the US dollar higher. As markets moved toward a higher for longer rate outlook, the opportunity cost of holding gold increased, triggering a broad liquidation of previously crowded long positioning and accelerating the move lower.
What the Market Has Done
In January, gold made a hyperbolic move higher, establishing new all time highs as momentum accelerated on the back of macro uncertainty and strong inflows.
On January 29, the market spiked to print an all time high at 5658.6, but the following session on January 30 saw a large and volatile move lower that swept through the prior seven days of upside, reaching down into the 4500 area, aligning with the 7 January HVN, where buyers responded.
Through February, buyers steadily bid price back toward the highs, but encountered responsive sellers around the 5450 area, marking Daily level 1.
The inability for buyers to revisit all time highs resulted in rotation lower toward the 5000 area, corresponding with the February VAL, where buyers stepped in and defended, leading to two way trade and value establishment.
In the third week of March, buyers lost control as the market broke below value and expanded lower with increasing volatility, driven by long liquidation and fresh short participation.
Price moved through the prior four month range (from November through February) and tagged the November value area, where responsive buyers stepped in aggressively, leading to a rejection higher.
More recently, buyers have stepped up bids and attempted to re-establish upward momentum but have encountered responsive sellers around the 4800 area, aligning with the March LVA.
What to Expect in the Coming Weeks
The Key levels to watch remain 4800 and 4580, which define the current balance area.
Neutral Scenario
Without pace and volume at the edges of the 4800 and 4580 range, expect continued two way rotation as the market works to establish value.
This environment could be driven by a lack of new macro catalysts, with markets awaiting clarity from upcoming Federal Reserve communications or key inflation prints.
Bullish Scenario
If bids begin to step up within the 4800 and 4580 range, this would be the first indication that the bullish scenario is developing.
A break and acceptance above 4800 opens the path toward the 5000 area, which aligns with March LVA 1 and February VAL.
Expect responsive sellers in that region. If sellers fail to contain price, continuation through the offer block could target 5215, the March VPOC.
A potential macro trigger could include a dovish shift from the Federal Reserve or renewed geopolitical escalation that drives safe haven flows.
Bearish Scenario
If sellers step down offers within the 4800 and 4580 range and begin to compress price toward 4580, it would signal increasing downside pressure.
A failure of buyers to hold bids at 4580, followed by a break and acceptance below, opens the door to a move toward 4360, corresponding with Daily level 3.
If responsive buyers fail to appear there, continuation lower toward 4130, the January 23 spike low, becomes likely.
This scenario could be triggered by rising real yields, stronger than expected economic data, or a de-escalation in geopolitical tensions reducing safe haven demand.
Conclusion
Gold remains in a defined balance following a period of extreme volatility, with price now compressing between well established levels as both buyers and sellers continue to respond at the edges. The broader macro backdrop continues to play a decisive role, particularly through shifts in interest rate expectations, real yields, and the evolution of geopolitical risks.
The transition from a momentum driven rally in January to a liquidation led selloff in March highlights how quickly sentiment can change when macro conditions reprice. While structural demand such as central bank buying remains supportive, shorter term direction will likely depend on whether markets lean back toward easing expectations or further entrench a higher for longer rate environment.
From a technical perspective, the current range between 4800 and 4580 remains key. Acceptance outside of this area will likely dictate the next meaningful move, with upside targeting a return toward prior value and downside opening the door to deeper retracement levels outlined above.
As price continues to develop within this range, will gold resolve higher as buyers regain control, or does the recent shift in macro narrative have further to run?
This piece also marks a milestone as our 100th article. A sincere thank you goes out to the readers and traders who have followed along, engaged with the analysis, and contributed to the broader discussion around market structure and macro driven price action. Each phase of the market offers new lessons, and sharing that process continues to be a rewarding part of the journey.
Disclaimer: This is not financial advice. Analysis is for educational purposes only; trade your own plan and manage risk.
Acronyms:
C - Composite
w - Weekly
m - Monthly
VA - Value Area
VAH - Value Area High
VAL - Value Area Low
VPOC - Volume Point of Control
LVN - Low Value Node
LVA - Low Value Area
HVN - High Value Node
HVA - High Value Area
SP - Single print
ATH - All time high

The 2025 TradingView Community Awards Are OfficialThe markets were loud in 2025.
Throughout the year, the TradingView community shared ideas, challenged narratives, built tools, and kept discussions moving forward.
Let us show you what we mean by that.
📊 2025 by the Numbers
Last year, the community delivered at scale.
Authors
✔️ Public ideas published: 383,555
✔️ Public scripts published: 61,119
✔️ Public chat messages: 5,501,741
✔️ Minds posted: 850,036
Opinions
✔️ Comments on ideas: 616,107
✔️ Comments on Minds: 818,339
Editors’ Picks
✔️ Ideas selected: 765
✔️ Scripts selected: 136
✔️ Total rewards paid: $68,300
Millions of charts, opinions, debates, code snippets, and insights filled the platform throughout the year.
🏆 The 2025 Winners
Drumroll please 🥁
These ideas, educators, scripts, and posts stood out in 2025.
🚀 Most Boosted Ideas
These ideas earned the strongest community support through boosts.
Comprehensive Bitcoin Analysis for 2025 by @tradecitypro
BITCOIN Breaks Higher. Is $106K the Next Target? by @DanielM
Dead Bitcoin Soon Will Break 92K Support. Bye 100K and Hi 80K by @MMBTtrader
🎬 Most Boosted Video Ideas
These video ideas captured attention and momentum.
CM. The Best Method I’ve Found for Finding Stocks That Move by @ChrisMoody
Trading BTC With a Solid Plan Is Crucial for Success. Here’s Mine by @fxtraderanthony
Gold Long Again. Completion of Double Combination by @yuchaosng
📚 Most Boosted Educators
Clear explanations and structured thinking defined these educational ideas.
Indicator Design 101 by @ChartPrime
Chart Patterns. How to Read Them Like a Pro by @Louigi_24
How Whales Manipulate Markets. A Trader’s Guide to Succeed by @TheWhaleSM
💬 Most Commented Ideas
These ideas sparked some of the most active discussions of the year.
TESLA. It’s Not Only EV Cars. Elon Musk Predicting 1000% Growth by @David_Perk
BTC Is in the Final Trap Before the Crash. Wyckoff Phase C by @EXCAVO
Gold bulls take control as geopolitical risk take center stage! by @Blueberry
🎥 Most Commented Video Ideas
These videos turned comment sections into full discussions.
MOASS. WC 26.90 Target 1800 to 2400. MOASS 47K to 100K by @Heartbeat_Trading
Gold Set for a Big Move. Key Zones and CPI Impact Explained by @ArmanShabanTrading
TSLA in Big Trouble by @ThinkFastTrades
🎓 Most Commented Education Ideas
Educational content that encouraged questions, debate, and deeper understanding.
Fibonacci Retracement. Quick Guide in Five Steps by @King_BennyBag
The Ultimate Guide to Smart Money Reversals by @TehThomas
Mastering Fair Value Gaps. How to Use Them in Trading by @Youriverse
🧠 Users With the Most Minds Posted
Consistent contribution stood at the center of these profiles.
Broketothebone with 3,974 Minds
masonstocks with 2,614 Minds
beyond50 with 2,520 Minds
🧠 Most Upvoted Minds Posts
Community humor and self awareness resonated strongly this year.
I think the gold price depends on me. If I buy it falls. If I sell it rises. by @Goldsniper888
If I get 25 likes in this post I will divorce my wife and dedicate my life just to day trade. by @TheTradingProdigy
When I buy it goes down. When I sell it goes up. by @arshadalitmk
⚙️ Most Boosted Public Pine Scripts
These scripts gained widespread adoption across the platform.
Smart Money Breakout Channels by @AlgoAlpha
Support and Resistance Power Channel by @ChartPrime
Dynamic Swing Anchored VWAP by @Zeiierman
💬 Most Commented Public Pine Scripts
These scripts generated thoughtful discussion and feedback.
Smart Money Concepts Advanced by @robbatt
High Volume Points by @BigBeluga
Wyckoff Event Detection by @AlphaExtract
🏅 Best Editors’ Picks 2025
Indicators
Footprint IQ Pro by @Trading-IQ
Multi Asset Similarity Matrix by @RicardoSantos
SIP Evaluator and Screener by @Trendoscope
Libraries
LogNormal by @liquid-trader
Timezone by @n00btraders
pymath by @kaigouthro
📌 Things to Know
All numbers presented are for our Global English site
Each winner is eligible to receive a single award
All winners receive one year of Ultimate
Existing subscriptions convert remaining time into Ultimate
The Editorial team reviewed and finalized all Top 3 selections
Winners with a permanent ban will not be rewarded
Results are final and not subject to discussion
Prizes will be assigned before the end of April
🚀 Final Thoughts
Trading thrives through shared insight and open discussion. The 2025 winners shaped conversations, refined ideas, and raised the quality of content across TradingView. But it wasn’t just them.
Thank you to everyone who contributed this year. Here’s to a more successful, louder, and exciting 2026.

WTI Holds $100 Threshold Ahead of US-Iran DeadlineAs we enter Q2 2026, crude oil prices continue to point toward further upside risks in line with ongoing energy disruptions in the Middle East, despite headlines on potential de escalations.
From a price action perspective, crude is:
• Holding above the 2023 highs and resistance at $91–93 per barrel
• Showing a strong rejection from the $84 zone
• Persistently Closing near the $100 mark as markets enter the sixth week of the Middle East conflict, keeping the upside scenario favored at the start of the quarter
Bullish scenario
A close above 110 on WTI and 115 on Brent would extend upside projections toward the 118 yearly high and further into the 135–150 range, signaling continued disruption to energy supply, infrastructure, and alternative routing around Hormuz. Upside levels are forecasted via the Fibonacci extension tool placed between the lows of 2020, highs of 2022, and lows of 2025.
Bearish scenario
A close below 89 would extend short-term downside risks toward the 82 and 74 zones, aligning with the highs of 2025 and previous Middle East conflict levels, where support may emerge. A break below these levels could shift price action back toward the $60 zone, in line with broader policy-driven normalization.
Written by Razan Hilal, CMT

Bitcoin just broke something BIG!Good morning, traders☀️🌴
On the 4-hour chart, BTC impulsively broke the local trendline that was holding price down since mid-March.
Not only that — price also pushed above the EMA 100.
Right now, we’re seeing a pause at the EMA 200 — key level.
If this holds, I’m expecting a move toward 70,300.
And once we get there, the reaction will tell us everything about the next target — 72,000.
Downside levels are marked, but as long as price stays above the broken trendline…
The bias remains bullish.
⚠️ Disclaimer:
All information shared on this channel is for educational and informational purposes only and is not investment advice. The author is not responsible for your trading decisions. Always manage your risks and make decisions independently.

Why Your Best-Laid Plan Falls Apart the Moment Markets Get ScaryYou built the plan on a quiet Sunday evening. Entry, stop loss, take profit, position size.
You identified support levels, the price zones where buyers have historically stepped in to halt a decline. You noted resistance, the ceiling where sellers tend to show up.
The setup was clean, logical, and backtested. By Monday morning, gold OANDA:XAUUSD was out and about whipsawing and crushing your best-laid plan.
That’s trading in a stressed market. It’s where the rules exist, but they don’t apply.
🏚️ What Markets and Societies Have in Common
Think about what happens to a city under genuine stress. A storm, a blackout, a crisis of some kind. The ordinary rhythms disappear. Shops that open at nine suddenly close at noon.
Social contracts that hold effortlessly in calm conditions require active enforcement when fear enters the picture. The usual patterns of daily life do not vanish permanently. They suspend, because survival instinct has temporarily overridden routine.
Markets behave the same way. And it’s true in just about every asset. But especially true in the crowded trades where stocks can flicker deep in green and then switch the color to deep red. We’ve got the stock heatmap for that.
In normal conditions, technical levels tend to work because enough participants believe in them and act accordingly. Support tends to hold because traders expect it to hold and buy there.
Resistance caps rallies because traders expect it to cap and sell there. The pattern is partly self-fulfilling. It works because enough people are playing by the same rulebook, watching for the same chart patterns .
When genuine fear enters a market, the rulebook goes in the drawer. Participants shift from optimizing returns to preserving capital. Institutions reduce exposure regardless of price.
Forced sellers, traders or funds liquidating positions to meet margin calls, meaning demands from brokers to deposit more cash when losses mount, sell at whatever price is available. The buyers who would normally show up at support are either absent or overwhelmed. Levels that held for months give way in an afternoon.
🪙 Gold's Whipsawing as a Case Study
Gold's recent behavior is a clean illustration of a stressed asset doing stressed-asset things. The metal had surged hundreds of dollars before the Iran conflict escalated, trading above $5,000. War, uncertainty, inflation risk: gold is supposed to benefit from all three.
Then it dropped more than $400 in a few hours, crashing through the support level that had held for days.
The support zone did not hold. The safe haven narrative inverted. Traders sold gold to raise cash, the dollar strengthened , and a level that looked like a floor became, briefly, just a number the price passed through on the way south.
In other words, the normal relationship between gold and fear broke because the players in the market were no longer behaving normally. They were in survival mode, liquidating whatever was liquid, and gold, one of the most liquid assets on the planet, was an obvious source of cash.
📐 What This Means for Your Technical Levels
Support and resistance are not laws. They are observations about where buyers and sellers have historically shown up under ordinary conditions.
When conditions stop being ordinary, those observations lose predictive power, sometimes temporarily, sometimes for an extended period.
Chart patterns that historically resolved in a predictable direction start resolving differently, or not at all, because the participants driving those patterns are focused on something other than the pattern.
The practical implication is that in high-stress, high-volatility environments, the confidence you place in any given technical level should fall alongside the reliability of the conditions that created it.
A support level formed during a calm trending market is a different animal from that same level sitting in the middle of a geopolitical shock.
⚙️ What to Do With an Unreliable Map
The answer is not to abandon technical analysis. It is to adjust position sizing sharply downward, widen stops to reflect the reality that normal volatility ranges have expanded, and accept that more trades will stop out before the thesis plays out. Or, you can play it safe, sit it out , and wait for conditions to normalize.
They usually do. Stressed markets return to recognizable behaviour once the acute fear passes and participants shift back from survival mode to strategy mode. The levels, the patterns, the rulebook, it all comes back.
Until then, trade smaller, expect less precision, and give your plan enough room to breathe in conditions that are anything but normal.
Off to you : How do you adjust your strategy in uncertain times? Share your perspective in the comments!

Falling towards Fib confluence?EUR/USD is falling towards the support level, which is a pullback support that aligns with the 78.6% Fibonacci retracement, 145% Fibonacci extension, 61.8% Fibonacci projection, and could bounce from this level to our take profit.
Entry: 1.1487
Why we like it:
There is a pullback support level that aligns with the 78.6% Fibonacci retracement, 145% Fibonacci extension and the 61.8% Fibonacci projection.
Stop loss: 1.1451
Why we like it:
There is a pullback support level that aligns with the 100% Fibonacci projection.
Take profit; 1.1551
Why we like it:
There is a pullback resistance.
Enjoying your TradingView experience? Review us!
Please be advised that the information presented on TradingView is provided to Vantage (‘Vantage Global Limited’, ‘we’) by a third-party provider (‘Everest Fortune Group’). Please be reminded that you are solely responsible for the trading decisions on your account. There is a very high degree of risk involved in trading. Any information and/or content is intended entirely for research, educational and informational purposes only and does not constitute investment or consultation advice or investment strategy. The information is not tailored to the investment needs of any specific person and therefore does not involve a consideration of any of the investment objectives, financial situation or needs of any viewer that may receive it. Kindly also note that past performance is not a reliable indicator of future results. Actual results may differ materially from those anticipated in forward-looking or past performance statements. We assume no liability as to the accuracy or completeness of any of the information and/or content provided herein and the Company cannot be held responsible for any omission, mistake nor for any loss or damage including without limitation to any loss of profit which may arise from reliance on any information supplied by Everest Fortune Group.

Lightning Strikes Twice: A Pattern Predicting the Crypto BottomWhat Is This Chart?
The (BTC.D + ETH.D) / (USDT.D + USDC.D) ratio is one of the more elegant macro tools in the crypto analyst's toolkit. By dividing the combined dominance of Bitcoin and Ethereum against the combined dominance of the two largest stablecoins, the chart strips away price noise and reveals something more fundamental: the direction of liquidity flow. When the ratio falls, money is rotating out of the two blue-chip crypto assets and sheltering in stablecoins — a classic hallmark of risk-off sentiment and bear market conditions. When it bottoms and reverses, it has historically marked the point at which that fear reaches exhaustion, and a new bull cycle begins.
The 2020–2022 Cycle: A Five-Step Roadmap to the Bottom
Between mid-2020 and early 2023, this ratio carved out a remarkably structured topping and capitulation pattern that, in hindsight, served as a precise roadmap for the bear market's lifecycle. The pattern unfolded in five distinct steps:
Step 1–3: Three Rejections from the 50-Week EMA. As the ratio peaked in 2020 and began its decline, it made three separate attempts to reclaim its 50-week Exponential Moving Average — each one failing. Rejection 1 came in early 2020, Rejection 2 in early 2021, and Rejection 3 around mid-2022. Each rejection confirmed that the prevailing trend was down, and that liquidity was continuing its steady migration from BTC and ETH toward the safety of stablecoins. The 50-week EMA acted not as support, but as a ceiling — a recurring reminder that the bear market remained firmly in control.
Step 4: The Thunder Crash Into a Wick. Following the third rejection, the ratio entered its most dramatic phase — a sharp, accelerated decline that crashed directly into a large red weekly wick. This "thunder crash" represented a moment of peak fear and maximum outflow from blue-chips into stablecoins. Violent, fast, and accompanied by significant market-wide capitulation events, it created a long lower wick on the weekly chart — a technical signature suggesting that while sellers were briefly overwhelming buyers, the move was becoming exhausted.
Step 5: The Final Breakdown and Bottom. Rather than reversing immediately from that wick, the ratio staged one final breakdown below it — a last flush of capitulation liquidity that represented the true exhaustion of sellers. This move brought the ratio to its cycle bottom, and from there, the reversal began. Blue-chip dominance began reclaiming ground from stablecoins, signalling the quiet start of the next accumulation phase and, eventually, a new bull market.
2024–2026: The Same Pattern, Four Years Later
What makes the current setup so striking is how faithfully the ratio appears to be rhyming with the 2020–2022 sequence — almost to the calendar quarter.
Three rejections from the 50-week EMA have already printed: Rejection 1 in mid-2024, Rejection 2 in late 2024, and Rejection 3 in early 2025. Each has played out with the same character as its predecessor cycle — a brief test of the moving average, a firm denial, and a continuation lower.
Step 4 has now also printed. The thunder crash into a major red weekly wick arrived, and the ratio currently sits approximately 9% above that wick at around the 6% level — in the same structural position the 2022 setup occupied before its final capitulation leg.
What Comes Next: The Final Flush
If the pattern completes as it did in the prior cycle, the fifth and final step remains: a breakdown below the wick, representing the last wave of blue-chip-to-stablecoin rotation before the trend exhausts itself entirely.
Based on the prior cycle's proportionality and the current wick structure, a move from the current ~6% level down to approximately 3.7% would constitute this final capitulation. Given the pace at which steps 1 through 4 have unfolded, this move could reasonably materialise within the next 12 weeks — a tight but plausible window if the pattern continues to track its 2022 predecessor.
A confirmation of that bottom — particularly a weekly close back above the wick low — would, by this framework, signal that the liquidity flight from Bitcoin and Ethereum into stablecoins has run its course. Historically, that has been the starting gun for the next bull market, not its announcement, but its quiet and overlooked beginning.
A Note on Pattern Trading
No pattern repeats perfectly, and macro conditions — including regulatory shifts, ETF flows, and broader risk appetite — differ between cycles. This ratio is a sentiment and flow indicator, not a crystal ball. But as a structural framework for identifying bear market exhaustion, the 2020–2022 five-step sequence earned its credibility. If it completes again in 2025–2026, the bottom may already be closer than it feels.
Chart analysis based on the weekly (BTC.D+ETH.D)/(USDT.D+USDC.D) ratio on TradingView. Not financial advice.

Trading the Stars: A $5,410 Walk-Forward SPY Case StudyWell, never in a million years would I expect to be having this conversation.
If you have followed me, you know I am all about math, statistics and science. I tend to brush of "technical analysis" and roll my eyes at things like EWT. And not because I assume they don't work, but because I have tried them and they failed me.
Well, market astrology was one thing I did more than roll my eyes at and turn my back to, and unlike the other strategies it wasn't because I had tried it. It stemmed purely from thinking anything to do with astrology was bogus and nonsense and personal bias. (Bias is the enemy in the market, especially when it erodes into your strategy!!).
I have been trading since 2018, applying multiple different strategies. Profitability for me came with the transition to math and statistics for trading, which I transitioned to around end of 2019, early 2020 (That's right, almost 3 years of doing this whole nonsense losing money constantly!). And here we are, in April of 2026, and I am about to talk to you about market "astrology"!
How did we get here? To be honest, I am not sure. This long weekend, I was randomly inspired to check the full moon and new moons' relationship to trading and market returns. Despite this being within the last 3 days, I can't for the life of me remember why I decided to try this, but I did and I went through with the analysis. And to my surprise, there was actually a significant relationship between price action and new / full moons.
So I did what I do and of course consulted AI to get its take, I shared my code and my findings. It told me that this is a well documented phenomenon, attributed it to the gravitational pull and how the moon effects the tides, it could for sure affect humans, etc. etc.
Okay, got it. Easy - ish pill to swallow. But then, the AI was like, try this code here. I tired it and it showed that certain circumstances the new moon actually caused a completely opposite effect. And so I asked, what I did wrong, thinking it was a coding error, and good ol' AI was like "Nah Bruh, these are the cases where Mercury is in Retrograde".
And that was where this little quantitative trader entered the forbidden realm of Astrology.
The Curiosity Spikes
Logically, my curiosity spiked even though hearing the term "Mercury in retrograde" sparks feelings of, well, nonsense. But because these findings were significant alone, I decided to play devil's advocate and add all of these celestial features to one of my larger predictive models that, at the time, totaled around 94 features, from fundamentals to technicals. I added all celestial features, including the zodiac signs, mercury in retrograde, new moons and full moons, etc. etc.
I then ran 2 algorithms I have to filter whether these are worth keeping or completely bogus. The first is a basic decision tree importance test, which iterates through all features and decides which ones it wants to keep because it adds substantial predictive power and which ones it wants to discard. In this case, I used Random Forest.
The next, I iterated through a similar one, but using regression. This tells me, if there is significance and it adds predictive power, what is the actual relationship to the data (i.e. does it have a positive or negative correlation).
And in those 94 and, after these additions over 100 features, wouldn't you know it, both regression and my tree based algorithm prioritized many astrological features in the top 20 most important features for predicting market behaviour.
I hope you are just as shook as I was when I looked at the screen. And just to be transparent, here are the results:
Take a look at the chart. You will see how the astrological features can hold their weight against heavy hitters like VIX, VWAP and Volatility features.
This table shows the predictive power of these features in relation to predicted the daily high price and the daily low price.
Honestly, having the conversation even a week ago, I would have been like "You're NUTS!". But alas, data doesn't lie.
And I being someone who is visual, needed to really see this. So I went ahead and coded a quick python script to plot this out:
This is 5 years of SPX data with the zodiac signs aligned and the Mercury in retrograde plotted in those red bands.
Looking at the chart, you will see right away that mercury in retrograde tends to lead to a major pivot. After retrograde, the stock tends to flip its direction for the majority of the time before the next retrograde.
And if you look closely (which will likely be hard to visualize from the image, so I will share the table below), you can see very clearly certain zodiac signs aligning with very clear sentiments.
Here is the table that outlines that:
So now the next thing, because this is all about viable strategy, is can we make this into an actual successful strategy?
And shockingly, yes. Yes we can.
The strategy is actually fairly simple. For SPX, we long the bullish zodiac signs and short the bearish signs. We hold our position right to the very end of the zodiac phase, and we set a 2% stop loss.
Here are the results:
This is with a 2% stop loss. If we tighten our stop to 1%, here are the results:
Even better!
You can theoretically optimize the strategy further by omitting the periods that have low win rates, such as Gemini which carries a lower 39% win rate.
And it gets even funnier:
The win rate on the astrology strategy is higher than any conventional technical strategy, such as RSI, Stoch or MFI. Though, its only a tad bit higher than stochastic.
Applying the Strategy
So, you want to try the strategy? You would need to calculate the average return for your ticker based on the celestial zodiac phases, if you wanted to follow the strategy exactly.
Currently, unless you can code python, there is no default indicator to do this, you would have to do it manually. However, in researching and doing this analysis, I have created one:
Which I will release in the coming days following this article, so you can apply it yourself.
You can even augment the strategy further by combining stochastics or RSI. Since stochastics has a relatively close win rate, combining the 2 dramatically increases your win rate.
In fact, I ran this in Python and the result was 18.571.79$ over 2 years with a win rate of 66.67%.
The parameters for this strategy?
Simple, before we long a bullish zodiac phase, we only long it if Stochastic is <= 20.
Before we short a bearish zodiac phase, we only short it if stoch is >= 80.
In both cases, we hold for the entire duration of the zodiac phase, which is really what augments your profits in this strategy.
Explanations
So, if you're like me, you're probably asking.. "how"? How is this a thing? And to be truthful, its impossible to know what comes first, the chicken or the egg. Initially, I chalked it up to just seasonality. However, when I compared the performance of my seasonality features, which have forever been a huge hallmark in my models, my seasonality features lifted my model prediction by only 6%. The astrology lifted the accuracy by a whopping 32%!!!! Meaning, the astrology features outperform traditional seasonality.
Make it make sense.
But there are other hypothesized rationales to the effect of astrological on the market, namely:
The influence of gravitational pulls on human behavior.
In certain zodiac phases, there is changes in the magnetic fields caused by the sun. This has been known to change behavior and increase anxiety and risk averse behavior in animals and humans.
More granular seasonality. Seasonality as we know it comes by month. However, zodiac phases and retrograde create more granular seasonal periods, that are sometimes shorter than full months and other times overlap into existing months. This can create a more zoomed in look at seasonal trends.
Conclusion
And that's it.
Wild idea, right?
And who would of thought you would have heard it from me!
Anyway, that's all for now! Hope you learned something and enjoyed.
Take care and as always, safe trades!

SILVER TECHNICAL POSITION: TRENDING HIGHERIn my previous Silver analysis, I expected price to move lower, with the downtrend line acting as resistance and generating a sell opportunity, which it did.
After that move, price reached the primary uptrend line, found support, and broke the downtrend line with an upside imbalance. It then retested that downtrend line from above, generating good upside separation.
Additionally, when the previous low was breached to the downside, the market could not close below it. Instead, it closed back above it with strong upside movement.
All of this leads me to conclude that this market is in a technical position to move higher in the coming days, and I see no reason to look for shorts at the moment.

USAR: When American magnets beat the Chinese monopolyUSA Rare Earth is building a plant in Oklahoma and owns rights to a deposit in Texas so the Pentagon stops buying rare earth magnets from China. The company went public on NASDAQ in 2024, and now everyone who follows the sector understands: rare earths are no longer about science, but about defense, tariffs, and national security.
Fundamentals
On April 2, 2026, the US imposed a 25% tariff on finished magnets and 10% on oxides. China controls 90% of the global market. This is a direct demand transfer from Chinese exporters to USAR.
The same day, the company launched the first phase of commercial production in Stillwater. Customer deliveries will begin in Q2 2026.
On March 31, a distribution agreement was signed with Arnold Magnetic Technologies. The 130-year-old company with defense and aerospace clients will sell USAR magnets through its channels.
On March 5, the deal to buy 100% of the Round Top project in Texas was closed for $73 million in stock. This is one of the largest sources of heavy rare earth metals in the US.
Balance sheet: over $400 million in cash (as of November 2025). In January 2026, the company raised $1.5 billion through a PIPE round. Another $1.6 billion is expected from the US Department of Commerce under the CHIPS Program.
Risks: the company is unprofitable (net loss for Q3 2025 was $156.7 million, including $142.4 million in non-cash items). Tariffs could be reversed with a change in administration.
Technical analysis
On the 3-day chart, price is entering the 16–17 zone. This is the golden pocket, marked on the chart as a possible OTE entry zone.
Strong diagonal support, drawn from spring 2025, is clearly marked. Price has bounced off it multiple times.
Current price: $15.92. Support at 14.07 and 12.10. Resistance at 16.33, then 20.30.
Volume on April 2: 13.2 million shares, more than double the 5–6 million average. Large players are showing interest.
Targets: first 28.24, second 32.07, main 43.98.
The market is pricing USAR on its ability to launch mass production and capitalize on tariffs. The 16–17 zone is holding, volume is high, targets are ahead.

PEPE: ready for a meme run? key levels to watch todayPEPE, ready for another meme run or just more chop? According to the market, memecoins are back in the headlines with fresh capital rotating into high beta plays, and PEPE keeps popping up in volume screens. Today price is parked right inside a big 4H demand band, while funding and sentiment cooled off a bit after the last spike – perfect spot where smart money usually reloads, not FOMOs.
On the 4H chart I see tight consolidation above the green support zone with VPVR showing a fat node right under current price and a liquidity gap toward the upper red supply. RSI is hovering around the midline, so there’s plenty of room for an impulsive move up if buyers step in. I’m leaning long from this demand area, looking for a push toward the higher red resistance where prior wicks got stuffed.
My base plan: as long as price holds above the lower green block, I expect a grind up into that red sell zone where I’ll look to scale out. If we lose the bottom of demand with momentum, then this setup is dead for me and I’ll wait for a deeper flush before touching it. I might be wrong, but in meme land the best trades often start exactly where everyone else is bored. ✅
