HTF - D1 View 
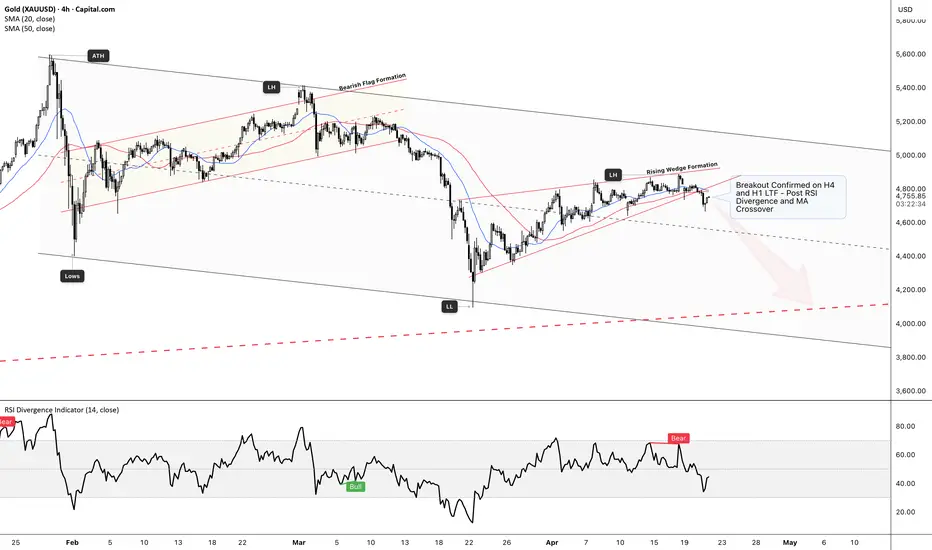
 GOLD is currently trading within a broader descending channel, respecting long-term bearish structure despite recent short-term bullish attempts.
On the left side of the chart, we saw a bearish flag formation form after the ATH, which led to continuation downside — setting the tone for the current macro bias.
Recently, price formed a rising wedge on H4, which is typically a weakening bullish structure. This wedge developed after a strong impulsive move from the lows (LL), but momentum started fading as price printed lower highs internally.
📝 Key confluences:
🔻RSI bearish divergence signaling weakening bullish momentum
🔻MA crossover suggesting a shift in short-term trend
🔻Rejection at wedge resistance + channel mid-zone
We’ve now seen a confirmed breakdown on H4, with LTF alignment (H1) supporting the move.
📉 Bias: Bearish
As long as price remains below the wedge and fails to reclaim that structure, the expectation is continuation towards:
◘ Channel support region & Long Term Support Confluence around $4200 - $4100 range
◘ Potential sweep of previous lows at $4100
📌 Any pullbacks into the broken wedge structure or moving averages could offer sell opportunities, not buys.
⚠️ Invalidation:
A strong reclaim and hold above the wedge resistance would weaken this bearish outlook.
Bottom line:
This isn’t a reversal market — it’s a corrective structure inside a larger downtrend. Treat rallies as setups, not signals of strength.
The NFX Team ™️💚
Disclaimer
The information and publications are not meant to be, and do not constitute, financial, investment, trading, or other types of advice or recommendations supplied or endorsed by TradingView. Read more in the Terms of Use.
The NFX Team ™️💚
Disclaimer
The information and publications are not meant to be, and do not constitute, financial, investment, trading, or other types of advice or recommendations supplied or endorsed by TradingView. Read more in the Terms of Use.