Fundamental and Technical Signals Align in NVDA
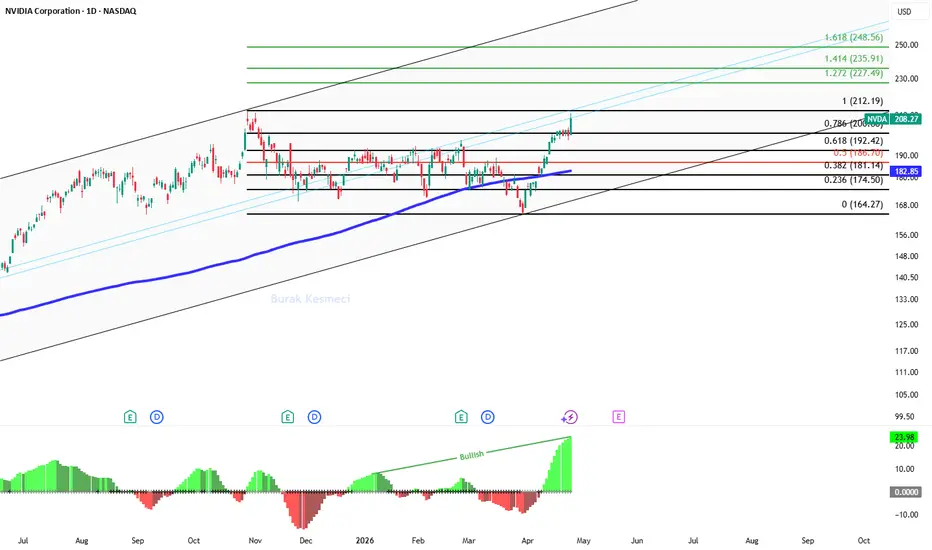
NVDA at $208.27 is displaying a rare technical-fundamental convergence with both valuation compression and squeeze momentum breakout pointing in the same direction.,
What story is the fundamental side telling?
With Wall Street analysts forecasting 73.9% earnings growth for NVDA, the current P/E ratio of 40.5 standing 2.27 times higher than the forward P/E of 17.8 indicates an expected valuation compression exceeding 50% in the coming period, and this figure presents strong repricing potential for a stock positioned significantly below the Nasdaq 100's forward P/E average of 22.4. The $5 trillion market cap company being backed by 44 analysts with a "Strong Buy" recommendation signals that institutional consensus shares this valuation compression expectation and strengthens the argument that profitability growth has not yet been fully reflected in prices.
The forward P/E remaining below the index's 5-year average of 25 reveals that NVDA is still priced in a discounted zone despite its growth story.
What signal is technical momentum giving?
With price trading 13.9% above the 200-day moving average at $182.85, the squeeze momentum indicator's jump from 0 to 23.98 shows the volatility compression breaking to the upside, and this breakout typically serves as a precursor to strong trend-directional moves. The $11.14 daily movement within the $199.81-$210.95 band (5.6% intraday volatility) signals the squeeze explosion gaining momentum, and the current price at $208.47 maintains the strength of the upward structure by positioning significantly above the 0.786 fibonacci level at $200.
Volume-wise, the 214 million lots traded exceeding the average indicates continued institutional participation, and the $181-$192 consolidation band now forming a strong support foundation reduces the pullback risk in upward price movements.
Why does this combination matter?
The valuation compression scenario supported by a 73.9% earnings growth expectation on the fundamental side, when combined with squeeze momentum breakout on the technical side, creates a rarely seen structure, and this situation forms a profile that can simultaneously attract the interest of both value and momentum investors.
The forward P/E being at 17.8 shows that even if prices rise to the $227-$235 band, assuming earnings expectations materialize, the valuation would not move into an excessively expensive zone, and this calculation draws a picture consistent with Fibonacci's upper extension targets. The squeeze momentum's "Bullish" trend signal combined with the 23.98 reading reveals that the uptrend wave starting from $164.27 maintains its acceleration potential, and the fundamental outlook supported by the consensus of 44 analysts confirms there is a strong fundamental foundation behind the technical breakout.
Which levels are critically important?
If persistence above the $212.19 resistance is achieved, both continuation of squeeze momentum and progress toward fundamental valuation targets can be expected, in which case the $227.49 and $235.91 levels could come into play as upside targets, however declines below the $200 level where the 0.786 fibonacci support breaks could signal weakening squeeze momentum, and in that scenario the $192.42 level could serve as the first test point.
On the fundamental side, if 2026 earnings figures come in lower than expected, the forward P/E rising from the 17.8 level could eliminate the valuation advantage, and in that case the 200-day moving average at $182.85 on the technical side could be expected to emerge as a critical support area.
Thanks for reading.
SPK lisanslı Midas ile ABD borsaları, BIST ve TEFAS fonlarına tek platformdan, masrafsız yatırıma başla!
app.getmidas.com/gmih/xuyw9hdp
app.getmidas.com/gmih/xuyw9hdp
Related publications
Disclaimer
The information and publications are not meant to be, and do not constitute, financial, investment, trading, or other types of advice or recommendations supplied or endorsed by TradingView. Read more in the Terms of Use.