Tesla  TSLA soared 7.6% one day last week -- its best single session in more than nine months -- and has gained some 15% in less than two weeks as the EV giant prepares to report Q1 earnings. I don't personally like when stocks run upward into earnings, but Tesla's technicals and fundamentals seem to be shaping up rather well.
Let's explore:
Tesla's Fundamental Analysis
TSLA plans to release earnings on Wednesday after the bell at a time when the stock is down some 13% year to date amid a beat-down that began in earnest in mid-December.
Wall Street expects the electric-vehicle firm's first-quarter results to show $0.36 in adjusted earnings per share on roughly $22.35 billion of revenue.
A print like that would reflect about 15.5% in year-over-year revenue growth, as well as a 33% y/y gain from the $0.27 in adjusted EPS that Tesla saw in the same period last year.
But interestingly, nine of the 26 sell-side analysts that I know to cover TSLA have lowered their earnings estimates for the period since the quarter began, while only four have raised them.
The remaining 13 analysts have made no changes. This tells me that more than a few of them don't really know what's coming.
Tesla's Technical Analysis
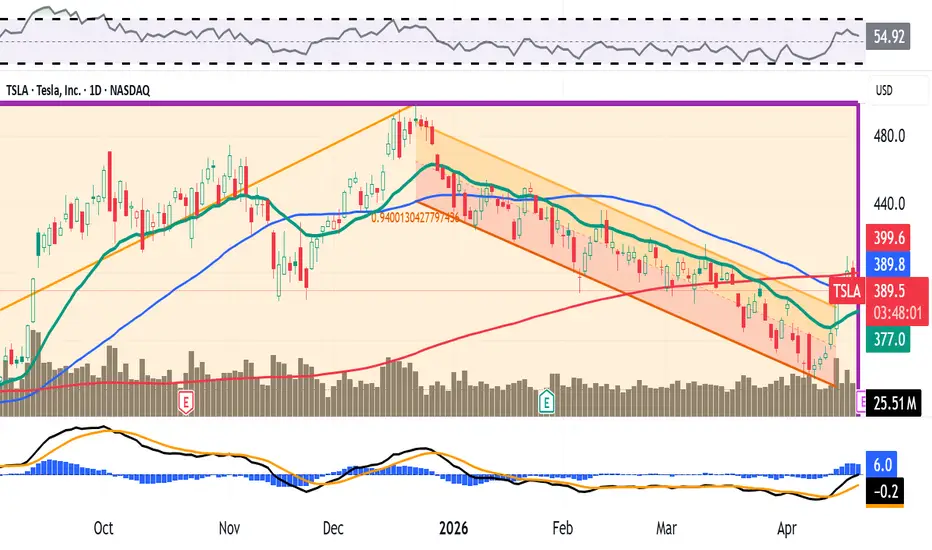
Now let's check out TSLA's chart going back some eight months and running through Thursday afternoon (April 16):

Readers will first note that TSLA saw a double-top pattern of bearish reversal this past autumn, as marked by the two red boxes at the chart's left. That pattern worked out quite well.
However, the stock has recently broken out of a downtrend, as illustrated here by a Raff Regression model (the orange-and-pink shaded area at the chart's right).
The stock has also retaken its 21-day Exponential Moving Average (or "EMA," marked with a green line), which has likely re-energized the swing crowd.
That said, Tesla has been recently butting up against resistance at its 50-day Simple Moving Average (or "SMA," marked with a blue line) and its 200-day SMA (the sloping red line) as well.
TSLA took both of them late last week, but it's not yet clear whether it can hold them. (It fell back below the 200-day SMA on Monday and the 50-day line intraday on Tuesday.)
If the stock does hold these two lines, that could cause portfolio managers with a financial interest in Tesla to consider increasing their long-side exposure in response.
Meanwhile, Tesla's Relative Strength Index (or "RSI," the gray line at the chart's top) has improved. So has its daily Moving Average Convergence Divergence indicator (or "MACD," marked by blue bars and black and gold lines at the chart's bottom).
However, neither one is postured very bullishly as of yet. Within that MACD, the histogram of the 9-day EMA (the blue bars) has moved above zero, sending short-term bullish signals.
Similarly, the 12-day EMA (the black line) has moved above the 26-day EMA (the gold line). That's bullish, but the fact that both lines remain below zero does temper that energy a bit.
An Options Option
Some option traders who are bullish on Tesla but also want to limit downside risk are probably using what's known as "bull-call" spread here.
That's where you buy one call on a stock and sell another with a higher strike price, but where both expire on the same day. Here's an example:
-- Long one TSLA call with an April 24 expiration (i.e., after earnings) at a $390 strike price (near the stock's 50-day SMA). That cost roughly $12.90 at recent prices.
-- Short one TSLA April 24 $405 call for about a $6.80 credit.
Net Debit: $6.10.
This trade risks the $6.10 net debit (the maximum theoretical loss) in an attempt to bring in $15, for a maximum theoretical profit of $8.90.
These options traders would see the $8.90 maximum theoretical profit if TSLA trades at or above $405 at expiration.
Conversely, traders would face the $6.10 maximum theoretical loss if Tesla trades at or below $390 at expiration.
(Moomoo Technologies Inc. Markets Commentator Stephen "Sarge" Guilfoyle had no position in TSLA at the time of writing this column.)
This article discusses technical analysis, other approaches, including fundamental analysis, may offer very different views. The examples provided are for illustrative purposes only and are not intended to be reflective of the results you can expect to achieve. Specific security charts used are for illustrative purposes only and are not a recommendation, offer to sell, or a solicitation of an offer to buy any security. Past investment performance does not indicate or guarantee future success. Returns will vary, and all investments carry risks, including loss of principal. This content is also not a research report and is not intended to serve as the basis for any investment decision. The information contained in this article does not purport to be a complete description of the securities, markets, or developments referred to in this material. Moomoo and its affiliates make no representation or warranty as to the article's adequacy, completeness, accuracy or timeliness for any particular purpose of the above content. Furthermore, there is no guarantee that any statements, estimates, price targets, opinions or forecasts provided herein will prove to be correct.
Options trading is risky and not appropriate for everyone. Read the Options Disclosure Document (https://j.moomoo.com/017y9J) before trading. Options are complex and you may quickly lose the entire investment. Customers should consider their investment objectives and risks carefully before investing in options. Because of the importance of tax considerations to all options transactions, the customer considering options should consult their tax advisor as to how taxes affect the outcome of each options strategy. Supporting documents for any claims will be furnished upon request.
Options trading subject to eligibility requirements. Strategies available will depend on options level approved.
Maximum potential loss and profit for options are calculated based on the single leg or an entire multi-leg trade remaining intact until expiration with no option contracts being exercised or assigned. These figures do not account for a portion of a multi-leg strategy being changed or removed or the trader assuming a short or long position in the underlying stock at or before expiration. Therefore, it is possible to lose more than the theoretical max loss of a strategy.
Opening new options positions close to or on their expiration date comes with substantial risk of losses for reasons that include potential volatility of the underlying security, limited time to expiration. This type of strategy is not suitable for all investors and should be utilized only by sophisticated investors who understand the essentials of options and the risks associated with short interval trading.
Moomoo is a financial information and trading app offered by Moomoo Technologies Inc. In the U.S., investment products and services on Moomoo are offered by Moomoo Financial Inc., Member FINRA/SIPC.
TradingView is an independent third party not affiliated with Moomoo Financial Inc., Moomoo Technologies Inc., or its affiliates. Moomoo Financial Inc. and its affiliates do not endorse, represent or warrant the completeness and accuracy of the data and information available on the TradingView platform and are not responsible for any services provided by the third-party platform.
Let's explore:
Tesla's Fundamental Analysis
TSLA plans to release earnings on Wednesday after the bell at a time when the stock is down some 13% year to date amid a beat-down that began in earnest in mid-December.
Wall Street expects the electric-vehicle firm's first-quarter results to show $0.36 in adjusted earnings per share on roughly $22.35 billion of revenue.
A print like that would reflect about 15.5% in year-over-year revenue growth, as well as a 33% y/y gain from the $0.27 in adjusted EPS that Tesla saw in the same period last year.
But interestingly, nine of the 26 sell-side analysts that I know to cover TSLA have lowered their earnings estimates for the period since the quarter began, while only four have raised them.
The remaining 13 analysts have made no changes. This tells me that more than a few of them don't really know what's coming.
Tesla's Technical Analysis
Now let's check out TSLA's chart going back some eight months and running through Thursday afternoon (April 16):
Readers will first note that TSLA saw a double-top pattern of bearish reversal this past autumn, as marked by the two red boxes at the chart's left. That pattern worked out quite well.
However, the stock has recently broken out of a downtrend, as illustrated here by a Raff Regression model (the orange-and-pink shaded area at the chart's right).
The stock has also retaken its 21-day Exponential Moving Average (or "EMA," marked with a green line), which has likely re-energized the swing crowd.
That said, Tesla has been recently butting up against resistance at its 50-day Simple Moving Average (or "SMA," marked with a blue line) and its 200-day SMA (the sloping red line) as well.
TSLA took both of them late last week, but it's not yet clear whether it can hold them. (It fell back below the 200-day SMA on Monday and the 50-day line intraday on Tuesday.)
If the stock does hold these two lines, that could cause portfolio managers with a financial interest in Tesla to consider increasing their long-side exposure in response.
Meanwhile, Tesla's Relative Strength Index (or "RSI," the gray line at the chart's top) has improved. So has its daily Moving Average Convergence Divergence indicator (or "MACD," marked by blue bars and black and gold lines at the chart's bottom).
However, neither one is postured very bullishly as of yet. Within that MACD, the histogram of the 9-day EMA (the blue bars) has moved above zero, sending short-term bullish signals.
Similarly, the 12-day EMA (the black line) has moved above the 26-day EMA (the gold line). That's bullish, but the fact that both lines remain below zero does temper that energy a bit.
An Options Option
Some option traders who are bullish on Tesla but also want to limit downside risk are probably using what's known as "bull-call" spread here.
That's where you buy one call on a stock and sell another with a higher strike price, but where both expire on the same day. Here's an example:
-- Long one TSLA call with an April 24 expiration (i.e., after earnings) at a $390 strike price (near the stock's 50-day SMA). That cost roughly $12.90 at recent prices.
-- Short one TSLA April 24 $405 call for about a $6.80 credit.
Net Debit: $6.10.
This trade risks the $6.10 net debit (the maximum theoretical loss) in an attempt to bring in $15, for a maximum theoretical profit of $8.90.
These options traders would see the $8.90 maximum theoretical profit if TSLA trades at or above $405 at expiration.
Conversely, traders would face the $6.10 maximum theoretical loss if Tesla trades at or below $390 at expiration.
(Moomoo Technologies Inc. Markets Commentator Stephen "Sarge" Guilfoyle had no position in TSLA at the time of writing this column.)
This article discusses technical analysis, other approaches, including fundamental analysis, may offer very different views. The examples provided are for illustrative purposes only and are not intended to be reflective of the results you can expect to achieve. Specific security charts used are for illustrative purposes only and are not a recommendation, offer to sell, or a solicitation of an offer to buy any security. Past investment performance does not indicate or guarantee future success. Returns will vary, and all investments carry risks, including loss of principal. This content is also not a research report and is not intended to serve as the basis for any investment decision. The information contained in this article does not purport to be a complete description of the securities, markets, or developments referred to in this material. Moomoo and its affiliates make no representation or warranty as to the article's adequacy, completeness, accuracy or timeliness for any particular purpose of the above content. Furthermore, there is no guarantee that any statements, estimates, price targets, opinions or forecasts provided herein will prove to be correct.
Options trading is risky and not appropriate for everyone. Read the Options Disclosure Document (https://j.moomoo.com/017y9J) before trading. Options are complex and you may quickly lose the entire investment. Customers should consider their investment objectives and risks carefully before investing in options. Because of the importance of tax considerations to all options transactions, the customer considering options should consult their tax advisor as to how taxes affect the outcome of each options strategy. Supporting documents for any claims will be furnished upon request.
Options trading subject to eligibility requirements. Strategies available will depend on options level approved.
Maximum potential loss and profit for options are calculated based on the single leg or an entire multi-leg trade remaining intact until expiration with no option contracts being exercised or assigned. These figures do not account for a portion of a multi-leg strategy being changed or removed or the trader assuming a short or long position in the underlying stock at or before expiration. Therefore, it is possible to lose more than the theoretical max loss of a strategy.
Opening new options positions close to or on their expiration date comes with substantial risk of losses for reasons that include potential volatility of the underlying security, limited time to expiration. This type of strategy is not suitable for all investors and should be utilized only by sophisticated investors who understand the essentials of options and the risks associated with short interval trading.
Moomoo is a financial information and trading app offered by Moomoo Technologies Inc. In the U.S., investment products and services on Moomoo are offered by Moomoo Financial Inc., Member FINRA/SIPC.
TradingView is an independent third party not affiliated with Moomoo Financial Inc., Moomoo Technologies Inc., or its affiliates. Moomoo Financial Inc. and its affiliates do not endorse, represent or warrant the completeness and accuracy of the data and information available on the TradingView platform and are not responsible for any services provided by the third-party platform.
Disclaimer
The information and publications are not meant to be, and do not constitute, financial, investment, trading, or other types of advice or recommendations supplied or endorsed by TradingView. Read more in the Terms of Use.
Disclaimer
The information and publications are not meant to be, and do not constitute, financial, investment, trading, or other types of advice or recommendations supplied or endorsed by TradingView. Read more in the Terms of Use.