#DOGE/USDT - Only One Scenario Left: UP
#DOGE
The price is moving within a descending channel on the hourly timeframe. It has reached the lower boundary and is heading for a bounce. A retest of this boundary is expected.
The Relative Strength Index (RSI) indicates a downward trend, and this trend is likely to continue due to the overbought condition.
A key support zone (in green) was found at 0.09160, and the price has bounced off this zone several times, making it a strong support level.
The price is trending towards the 100-period moving average, which we are approaching. This trend supports an upward move.
Entry Price: 0.09211
First Target: 0.09448
Second Target: 0.09600
Third Target: 0.09794
Stop Loss: At the resistance zone (in green)
Remember this simple rule: Money Management.
Any questions, please leave a comment.
Thank you.
Community ideas

IBIT Gaps As a Leading Price Predictor For BitcoinIn this study I cover something that I discovered over a year ago comparing the 4-Hour I bit charts and a noticing frequent gaps in the price action, which ultimately filled Almost 100% of the time.
Similar to the CME Gap where there is likely unrealized losses on the books at the CME these gaps act as a magnet for Price action in the future to go back and fill the fair value gaps that were created during non-market hours.
So while this is not necessarily a groundbreaking study it is certainly interesting and can be used for help in knowing where near-term price is likely to go and possible reversal areas based on these Gap fills.
Pretty simple to add to your charts.
Try it out and let me know what you think.
Trade Smart. Not Often.

NQ Testing 200MA With Bullish DivergenceNasdaq futures are currently testing the 200-day moving average, a key long-term support level that the price has recently attempted to break below.
At the same time, both RSI and Momentum are showing bullish divergence — price made a lower low while indicators formed higher lows, suggesting that downside momentum may be weakening.
Price is now attempting to stabilize around this support area, and a move above recent highs could signal the start of a short-term recovery.
However, if the 200 MA fails to hold, the correction could extend further as the market searches for the next support zone.
Disclaimer:
This analysis is for educational purposes only and reflects personal market observations. It does not constitute investment, financial, or trading advice. Always conduct your own research before making trading decisions.

Forex Basics Every Beginners Must Know!What is forex?
Forex (Foreign Exchange) is the global market where people buy and sell different currencies to make a profit. It is the largest financial market in the world, where currencies from different countries are traded with each other.
Every Forex trade involves two currencies.
For example: EUR/USD, USD/INR, GBPJPY, USD/ZAR, etc.
But, why?
You are buying one currency and paying in the second currency.
In EUR/USD, you are buying EUR and paying with USD. In other words, EUR/USD shows how many US dollars are needed to buy 1 Euro.
Forex pairs show how much of one currency is needed to buy another currency.
Base Currency & Quote currency:
1. Base Currency:
The first currency in the pair is called the base currency. It is the currency you are buying or selling.
2. Quote Currency:
The second currency in the pair is called the quote currency. It shows how much of that currency is needed to buy one unit of the base currency.
Q: What if I am selling EUR/USD?
If you sell EUR/USD, it means you are selling Euros (EUR) and buying US Dollars (USD).
It means you believe that the Euro will become weaker compared to the US Dollar.
Currency Classes in Forex
In Forex, currency pairs are generally divided into three classes based on trading volume and popularity.
1. Major Currency Pairs
Major pairs are the most traded currency pairs in the world, and they always include the US Dollar (USD).
2. Minor Currency Pairs (Cross Pairs)
Minor pairs are currency pairs that do not include the US Dollar.
3. Exotic Currency Pairs
Exotic pairs include one major currency and one currency from a developing country.
Quick Comparison:
Important Topic:
1. What is Spread?
- It is the difference between the buy price and the sell price.
Let’s take a random currency example:
Suppose,
Buy price is 1.1002, and Sell price is 1.1000
Spread = 2 pips
2. What is pip?
A pip is the smallest standard price movement in a Forex currency pair. Think of it like a unit used to measure price movement.
For Most currency pairs:
1 pip = the 4th number after the decimal
For example, the price of GBP/USD is 1.2745.
The price of GBP/USD is 1.2745.
If the price moves to 1.2746, this change is called a 1 pip move.
1.2745 to 1.2750 = 5 pip
1.2745 to 1.2760 = 15 pip
For JPY Pairs:
1 pip = 2nd decimal place is the pip
For example. The price of USD/JPY is 158.43.
If the price moves to 158.50, this change is called a 7 pip move.
What is the lot size?
In Forex trading, you don’t buy or sell just one unit of a currency, such as $1 or €1. Instead, currencies are traded in standardized amounts called lots, which represent batches or blocks of currency
What is leverage?
Leverage in Forex trading allows traders to control a larger position with a smaller amount of money.
In simple terms, leverage means borrowing money from your broker to trade a bigger amount than what you actually have in your account.
Imagine you have $100 in your trading account. If your broker provides 1:100 leverage, it means you can open a trade that is 100 times larger than the money you actually have. So with $100, you are able to control a position worth $10,000 in the market. In other words, leverage allows you to trade a much larger amount of currency than your account balance alone would normally allow.
Common Leverage Ratios:
1:10 → $1 controls $10
1:50 → $1 controls $50
1:100 → $1 controls $100
1:500 → $1 controls $500
That’s it.
This series will continue with the upcoming parts.
This post took a lot of effort to make Forex concepts simple with visuals and examples. If you found it helpful, please boost or share it for better reach. As this is our first post, the design may not be perfect. We appreciate your support.

EURJPY H4 | Bearish Reaction Off Pullback ResistanceMomentum: Bearish
Price is currently below the ichimoku cloud.
Sell entry: 183.800
- Pullback resistance
- 61.8% Fib retracement
Stop Loss: 183.553
- Swing high resistance
Take Profit: 182.471
- Swing low support
High Risk Investment Warning
Stratos Markets Limited (fxcm.com/uk), Stratos Europe Ltd (fxcm.com/eu):
CFDs are complex instruments and come with a high risk of losing money rapidly due to leverage. 69% of retail investor accounts lose money when trading CFDs with this provider. You should consider whether you understand how CFDs work and whether you can afford to take the high risk of losing your money.
Stratos Global LLC (fxcm.com/en): Losses can exceed deposits.
Please be advised that the information presented on TradingView is provided to FXCM (‘Company’, ‘we’) by a third-party provider (‘TFA Global Pte Ltd’). Please be reminded that you are solely responsible for the trading decisions on your account. Any information and/or content is intended entirely for research, educational and informational purposes only and does not constitute investment or consultation advice or investment strategy. The information is not tailored to the investment needs of any specific person and therefore does not involve a consideration of any of the investment objectives, financial situation or needs of any viewer that may receive it. Past performance is not a reliable indicator of future results. Actual results may differ materially from those anticipated in forward-looking or past performance statements. We assume no liability as to the accuracy or completeness of any of the information and/or content provided herein and the Company cannot be held responsible for any omission, mistake nor for any loss or damage including without limitation to any loss of profit which may arise from reliance on any information supplied by TFA Global Pte Ltd.
Stratos Trading Pty. Limited (fxcm.com/au):
Trading FX/CFDs carries significant risks. FXCM AU (AFSL 309763), please read the Financial Services Guide, Product Disclosure Statement, Target Market Determination and Terms of Business at fxcm.com/au

How the Iran–US Conflict Affects Markets (And What Traders WatchWhen tensions rise between major geopolitical players, financial markets rarely stay calm. Conflicts involving the United States and Iran tend to receive particular attention from traders because of the region’s importance to global energy supply and trade routes.
The first market that usually reacts is oil.
The Middle East accounts for a significant portion of global oil production, and a large share of that oil moves through the Strait of Hormuz, one of the most important shipping routes in the world. Even the possibility of disruption in this area can move oil prices quickly. Markets begin pricing in the risk of supply shortages long before any actual shortage occurs.
For traders, this matters because oil is not just another commodity. It has a direct impact on the broader economy.
When oil prices rise, the cost of transportation, manufacturing, and logistics increases across many industries. Companies spend more to produce and move goods, which often feeds into higher consumer prices. This creates inflation pressure, something central banks closely monitor when making interest rate decisions.
Because of this connection, spikes in oil prices can affect multiple markets at once. Equity indices may weaken as higher energy costs reduce corporate margins. Currencies of oil-exporting countries sometimes strengthen, while oil-importing economies may face additional pressure.
Another important effect is the shift in market sentiment.
Geopolitical conflicts increase uncertainty. During these periods, many institutional investors reduce risk exposure and move capital toward assets that are perceived as safer or more stable. This can increase volatility across equities, commodities, and currencies, even in markets that are not directly connected to the conflict itself.
However, one of the biggest mistakes traders make during geopolitical events is assuming the first market reaction will continue indefinitely.
Markets tend to react very quickly to headlines, often within minutes. That first move is usually driven by uncertainty and speculation rather than confirmed information. As more details become available, the market often reassesses the situation. If supply disruptions or economic impacts appear less severe than expected, prices can retrace a large portion of the initial move.
This is why experienced traders often focus less on the headline itself and more on how the market behaves after the first reaction.
If oil spikes but then stabilizes at a higher level, it may suggest that the market expects a longer-term impact on supply. In that case, energy-related assets may continue trending. On the other hand, if the initial spike fades quickly, it often signals that the market believes the situation will not significantly affect global supply.
Another useful observation is how different markets react relative to each other. For example, if oil rises sharply but equity markets remain stable, it may indicate that investors expect the impact to stay limited to the energy sector. But if equities, currencies, and commodities all start moving together, it usually signals broader risk-off sentiment across the market.
For traders, the key takeaway is that geopolitical news creates volatility, but volatility alone is not a strategy. The real edge comes from understanding how markets typically process uncertainty.
The headline triggers the move, but the market’s reaction over the following hours and days reveals whether the move is temporary or the beginning of a larger shift. Traders who focus on that second phase tend to make better decisions than those reacting purely to the initial news.
AAVE to $700 - The Cup is Full, the Handle is Ready - March 2026AAVE fell 85% from its all-time high and the crowd declared DeFi dead. They moved on. They always do. Meanwhile, a textbook cup and handle pattern has been quietly forming for over four years. Four years.
On the above 4-day chart AAVE has completed a classic cup and handle formation spanning from the 2021 highs to the present. The cup base printed near $50. The handle is a falling wedge, itself a bullish reversal pattern with a measured move of 323 points (635%) from the cup base. A number of reasons now exist to be long. They include:
1) Cup and handle confirmed. The cup spans from mid-2021 to late-2024, the rounded base is textbook, long, grinding, painful for holders, and structurally perfect for what comes next. The measured move from this formation projects $650+. That is not a guess, that's geometry.
2) The handle is a falling wedge. For those unfamiliar, a falling wedge within the handle of a cup and handle pattern is about as bullish as structures get. Compression before expansion. Springs coil tightest before they release. This one has been coiling since late 2024.
3) Bullish divergence. Price makes lower lows inside the handle while the oscillators refuse to confirm. This is textbook momentum divergence, the kind that precedes significant reversals. Look left, same settings used. The sellers are exhausted but do not know it yet. The chart knows.
4) The 635% measured move from the cup base aligns with the previous cycle highs and Fibonacci extension levels. Confluence of targets is not something to ignore. When the chart, the pattern and the fibs all agree, the burden of proof shifts to the bears. Look left. Is this time different?
5) DeFi TVL is recovering while retail sentiment remains firmly in the ‘DeFi is dead’ camp. This divergence between on-chain reality and crowd perception is precisely the setup that produces the most violent moves. The crowd is always late. Always.
Targets
1st target: $280, the falling wedge breakout target and approximate neckline retest zone. Expect resistance here. If it clears without a fight, that tells you everything about the strength of this move.
2nd target: $380, the 0.618 retracement of the entire decline from ATH. A natural pause point. Take partial profits if you must, but do not exit entirely.
3rd target: $650+ the full measured move from the cup and handle. The headline number. The one the crowd will chase after it prints. By then it will be too late for most of them. It always is. I met a bloke recently, crying because he bought Solana at the top. $200 plus. He watched it go from twenty to two hundred and thought, 'Yeah, now’s the time to jump in.' How are we the dominant species?
What about the downside?
A 6-day close below $75 invalidates the cup and handle structure and the bullish divergence thesis. Below that level, the handle has failed and the pattern is void. Position size accordingly. Risk management is not optional, it is what separates conviction from recklessness.
The crowd
Search ‘AAVE’ on any crypto forum right now. You will find capitulation, apathy, and a handful of maximalists arguing with ghosts. The Crypto Fear & Greed Index has been hovering at levels that historically precede major rallies in altcoins. Nobody wants to buy AAVE at $100. Everybody will want to buy it at $400. That is not a prediction, it's a pattern as old as markets themselves.
Four years of accumulation do not resolve sideways. They resolve violently. Upwards.
Good luck.
Ww
==============================================
Disclaimer
This idea is for educational and informational purposes only. It is not financial advice. Cryptocurrency trading carries significant risk of loss and is not suitable for all investors. Always conduct your own research (DYOR) and consider consulting a qualified financial advisor before making any investment decisions. Past performance is not indicative of future results.

Oil Kicks Off New Week Whipsawing to $120 and Back. Now What?If oil TVC:USOIL were a stock, traders would be calling it a meme trade this week.
Parabolic moves, all-caps presidential commentary, and a global supply chain disruption gave crude quite the opening on Monday.
West Texas Intermediate kicked off trading up 30% at $120 a barrel , and Brent wasn't far behind at $119.
A few hours later, WTI was back near $100 and whipsawing hard.
💥 What Just Happened
The short version: US and Israeli strikes on Iran entered their second week, and Iran responded by tightening its grip on the Strait of Hormuz — the narrow waterway through which roughly 20% of the world's oil and LNG quietly flows every day.
This follows a record-breaking week for oil already. WTI surged 36% last week to $91 — its biggest weekly rise ever — and Brent hit $92.69. Both benchmarks were trading around $60 a barrel in early January.
So yes, we've gone from sixty to $120 in roughly two months. Here’s what the US President had to say on the matter.
"Short term oil prices, which will drop rapidly when the destruction of the Iran nuclear threat is over, is a very small price to pay for U.S.A., and World, Safety and Peace. ONLY FOOLS WOULD THINK DIFFERENTLY!" — President Donald Trump, Truth Social
📉 Everything Else Is Not Having a Great Monday
While oil was busy defying gravity, stock futures were doing the opposite . Dow TVC:DJI futures dropped more than 1,000 points — over 2% — while S&P 500 SP:SPX and Nasdaq NASDAQ:IXIC futures each fell around 1.7%.
This comes on the heels of an ugly week: the Dow declined 3% for its worst weekly performance since April 2025, the S&P 500 shed 2%, and the Nasdaq closed lower by 1.2%. The Dow is now negative year-to-date. The vibes are, to put it technically, off.
Gold OANDA:XAUUSD is actually losing shine today with prices showing an intraday drop of 1.5%. It’s a surprising reaction for an asset that’s usually a headline-grabber during times of war jitters and gloomy global outlook.
🏦 What Goldman Sachs Is Quietly Terrified About
Goldman Sachs NYSE:GS — not a firm known for dramatic statements — warned late Friday that crude and refined products like gasoline and diesel could hit all-time highs if Hormuz flows remain depressed through March.
For context, the all-time high is Brent at $147.50 in 2008. Adjusted for inflation, that's $218 today. We're at $119. The math is uncomfortable.
Traders are increasingly pricing in a prolonged Hormuz closure, which would affect production from countries accounting for about a quarter of global crude supply. Iran has also begun curtailing production from some of the region's largest Middle Eastern producers — a decision that poured accelerant on an already lively fire.
📅 What's Coming This Week
Amid all the geopolitical drama, the economic calendar still has opinions. Wednesday brings the Bureau of Labor Statistics' Consumer Price Index for February — which, given surging gasoline prices, may land with a thud.
Friday delivers the Bureau of Economic Analysis' Personal Consumption Expenditures index for January, the Fed's preferred inflation gauge. If energy prices are feeding into either print, expect the interest rate conversation to get complicated in a hurry.
🧭 So, Now What?
The honest answer is: nobody knows, and anyone who tells you otherwise is either very brave or very wrong. What is clear is that this isn't a one-day spike to fade and forget.
A prolonged Hormuz disruption, a widening conflict, and a market that was already on edge going into the week — that's a combination that tends to keep volatility elevated for longer than anyone expects.
Watch Hormuz headlines above all else. Watch gasoline prices for how quickly this filters into consumer behavior. And watch the CPI print Wednesday — because if inflation is back, markets have a whole new problem layered on top of a very old one.
Off to you : How are you trading the oil surge? Long, short, or sitting it out? Share your views in the comments!

XAUUSD Holding Trend Support - Bullish Continuation PossibleHello traders! Here’s my technical outlook based on the current XAUUSD (2H) chart structure. Price previously developed a steady bullish move after rebounding from a lower support region, gradually forming higher highs and higher lows while respecting a well-defined ascending trend line. This upward movement reflected increasing buying pressure and the establishment of a constructive bullish structure. During this phase, the market also broke above a prior resistance line, confirming a shift in momentum and opening the door for further upside continuation. Following this breakout, price advanced toward a major Seller Zone near 5,250, where the market encountered strong supply pressure. This area acted as a key resistance level and caused the market to transition into a horizontal range consolidation. Inside this range, price moved sideways between the upper resistance zone and the Buyer Zone around 5,070, reflecting temporary equilibrium between buyers and sellers. Multiple reactions from both boundaries confirmed the importance of these levels and showed that the market was building liquidity before the next directional move. Currently, price is stabilizing near the Buyer Zone and the ascending trend support, creating a confluence area where buyers are attempting to regain control. At the same time, the market is trading below the descending resistance line, which continues to cap bullish momentum and forms a compression structure between dynamic resistance and rising support. My primary scenario remains bullish-to-neutral as long as price holds above the 5,070 support level and respects the rising trend line. A confirmed bounce from this demand area could drive price back toward the 5,250 resistance zone, which aligns with the previous seller zone and represents the next key target (TP1) for buyers. However, if price fails to maintain support and breaks decisively below the buyer zone and trend line, the bullish structure would weaken and could lead to a deeper corrective decline toward lower support levels. For now, the market is approaching an important decision point where the reaction from support will likely determine the next directional move. Please share this idea with your friends and click Boost 🚀

BTCUSDT | Bear Market Playbook: Dead Cat Bounce #2Bitcoin continues to respect the bearish market structure on the higher timeframes.
For the 6th time in a row, every time the Volume Delta flips green, price still goes on to print another lower low on the 1D timeframe. This is a clear sign that buying pressure is being absorbed.
What many traders interpret as bullish momentum is simply short-term relief rallies inside a larger downtrend.
A perfect example was the bounce from the February lows.
Now we are seeing the same pattern repeating again.
Price bounced into the 0.382 retracement zone (~74.5K) and immediately started showing rejection.
This type of reaction typically indicates:
- Continuation of the bearish structure
- Another liquidity sweep to the downside
- Lower prices before any meaningful bottom forms
I also previously stated that this is not the market bottom →
Market bottom structure doesn't look like this at all. It has to be engineered in a completely different shape.
Until the structure changes and we start seeing higher highs and higher lows on the daily timeframe, these bounces should be treated as temporary relief rallies — not trend reversals.
Scenario in play:
If the rejection continues from the current retracement zone, the market is likely to rotate lower again and expand further into the downside liquidity below the recent lows.
In bear markets, green Volume Delta does not necessarily mean bullish continuation — it often means trapped buyers.
Good Luck!

Everything is Just Beginning: Why the War-Driven Rally is a Trap
Hey everyone,
The war in the Middle East, which I have been warning about throughout 2025, has begun. But to the surprise of many, the markets did not collapse. On the contrary, we saw a rally in cryptocurrency and gold, while indices only corrected slightly.
Just 5 min read it I warned you long before everything
Right now, the prevailing narrative in my information space is that Bitcoin has become a "safe-haven asset," that Iranians are buying it en masse, and that funds are ready to absorb any supply. It seems like the market is reversing.
But this is far from the truth.
Recent Trades Report:
It's possible and necessary to work even in a market like this. I managed to catch a good trade on the last move:
BTC: Long from
66000 exited at 73,300.
ETH: Long from
1880 exited at 2150
Profits are locked in, but this does not change my global outlook. Now is not the time for euphoria and increasing risk, but for a cool head and strict discipline.
Current Situation Analysis: Why This Isn't the Bottom?
Why do I believe that neither $70,000 nor even $60,000 is the bottom yet? Because a bottom is not a point on a chart; it is a process. And this process usually looks different.
Range Formation: We have now defined a large range between ~
60- 73k. This range will be traded, accumulating liquidity on both sides.
The Liquidity Hunt: Markets move from one liquidity pool to another. The majority of buyers' stop-losses are now concentrated below the $60k level. Therefore, a break of this level to the downside is not a question of "if," but "when."
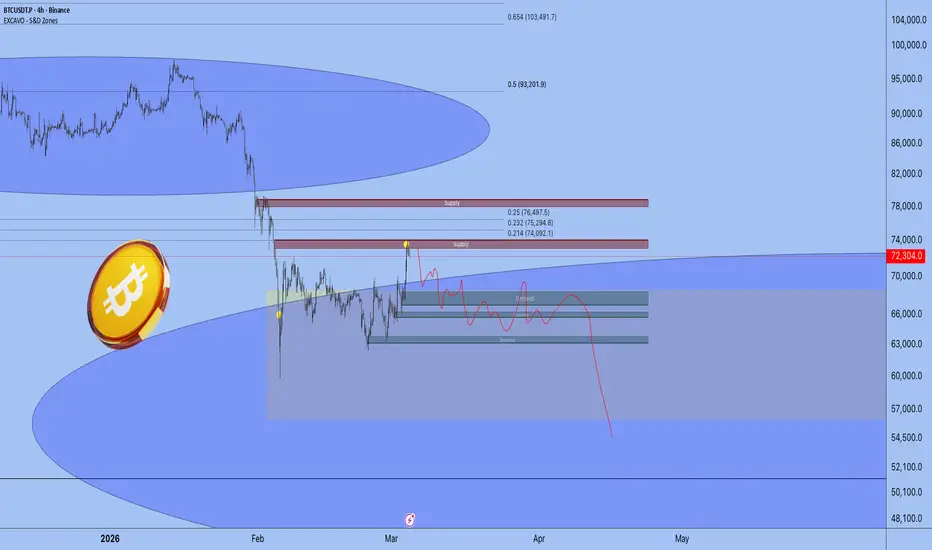
My Base Scenario on the Chart:
On the chart above, I have outlined my vision for the coming months.
The price has tested a significant supply zone.
Next, I expect a prolonged period of trading within the range, possibly with a false breakout to the upside to create even more euphoria.
After that, the most likely scenario is a sharp move down to sweep the liquidity below the current lows.
We have plenty of time until September for large capital to complete its accumulation phase, and this process is rarely painless.
Geopolitics and the Macro View:
Many people have suddenly become geopolitical experts. As someone who has lived in a military conflict zone for a long time, I will say one thing: to my great regret, everything is just beginning. The turbulence will increase, and market sentiment will swing from hyper-positive to panic.
In parallel, the AI revolution is changing everything. We are on the cusp of enormous change. In such times, survival belongs not to the strongest, but to the most adaptable. Flexibility is the key skill.
Conclusion
We are in the process of forming a bottom. It will be a long and likely volatile process. But it is this process that will provide us with what may be one of the last opportunities to buy Bitcoin while it still has a five-figure price tag.
Stay in touch. Leave a like, ask questions in the comments - your feedback is very important for creating new content.
Best regards,
Your EXCAVO.
Stop Trading on Gut Feeling: How to Build Your First StrategyThere's a special kind of confidence that strikes new traders about three hours into their first session.
Charts are open, indicators are blinking, and somewhere between the second cup of coffee and the fourth YouTube tutorial, a feeling arrives: I totally get this. I should simply buy low and sell high.
Two bad trades later, that feeling is gone — replaced by something quieter and considerably more expensive.
Sound familiar? Good. That means you're ready for what comes next: an actual strategy.
🧠 Your Gut Is Not a Strategy
Let's be honest about what trading on instinct really is: it's pattern recognition without the patterns. You see a line go up, something in your brain says "it's going higher," and before you know it, you've bought the top. Again.
The market doesn't care about your feelings. It doesn't care that you did "a lot of research" (read: scrolled X and Reddit for 40 minutes). What it responds to — what it's always responded to — is structure. Rules. A repeatable process. In other words, a strategy.
📐 What a Strategy Actually Is
A trading strategy isn't a magic formula or a secret indicator combo promoted by a hedge fund manager on a yacht. At its most basic, it's a set of rules that tells you three things: when to get in, when to get out, and how much to risk.
That's it. Entry, exit, risk. Write those three words on a sticky note and put it somewhere you'll see it. It’s true for any asset out there: Bitcoin BITSTAMP:BTCUSD , the Nasdaq Composite NASDAQ:IXIC , or PURPLETRADING:EURUSD.
A simple example for a beginner: enter a short-term trade when the price crosses above the 50-day moving average, exit when it drops back below, and never risk more than 1% of your account on a single trade. Is it glamorous? No. Does it beat "I had a good feeling about it"? Every single time.
🔬 Backtesting: Your Strategy's First Reality Check
Before you put real money on any strategy, you test it. This is called backtesting — applying your rules to historical price data to see how they would have performed. Think of it as a flight simulator for your trades. You get to crash the plane without actually crashing the plane.
The built-in TradingView Pine Script editor lets you do this directly on the chart. You don't need to be a coder. Start with a simple script, run it on a few weeks/months/years of data, and see what the numbers say.
Our superstar users have been too kind and generous to populate the library with lots of helpful indicators and strategies .
Pay attention to win rate, average gain vs. average loss, and maximum drawdown. If the strategy doesn't survive backtesting, it won't survive real markets either.
📏 The One Rule That Actually Protects You
Of all the rules in trading, risk management is the one beginners ignore most and regret most. The idea is simple: decide in advance how much you're willing to lose on any single trade — most professionals suggest 1% to 2% of your total capital — and stick to it religiously.
This isn't pessimism. It's arithmetic. A trader who loses 10 trades in a row but only risked 1% each time is down 10%. A trader who risked 20% per trade on that same streak is down 89% and having a very bad week. Position sizing isn't a footnote — it's the whole story.
Here’s the moment where you need to learn about the asymmetric risk-reward bet .
🚀 Start Small, Then Scale
The fastest way to learn a strategy isn't to read more about it — it's to trade it in small size. Paper trading is a fine starting point, but there's something about real money, even tiny amounts, that sharpens the mind considerably.
Start with a position size so small it almost feels embarrassing. Get comfortable with the mechanics.
Follow your rules even when it's uncomfortable — especially when it's uncomfortable. Once you've run the strategy for 20 or 30 trades and the rules feel second nature, then you scale up. Not before.
The market will still be here tomorrow, and the day after that.
Off to you : How do you handle your day-to-day trading process? Share your strategy below and help your peers.

Gold (XAU/USD): Safehaven flows favour Dollar – will $5k hold?Gold took a serious hit yesterday, falling sharply despite the massive geopolitical escalation in the Middle East. Why? Because the resulting energy shock is inherently inflationary, and safe-haven flows are currently pouring into the US Dollar instead.
However, XAU/USD has found a critical floor at the $5,000 psychological level, which lines up perfectly with a major Fibonacci retracement. We are tracking a complex technical structure to see whether this is a mini dead-cat bounce, the start of a broader recovery, or a short-to-medium-term decline.
Key topics covered
- Inflation trade-off : The closure of the Strait of Hormuz is acting as a double-edged sword for Gold. The resulting energy shock is driving up inflation expectations (also had a hot US PPI print of 2.9%), which in turn is reducing the probability of Fed rate cuts—boosting the Dollar at Gold's expense.
- 5k cluster support : Analysing the critical bounce at $5,000, which aligns precisely with the 50% Fibonacci retracement of the macro drop from the $5,600 record highs.
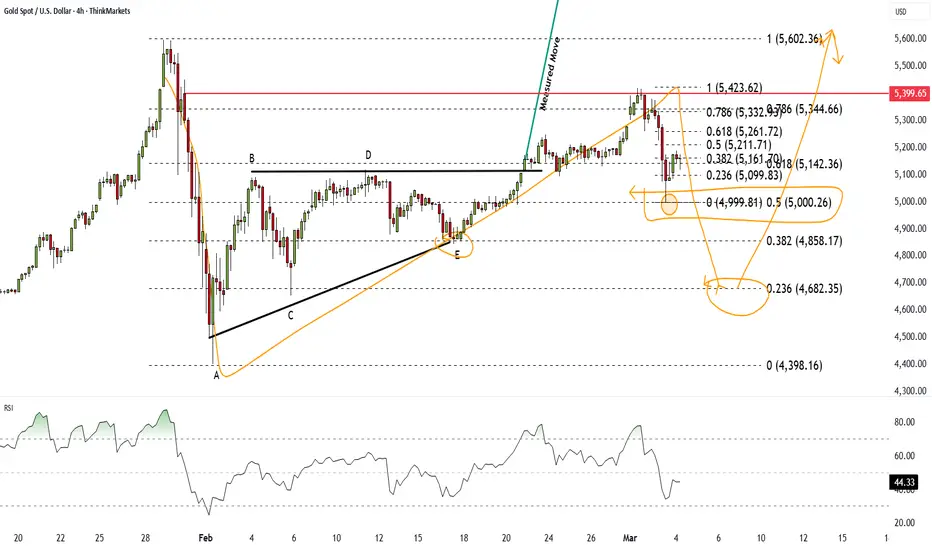
- Elliott Wave & triangle structure : We break down the recent bearish sequence. If the current bounce fails below the 50% retracement ($5,200), we could see a 5-wave impulse down. However, as long as the price holds above the Wave E low at $4,860, the broader bullish ascending triangle remains valid.
- Pennant potential : Why a deeper drop toward the 23.6% Fibonacci level at $4,680 wouldn't necessarily kill the bull market, but rather point to a symmetrical pennant consolidation.
XAU/USD scenarios & trade plan
- Bearish : The recent bounce looks like a mini dead cat bounce. As long as prices remain below the short-term 50% Fibonacci resistance at $5,200, the structure is impulsive to the downside. A break below $5,000 opens up the $4,860 invalidation level, and potentially $4,680. Wait for a lower high to form for a higher-probability short entry.
- Bullish : If buyers can push the price back above the short-term 61.8% Fibonacci resistance at $5,260, it revives the ascending triangle thesis, suggesting the correction ended at $5,000, and the trend is ready to continue higher.
Are you buying the $5k support or waiting for a clearer signal? Share your views in the comments.
This content is not directed to residents of the EU or UK. Any opinions, news, research, analyses, prices or other information contained on this website is provided as general market commentary and does not constitute investment advice.
ThinkMarkets will not accept liability for any loss or damage including, without limitation, to any loss of profit which may arise directly or indirectly from use of or reliance on such information.
Is Apple Rolling Over?Apple has done little for a long time, and some traders may think the tech giant is rolling over.
The first pattern on today’s chart is the weekly close of $278.78 on December 5. AAPL tried to cross above that level the following week but failed. It was revisited early last month without breaking. That may suggest resistance is in place.
Second, the 50-day simple moving average (SMA) is falling and prices have struggled to remain above it. The stock is also slipping below its 100-day SMA. Those points may reflect weakening momentum over the intermediate term.
Third, prices dropped below their 21-day exponential moving average last week and have stayed there since. That may reflect short-term bearishness.
Fourth, converging lines form a potential triangle. Could prices start moving after this period of tightening?
Next, AAPL’s last two earnings reports beat expectations. The stock briefly rallied both times, but with little follow-through. That may reflect limited enthusiasm toward the name.
Finally, AAPL is a highly active underlier in the options market. Its daily average volume of 1.1 million contracts ranks third in the S&P 500, according to TradeStation data. That could help traders take positions with calls and puts.
TradeStation has, for decades, advanced the trading industry, providing access to stocks, options and futures. If you're born to trade, we could be for you. See our Overview for more.
Past performance, whether actual or indicated by historical tests of strategies, is no guarantee of future performance or success. There is a possibility that you may sustain a loss equal to or greater than your entire investment regardless of which asset class you trade (equities, options or futures); therefore, you should not invest or risk money that you cannot afford to lose. Online trading is not suitable for all investors. View the document titled Characteristics and Risks of Standardized Options at www.TradeStation.com . Before trading any asset class, customers must read the relevant risk disclosure statements on www.TradeStation.com . System access and trade placement and execution may be delayed or fail due to market volatility and volume, quote delays, system and software errors, Internet traffic, outages and other factors.
Securities and futures trading is offered to self-directed customers by TradeStation Securities, Inc., a broker-dealer registered with the Securities and Exchange Commission and a futures commission merchant licensed with the Commodity Futures Trading Commission). TradeStation Securities is a member of the Financial Industry Regulatory Authority, the National Futures Association, and a number of exchanges.
Options trading is not suitable for all investors. Your TradeStation Securities’ account application to trade options will be considered and approved or disapproved based on all relevant factors, including your trading experience. See www.TradeStation.com . Visit www.TradeStation.com for full details on the costs and fees associated with options.
Margin trading involves risks, and it is important that you fully understand those risks before trading on margin. The Margin Disclosure Statement outlines many of those risks, including that you can lose more funds than you deposit in your margin account; your brokerage firm can force the sale of securities in your account; your brokerage firm can sell your securities without contacting you; and you are not entitled to an extension of time on a margin call. Review the Margin Disclosure Statement at www.TradeStation.com .
TradeStation Securities, Inc. and TradeStation Technologies, Inc. are each wholly owned subsidiaries of TradeStation Group, Inc., both operating, and providing products and services, under the TradeStation brand and trademark. When applying for, or purchasing, accounts, subscriptions, products and services, it is important that you know which company you will be dealing with. Visit www.TradeStation.com for further important information explaining what this means.

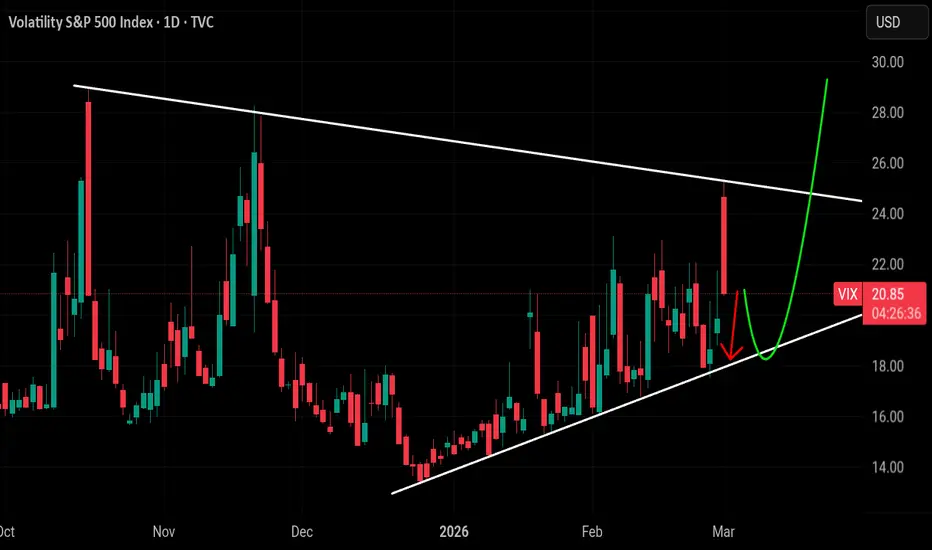
VixMajor pennant here that I think will push the 40+ here in March..
Today 2 things happened
1. We gapped up into resistance
2. We gapped outside the daily Bollinger band
Usually when those 2 things happen you have a pullback.
I think this pullback takes us to 18.00- 18.50
After that , I expect an explosive move to the upside and possibly the big move to 40+..
I'm only wrong about this long setup if vix closes below 17.00.
Microsoft - One of the best swingtrades ever!💵Microsoft ( NASDAQ:MSFT ) is setting up for something big:
🔎Analysis summary:
For over six months, Microsoft has clearly been creating a healthy correction. But looking at higher timeframe structure, Microsoft is also currently retesting a major support area. If we see bullish confirmation soon, this will be one of the best swingtrades of 2026.
📝Levels to watch:
$400
SwingTraderPhil
SwingTrading.Simplified. | Investing.Simplified. | #LONGTERMVISION

BITCOIN at $50k would follow exactly the 2022 script.Bitcoin (BTCUSD) continues to replicate the 2022 Bear Cycle, in fact it's been repeating the price action even before it as the build up sequence since 2021 is identical to the one of late 2024 - 2025.
BTC is right now at the 2nd Stage of consolidation right above the 1W MA200 (orange trend-line). The 1st Stage was on the 1W MA100 (green trend-line). With the 1W RSI oversold (below 30.00) as in June 2022, we might be facing a break below the 1W MA200 soon and new consolidation below it.
The November 2022 Bear Cycle bottom was priced exactly on the 1W MA300 (red trend-line) after it marginally broke below the 1.618 Fibonacci extension. Even though this time the bottom might be even lower (45k-40k), a $50000 entry seems technically like a good opportunity for long-term buying.
So do you think BTC will continue replicating the 2022 Bear Cycle to the point it hits $50000 at least? Feel free to let us know in the comments section below!
---
** Please LIKE 👍, FOLLOW ✅, SHARE 🙌 and COMMENT ✍ if you enjoy this idea! Also share your ideas and charts in the comments section below! This is best way to keep it relevant, support us, keep the content here free and allow the idea to reach as many people as possible. **
---
💸💸💸💸💸💸
👇 👇 👇 👇 👇 👇

Oil Gaps Into Multi-Year ResistanceWith conflict erupting in the Middle East over the weekend, the gap higher in oil prices is hardly surprising. But while sudden price moves tend to attract traders like moths to a flame, moments like this are exactly when context becomes most important.
Geopolitics jolts energy markets
Energy traders have been quick to price in the additional risk premium associated with the scale and significance of the weekend’s military action. With fears of escalation and potential supply disruption centred around the Strait of Hormuz, the sharp move higher in oil prices is not particularly surprising.
But when markets are being driven by rapidly evolving geopolitical developments, the day-to-day news flow can make it difficult to maintain a sense of the bigger picture. This is exactly where technical analysis can add value, helping traders step back from the headlines and understand where price is moving within the broader market structure.
The rally meets multi-year resistance
Looking at the weekly chart, the broader structure of the oil market over the past few years has been defined by a gradual sequence of lower swing highs. In simple terms, each rally has struggled to push beyond the previous peak, creating a gently downward-sloping structure on the higher timeframe.
That backdrop makes the current move particularly interesting. The geopolitical shock has propelled oil directly back into one of these higher-timeframe resistance zones, sitting just beneath the highs formed during previous rallies. In other words, the news has acted as the catalyst, but the market has arrived at a level that already carried significant technical weight.
The speed of the move also stands out. Momentum on the daily chart has surged as price rapidly pushed away from recent consolidation and into territory where previous advances have struggled to sustain follow-through. Moves like this often leave areas on the chart where price travelled quickly with relatively little trading activity, creating pockets of thin liquidity that markets sometimes revisit later.
From a structural perspective, this leaves oil at an interesting crossroads. If buyers can sustain momentum and push price through this resistance zone, it would mark a meaningful shift in the longer-term structure by breaking the pattern of lower highs that has defined the market in recent years. But if the rally begins to stall here, it would simply reinforce that same structure once again.
For traders, that makes the coming sessions particularly interesting. The headlines may have triggered the move, but the weekly chart suggests oil has now arrived at one of the most important technical decision points on the chart.
UKOIL Weekly Candle Chart
Past performance is not a reliable indicator of future results
UKOIL Daily Candle Chart
Past performance is not a reliable indicator of future results
Disclaimer: This is for information and learning purposes only. The information provided does not constitute investment advice nor take into account the individual financial circumstances or objectives of any investor. Any information that may be provided relating to past performance is not a reliable indicator of future results or performance. Social media channels are not relevant for UK residents.
Spread bets and CFDs are complex instruments and come with a high risk of losing money rapidly due to leverage. 85.24% of retail investor accounts lose money when trading spread bets and CFDs with this provider. You should consider whether you understand how spread bets and CFDs work and whether you can afford to take the high risk of losing your money.

Gold – Volatility Risks Increase Due to Iran ConflictIt could be argued that geopolitics weren’t considered a primary driver of Gold through much of February. The focus for traders was more on positioning, shifting Federal Reserve interest rate expectations and the jolt of uncertainty that followed the US Supreme Court’s decision to strike down President Trump’s reciprocal tariffs. This all combined to explain the sharp drop from all-time highs at 5598 on January 29th, to low at 4403 on February 2nd, and then just as importantly, the choppy rebound and subsequent firm hold above 5000 since February 20th.
However, geopolitics jumped to the forefront again on Friday after Bloomberg and other news agencies reported United Nations inspectors said Iran is conducting regular and unexplained activity at bombed uranium-enrichment sites, adding a major hurdle to on-going talks between US-Iran to agree a nuclear deal. This led Gold to spike 1.83% and close at a 1 month high of 5280. Gold is often seen as a safe haven during times of global upheaval or major geopolitical events, and traders were keen to add protection over the weekend.
It turns out that decision was a sound one, with the US and Israel carrying out combined strikes on targets across Iran on Saturday and Sunday, which was then followed by retaliatory strikes on US and Israeli bases in the Middle East region. The attacks on Tehran, the Iranian capital led to the death of the country’s Supreme Leader Ayatollah Khamenei and so far, officials have stated they will still not negotiate with the US. This all represents a major escalation and opens the possibility for a more extended conflict than initially anticipated. Perhaps unsurprisingly, Gold spiked another 2.5% this morning to fresh 1-month highs of 5419 in early trading (0730 GMT).
Whether Gold continues its recent up move to print new all-time highs above 5600, or falls back to lower levels may well depend on real time updates regarding how the fast moving situation in Iran develops over the next 48 hours, with traders sensitive to updates on the potential length of the conflict, support from US Congress for further escalation, and if the Iranian regime can maintain its rule of the country or eventually capitulates and opens the possibility of fresh negotiations.
Technical Update: Long Term Uptrend Resumption?
Gold strengthened into the weekend, with Friday’s close at the week’s upside extreme (5280), perhaps a sign of developing positive sentiment. Weekend events in Iran raised the likelihood of heightened volatility, and while the broader market impact remains to be seen this week, keeping key support and resistance levels in focus could be important for mapping out the next potential directional themes for Gold in the days ahead.
Potential Resistance Focus:
If the heightened geopolitical tensions escalate, traders might anticipate potential safe‑haven demand favouring further Gold strength. In that scenario, the first notable resistance may sit at 5451, a level which is equal to the January 30th high trade. A closing break above 5451 could reinforce upside momentum and open the door for attempts at additional price gains.
Gold’s ability to post successful closing breaks above 5451 could signal renewed momentum within the broader, still‑intact long‑term uptrend. Clearing that first resistance may open scope for tests of 5598, which is the January 29th all-time high. A break above 5598 could suggest the possibility of further price strength toward 6046, which is the 38.2% Fibonacci extension level.
Potential Support Focus:
Gold’s recent strength could face corrective pressure if geopolitical tensions around Iran ease, with traders potentially looking for selling interest to re‑emerge. In that scenario, the first key level to monitor may be 5238, a level which is equal to half the latest price strength. A closing break below 5238 could suggest weakening support and even point to further downside pressure.
While not an outright bearish signal on its own, closes below 5238 could suggest corrective pressure may well be building and deeper supports may then come into play, with the focus shifting first to the rising mid‑average at 5055, then even to 5018, which is the 38.2% Fibonacci retracement of February’s advance.
The material provided here has not been prepared accordance with legal requirements designed to promote the independence of investment research and as such is considered to be a marketing communication. Whilst it is not subject to any prohibition on dealing ahead of the dissemination of investment research, we will not seek to take any advantage before providing it to our clients.
Pepperstone doesn’t represent that the material provided here is accurate, current or complete, and therefore shouldn’t be relied upon as such. The information, whether from a third party or not, isn’t to be considered as a recommendation; or an offer to buy or sell; or the solicitation of an offer to buy or sell any security, financial product or instrument; or to participate in any particular trading strategy. It does not take into account readers’ financial situation or investment objectives. We advise any readers of this content to seek their own advice. Without the approval of Pepperstone, reproduction or redistribution of this information isn’t permitted.

S&P and a very timely correction for the U.S. presidentWith the start of the boxing match between the U.S. and the regime in Iran in the Middle East ring, and with rising threats around the Strait of Hormuz, around 20–30% of global oil and gas supply could be disrupted—at least in the coming week (hopefully not for long).
Usually, these kinds of tensions inject fear into the markets and create a chain reaction. The first domino to wobble is energy—and in this case, specifically oil prices.
So how does this chain look in our case?
Higher Oil Price --> Higher Inflation --> Higher Interest Rates --> Lower Corporate Profits
Can you see the connection with the S&P?
Markets move on trader sentiment and the perceived future value of the assets they trade.
So what should we expect for the S&P?
If the S&P breaks below $6790, my next target is $6500.
The downtrend can be reinforced by sustained higher oil prices and a stronger DXY (>97). In that case, the S&P could reach $6150.
Why is this timely?
We have the U.S. presidential midterm elections in November. That gives President Trump’s administration enough time to potentially revive the market and show strong growth in the months leading up to the election. Recency bias plays a role here.
A new Fed Chairman will be in office by the end of May. As you may know, Kevin Warsh has been announced as the next nominee, and he is considered hawkish. So at least until June, the market will likely price in “no rate cuts.”
Seasonality in the S&P also shows that around this period we often see corrections—and sometimes the lowest prices of the year. (Note that, I made the seasonality chart myself and the big moves during the COVID period have not been excluded)

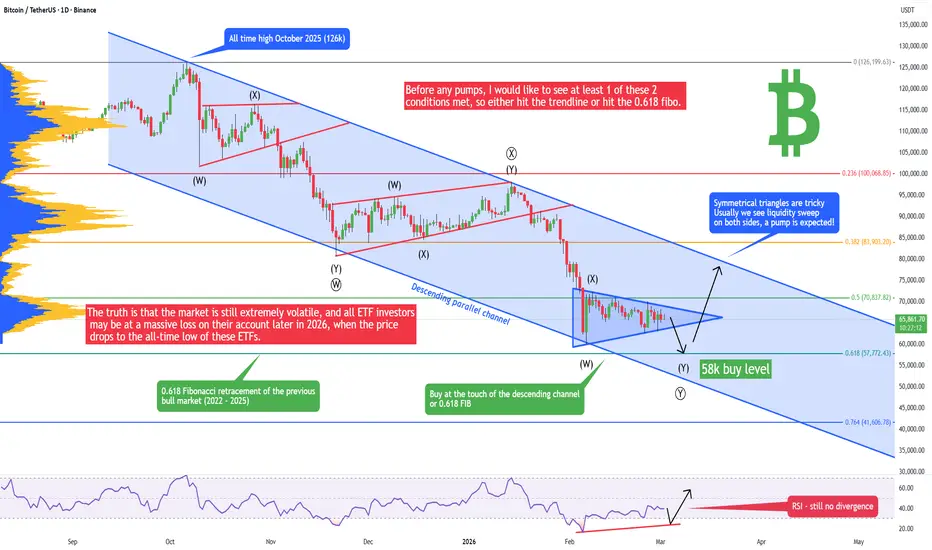
Bitcoin - War in Dubai, Bitcoin crash soon! (pump after that)The current war between Iran and the UAE (Dubai) will probably send the price of Bitcoin (and all altcoins) down! Dubai has been one of the most secure places in the world, but with the current attacks, people may lose trust, and the housing market could collapse in this country. Dubai is known as a major global hub for cryptocurrency and blockchain technology, that's why it's so dangerous for the price of Bitcoin. We may see a huge sell-off and fear in the market in the next coming days/weeks, but in my opinion, that would be a great opportunity to enter a long position. You want to buy when there is blood on the streets, not when everyone is buying.
I think we can expect a last capitulation and big sell-off towards 58k in the short term. Then we may see a huge rise to 83k. From a technical point of view, 58k is a very strong support because of the 0.618 Fibonacci retracement of the previous bull market and also because of the 200 weekly moving average. This gives us a strong confluence to buy Bitcoin here.
What is very interesting is that we can see a symmetrical triangle on the daily chart (blue triangle). Triangles are very tricky because big players tend to take liquidity on both sides. In other words, whales will send the price down to take all stop losses from bulls and then up to take all stop losses from bears. If you see a triangle on a chart, always stay very cautious. You can trade triangles if you know what you are doing.
On the RSI indicator there is still no bullish divergence. But if the price drops to 58k, we will see a bearish divergence on the indicator. What is a bullish divergence? The price makes a lower low, but the indicator makes a higher low instead, which is a sign of strength.
I am very curious. What do you think about the current war in the Middle East? Write a comment!
Write a comment with your altcoin + hit the like button, and I will make an analysis for you in response. Trading is not hard if you have a good coach! I am very transparent with my trades. Thank you, and I wish you successful trades!
Gold Powers Up Again. Can It Go All the Way to $6,000?(That’s only about 10% from here. In this year’s gold terms, that’s piece of cake.)
Gold OANDA:XAUUSD woke up and chose higher grounds on Monday. Prices climbed more than 3% to $5,415 per ounce after the US and Israel over the weekend launched major strikes on Iran, sending geopolitical risk sharply higher.
Safe-haven demand returned with conviction. Silver OANDA:XAGUSD joined the move, rising more than 2% toward $96 per ounce.
Bullion has already posted successive record highs this year , and this latest push builds on a staggering 64% gain in 2025. For a metal known for stability, that is a powerful run.
🌍 When the World Gets Loud, Gold Gets Busy
Escalating tensions in the Middle East have added fresh uncertainty to global markets . Israel’s strikes on Tehran and Iran’s retaliatory missile barrages introduce risks that extend beyond the region.
Markets tend to price uncertainty quickly. Gold has long benefited from moments when investors seek assets perceived as durable stores of value.
This rally reflects more than headlines. It reflects positioning.
🏦 Central Banks and Big Money
The current strength in gold also rests on structural demand. Central banks have remained active buyers, diversifying reserves and adding to long-term holdings. Exchange-traded funds have recorded solid inflows as investors position for potential shifts in monetary policy.
Major banks are reinforcing the bullish narrative.
JPMorgan Chase NYSE:JPM forecasts that sustained demand from central banks and investors could push prices toward $6,300 per ounce by the end of 2026.
Bank of America NYSE:BAC has reiterated similar expectations, highlighting the psychological significance of the $6,000 level.
With gold trading above $5,400, the milestone sits within reach.
📊 The Macro Backdrop Still Matters
Recent US data adds another layer to the story. Producer prices released last week rose more than expected in January, suggesting inflation pressures may be back on the menu.
Investors will parse upcoming labor reports, including the ADP employment update, weekly jobless claims and the nonfarm payrolls report ECONOMICS:USNFP on deck for Friday (Ref: economic calendar ).
Gold tends to respond favorably when inflation rises or when markets anticipate easier monetary policy. Expectations of potential rate cuts later this year continue to support the metal’s upward momentum.
🧮 Is $6,000 Realistic?
At current levels, a move to $6,000 represents roughly a 10% climb. In commodities, it qualifies as a meaningful extension. But in commodities 2026 edition, that feels like a week of effort.
Momentum remains strong, and structural demand provides a cushion. At the same time, price acceleration has already been substantial. Markets rarely travel in straight lines. Consolidation and volatility often accompany rapid advances.
Traders watching the $6,000 threshold will likely view it as both a target and a test.
Off to you : Do you think the next chapter brings consolidation or another charge higher toward that round-number prize? Share your views in the comments!

How to act in times of geopolitical tensionAny geopolitical tension is reflected in market pricing, let alone direct military action. The morning of February 28 was marked by yet another military conflict in the Middle East. Like any armed conflict, it carries severe consequences for both the economy and the population of the country in which it takes place.
Let’s break down how an armed confrontation in the Middle East moves markets across the globe.
Capital Flows Into Defensive Assets
To begin with, during almost any period of geopolitical tension, capital traditionally flows into a defensive basket. The primary reason is uncertainty. Thousands of unknown consequences that markets must begin pricing in immediately act as a discounting factor.
Evidence of this could already be observed today (over the weekend, when traditional markets were closed) via pricing providers that operate during non-standard hours.
Perpetual futures (a type of futures contract with no expiration date) tied to oil jumped approximately 6.2% to $70.6 per barrel on the crypto exchange Hyperliquid, while gold and silver futures rose more than 5% and 8%, reaching $5,464 and $97.5 per troy ounce respectively.
These moves may provide some indication of how these markets could react once regular trading resumes on Monday. Tokenized gold instruments also advanced: Tether Gold climbed to $5,470 per troy ounce, and PAX Gold reached $5,590.
The Strait of Hormuz — A Direct Market Driver
One of the main factors directly impacting financial markets is blockade of the Strait of Hormuz.
Approximately 20% of all global oil passes through the Strait of Hormuz. If it were to be blocked even partially, the global economy would experience a shock.
By disrupting this route, global oil prices would automatically surge, dragging inflation along with them. Under such conditions, one could reasonably expect:
• A 1–2% increase in global inflation
• Oil prices rising toward $120 per barrel
If the strait were blocked even for just several days, not to mention a prolonged disruption.
In addition, wartime insurance premiums for tankers operating in the Persian Gulf would increase due to the risk of attacks, which would further push oil prices higher.
Historical reference:
“2019 (attacks on two tankers in the Gulf of Oman): Brent +2–4% in one day, followed by additional gains. Insurance premiums increased multiple times.”
Macroeconomic Transmission
High oil prices translate into rising costs for all companies:
• Airlines
• Transportation
• Chemical industries
• Manufacturing
A new wave of inflation could also result in the Federal Reserve maintaining elevated interest rates, which becomes another powerful pricing factor.
Countries Most Exposed
China — 14% of imports from Iran in addition to Saudi supply.
India — 50%+ of imports pass through the strait.
Iran loses 90% of its export revenues. Closing the strait would amount to economic suicide, considering oil accounts for 35% of GDP.
Europe — direct dependency is relatively low: only 5% of gas and 12% of petroleum products come from the Gulf. However, global price increases hit the economy, eroding recovery after 2022–2023.
Japan — 70–75% of oil and ~60% of LNG pass through Hormuz. 87% of total energy consumption is imported fossil fuels.
South Korea — 60–68% of crude oil; 81% of total energy is imported.
Short-Term Beneficiaries
In the short term, the United States, Russia, Norway, and Canada — as oil exporters — benefit. Higher prices allow them to generate additional revenue. However, inflation prevents them from fully enjoying these gains.
Strikes on Iran are a reminder: markets fear uncertainty more than war itself.
When risks of energy supply disruptions arise, investors immediately shift into defensive mode:
• Equities come under pressure
• Volatility increases
• Demand for safe-haven assets — gold, U.S. Treasuries, the dollar — rises sharply
Defense and energy companies may experience inflows, but the broader market becomes nervous.
A short conflict — markets recover quickly.
A prolonged one — fear and uncertainty pressure sentiment for months.
Our Strategy: Rebalancing Into a Defensive Basket
What Is a Defensive Basket?
A defensive asset basket is a group of financial instruments that investors use to minimize risk during periods of economic instability, recession, or market turbulence.
Its primary objective is capital preservation and portfolio stability under unstable conditions.
Key Characteristics:
• Low or negative correlation with risk assets (equities, corporate bonds)
• Stable value or a tendency to appreciate during market stress
• High liquidity
Composition of the Defensive Basket
Gold and Silver
Gold — the traditional “safe” asset. It is considered a capital refuge, especially during periods of high inflation, geopolitical risk, or market downturns.
Silver — possesses defensive characteristics but is more dependent on industrial demand, which makes it less resilient during crisis periods.
U.S. Dollar
The world’s reserve currency.
Its value typically rises during periods of global risk due to demand for liquid and reliable assets.
A strong U.S. dollar means that equities, indices, and currencies inversely correlated with USD tend to show weakness.
Japanese Yen
The yen often strengthens during periods of market stress. This is related to its role as a funding currency (carry trade) and Japan’s stable economy.
Swiss Franc
A reliable currency associated with Switzerland’s political and economic stability.
U.S. Treasuries
Long-term U.S. government bonds are considered risk-free assets.
Their yields decline (prices rise) when investors seek protection.
Gold — Technical Perspective
In the current geopolitical context, there remains a high probability of gold advancing toward new historical highs — targeting the 5,612 region with potential expansion toward 6,000.
From a technical perspective, there are no significant problematic zones on the path toward these targets. The only restraining factor may be a seller reaction near the historical high (ATH), where liquidity traditionally concentrates and profit-taking may occur.
Silver — Technical Perspective
Silver also demonstrates potential to update its historical high — with 121 as the reference level.
From a technical standpoint, the situation is more ambiguous. Price is currently trading within a local sideways range between two problematic zones — a Tested FVG and a BPR — which creates short-term uncertainty.
• Key attention should be paid to liquidity interaction:
• Engagement with SSL and BSL
Acceptance above the key extreme
Consolidation above a significant level indicates readiness by large participants to absorb opposing pressure and support higher prices. Additional confirmation would come from the formation of a new imbalance.
Oil — Bullish Order Flow
However, the list of interesting instruments does not end here.
Iran is one of the key oil exporters, and approximately 20% of global oil supply passes through the Strait of Hormuz. Any escalation in the region creates supply disruption risks, which logically translates into upward pressure on oil prices.
Technically, everything looks as it should:
• Price respects bullish zones of interest
• Price does not respect bearish zones
• During corrections, institutional players accumulate long positions while working through liquidity
All of this indicates bullish order flow.
There is no need to invent anything. We work alongside large market participants — maintaining a long bias.
Next interesting targets:
Of course, it is important to understand that the key driver is the current geopolitical situation, and the driver of price appreciation is further escalation.
Short-Term Tactical Focus
Strengthening of the U.S. dollar under such conditions increases pressure on assets inversely correlated with USD. Accordingly, equities, stock indices, and currencies sensitive to dollar dynamics may demonstrate relative weakness.
In the short term, is this an opportunity to search for short positions in:
• The euro
• The British pound
• Selected European and American indices
• The cryptocurrency market
Additionally, if holding exposure to CNY, INR, IRR, SAR, JPY, or KRW, a rational decision under rising global risks may be partial conversion into U.S. dollars or Swiss francs as more defensive currencies.
P.S. Should we prepare for Black Monday? Please share your thoughts in the comments..
Enjoy!
