Nvidia (NVDA) Shares Rise On Potential Chip Shipments to ChinaNvidia (NVDA) Shares Rise On Potential Chip Shipments to China
According to Reuters sources, Nvidia has informed Chinese clients of plans to begin shipments of its H200 chips by mid-February 2026. This has been made possible by a recent change in US export policy, which allows the sale of advanced technologies provided a special 25% duty is paid.
NVDA shares reacted positively to the news, as the ability to legally sell high-performance chips — which are roughly six times more powerful than the previously approved, cut-down H20 versions — to major players such as Alibaba and ByteDance could significantly boost Nvidia’s revenues.
Technical Analysis of Nvidia (NVDA)
In November, we identified an ascending price channel, which remains intact.
Today, the NVDA chart shows clear signs of demand dominance:
→ the price reversed higher (as indicated by the arrow) before reaching the lower boundary of the channel, with the $170 level acting as support;
→ bullish gaps were formed at the open of the last two sessions.
Particular attention should be paid to the candle of 19 December:
→ trading volumes were exceptionally high;
→ the candle body was wide, with the session opening at the low and closing at the high.
If the decline from the all-time high is viewed as a corrective “bull flag” pattern (marked in red), it is notable that the price is now testing the upper boundary of that flag. In this context, it is reasonable to assume that if buying pressure remains strong, the price could break out of the correction and move towards the median of the long-term uptrend that has been in place throughout 2025.
This article represents the opinion of the Companies operating under the FXOpen brand only. It is not to be construed as an offer, solicitation, or recommendation with respect to products and services provided by the Companies operating under the FXOpen brand, nor is it to be considered financial advice.
Community ideas

These Two Patterns Move Markets — Flag & Wedge Explained🎯Professional Guide to Flag and Wedge Patterns
1️⃣ Flag Pattern
Definition
The Flag pattern is a high-probability continuation pattern that forms after a strong impulsive move. It represents a short-term consolidation phase before the market resumes the primary trend.
Standard Flag Structure
Flagpole: A sharp, high-momentum price move with increasing volume
Flag: A brief consolidation in the form of a parallel channel
Breakout: Price continuation in the direction of the prior trend
📌 The correction typically retraces 23%–50% Fibonacci of the impulse move.
Bull Flag
Dominant trend: Uptrend
Consolidation: Shallow downward channel
Valid breakout: Candle close above channel resistance + volume expansion
🎯 Target:
Length of the flagpole projected from the breakout
🛑 Stop Loss:
Below the lower boundary of the flag
Bear Flag
Dominant trend: Downtrend
Consolidation: Weak upward channel
Valid breakdown: Candle close below channel support
🎯 Target and stop logic are the inverse of a Bull Flag
2️⃣ Wedge Pattern
Definition
A Wedge pattern is a price compression structure accompanied by decreasing momentum. It often precedes a strong expansion move and can act as either a continuation or reversal pattern, depending on context.
Key Characteristics
Converging trendlines
Gradually declining volume
Minimum of five valid touches across both trendlines
Rising Wedge
Higher highs and higher lows
Support line rising faster than resistance
Bullish momentum weakening
📉 Primary signal:
Breakdown below support → bearish continuation or reversal
🎯 Target:
Maximum width of the wedge projected from the breakout
🛑 Stop Loss:
Above the last swing high inside the structure
Falling Wedge
Lower highs and lower lows
Resistance line descending faster than support
Selling pressure gradually weakening
📈 Primary signal:
Breakout above resistance → bullish move
🎯 Target = wedge width
🛑 Stop Loss = below the last swing low
3️⃣ Key Differences: Flag vs Wedge
Feature Flag Wedge
Pattern Type Continuation Often Reversal
Structure Parallel channel Converging lines
Formation Time Short-term Medium-term
Volume Behavior Drops during pullback Gradually decreases
Fake Breakout Risk Lower Higher
4️⃣ Advanced Trading Tips
✔️ Flags perform best in strong trending markets
✔️ Wedges gain reliability near major support or resistance zones
✔️ Combining wedges with RSI divergence improves accuracy
✔️ Enter trades only after a confirmed candle close (not wicks)
Final Summary
Flag = Pause → Continuation
Wedge = Compression → Expansion
Volume confirmation defines breakout quality

NZDUSD H4 | Bullish Bounce Off PullbackMomentum: Bullish
Price has bounced off the buy entry, which is acting as a pullback support. This level aligns with the 38.2% Fibonacci retracement, adding significant confluence and strength to the zone.
Buy Entry: 0.5743
Overlap support
Slightly above the 38.2% Fibonacci retracement
Stop Loss: 0.5710
Pullback support invalidation
Near the 50% Fibonacci retracement
Take Profit: 0.5822
Swing high resistance
High Risk Investment Warning
Stratos Markets Limited (tradu.com ), Stratos Europe Ltd (tradu.com ):
CFDs are complex instruments and come with a high risk of losing money rapidly due to leverage. 70% of retail investor accounts lose money when trading CFDs with this provider. You should consider whether you understand how CFDs work and whether you can afford to take the high risk of losing your money.
Stratos Global LLC (tradu.com ): Losses can exceed deposits.
Please be advised that the information presented on TradingView is provided to Tradu (‘Company’, ‘we’) by a third-party provider (‘TFA Global Pte Ltd’). Please be reminded that you are solely responsible for the trading decisions on your account. Any information and/or content is intended entirely for research, educational and informational purposes only and does not constitute investment or consultation advice or investment strategy. The information is not tailored to the investment needs of any specific person and therefore does not involve a consideration of any of the investment objectives, financial situation or needs of any viewer that may receive it. Past performance is not a reliable indicator of future results. Actual results may differ materially from those anticipated in forward-looking or past performance statements. We assume no liability as to the accuracy or completeness of any of the information and/or content provided herein and the Company cannot be held responsible for any omission, mistake nor for any loss or damage including without limitation to any loss of profit which may arise from reliance on any information supplied by TFA Global Pte Ltd.
NLong

XAUUSD (H1) – Trading by LiquidityXAUUSD (H1) – Trading by Liquidity
Price breaks the channel but buying power is weakening, wait for a pullback to the trendline to enter a trade
Summary of today's strategy
Gold has broken the price channel, but the key point is that buying power is weakening after the breakout. As the market is about to enter the holiday season – with thin liquidity, I prioritize trading in the "right zone" (liquidity), not FOMO. Plan: watch for a Buy when the price pulls back to the trendline/old channel, and Sell reactively at the Fibonacci liquidity zone 4474–4478.
1) Key Levels today (according to the chart)
✅ BUY Zone (liquidity pullback)
Buy Zone 1: 4379 – 4382
SL: 4373
Buy Zone 2: 4361 – 4358
SL: 4353
These are the "beautiful" price zones to wait for a pullback – true to the spirit of trading by liquidity: wait for the price to return to the reactive zone, do not chase buying at the top.
✅ SELL Zone (Fibonacci liquidity)
Sell zone: 4474 – 4478
SL: 4482
This zone is "premium + liquidity" so if the price touches it and cannot hold, the likelihood of a profit-taking/reversal is very high.
2) Main Scenario: Wait for a pullback to the channel/trendline to Buy
After a breakout, the market often tends to retest the old trendline/channel to check real buying power.
Since buying power is weakening, the likelihood of fluctuations to sweep liquidity is high → must be patient to wait for the zone 4379–4382 or deeper 4361–4358.
Expected target (scalp/short swing): capture a pullback of 8–15 points depending on volatility, take partial profits when the price bounces according to the plan.
3) Secondary Scenario: Sell reactively at the zone 4474–4478
If the price continues to pull up to the fib zone, I prioritize reactive Sell instead of chasing buy.
Only sell when there are signs of "weakness" (long wick/shadow, not closing strongly above the zone).
4) News Context: Weak liquidity → easy "sweep"
The market is approaching the holiday season, liquidity is weakening, making it easy for spikes/stop-hunts to occur.
Political-economic stories related to policy/tax refunds are causing businesses to prepare strategies, but during this period, prices often react strongly to short-term cash flows rather than sustainable trends.
Conclusion: Today prioritize "right zone – right discipline", limit entering trades mid-way.
5) Risk Management
Maximum risk per trade 1–2%.
Do not enter trades when spreads widen/unusual candle spikes.
Which scenario are you leaning towards today: pullback to 4379/4361 to Buy, or pull up to 4474–4478 to Sell reactively?

Price Is Rising Fast, but the Key Move Lies in the Pullback to 4Hello, I'm Domic.
Looking closely at the H4 chart, gold is currently in a very strong acceleration phase. A steep sequence of bullish candles has pushed price into the 4.48xx area, while both trendlines on the chart are clearly sloping upward. This confirms that the uptrend remains dominant, but it also shows that price is running ahead of its underlying support — and that is usually when the market needs a pullback to reassess buying strength.
From a fundamental perspective, this rally is not happening in a vacuum. Geopolitical and energy risks are resurfacing as a key backdrop: the US tightening restrictions on Venezuelan oil and renewed tensions between Russia and Ukraine are classic drivers of safe-haven demand, pulling capital back into gold. On the other hand, more cautious signals from some Fed officials regarding the pace of rate cuts could keep the USD and bond yields firm, making it difficult for gold to rise in a straight line without intermittent corrections. In addition, a dense calendar of upcoming US economic data suggests intraday volatility may remain elevated but uneven.
The zone I am watching most closely is around 4,360–4,330. In fast “momentum-driven” uptrends like this, the market often repeats a familiar pattern: a sharp push higher that creates a breakout narrative, followed by a pullback to test the base and trend support, and only then does the market decide whether it has enough strength to continue higher. If gold can hold the 4,360–4,330 area and show a clear buying reaction, the bullish structure will remain clean and intact.
Wishing you successful trading!

DOGE: The Cycle Repeats (1W) FRACTAL DOGE: The Cycle Repeats (1W Timeframe)
The Macro View: We are looking at a textbook fractal setup. The chart highlights four distinct structural points (1, 2, 3, 4). We are currently at Point 4, and the structure is rhyming perfectly with the pre-bull run accumulation phases of the past.
1. The Rounding Bottoms (Accumulation):
Zones 1 & 2: These were the "boredom phases" where volatility died, and smart money accumulated. Zone 2 specifically was the launchpad for the massive 2021 parabolic run.
Zone 4 (Current Price Action): We are seeing the exact same rounding bottom formation. The price is stabilizing, forming a heavy base just like it did before the previous explosions.
2. RSI
Look at the RSI indicator at the bottom. The red line (~32. level) acts as a historical floor.
Every single time the weekly RSI touched or hovered near this baseline (Points 1, 2, and 3), it marked a macro bottom.
Right Now: The RSI has reset back to this critical support level. It indicates that the sellers are exhausted and the momentum is primed to flip.
3. The Verdict: This isn't just random noise; it's a cyclical reset. The chart suggests we are in the "Golden Pocket" for accumulation. If the fractal plays out like it did in 2020 (Zone 2), the current price action is simply the calm before the storm.
Summary:
Technical Structure: Bullish Rounding Bottom.
Indicator: RSI at historical oversold support (Buy Zone).
Outlook: The spring is loading. Patience is required, but the setup points to a major impulsive move incoming.
Wavetrend
DOGE Dominance
DOGE/BTC

Giveaway 2025: Merry Christmas & Happy Holidays!Another year, another stack of charts, lessons learned the hard way, and moments where the market reminded us who’s really in charge.
As 2025 winds down, we want to say a genuine thank you. Your ideas, comments, chart screenshots, hot takes, and valuable feedback are what make TradingView what it is. You are the real MVP.
From all of us at TradingView, Merry Christmas and happy holidays. May your screens be calm when they need to be, volatile when you’re ready, and always one lesson richer by the close.
Here’s to cleaner charts, better patience, and fewer “I should’ve waited” moments in the year ahead.
🥁 And now… 🥁
🎁 THE 2025 HOLIDAY GIVEAWAY 🎁
Who:
🏆 THREE LUCKY WINNERS 🏆
What:
🚀 TradingView Premium Plan 🚀
Free for one full year
When:
⏳ JANUARY 5 ⏳
Winners announced
How to Enter :
Leave one comment under this Idea answering both questions below:
1️⃣ What's the biggest trading lesson you learned in 2025?
2️⃣ What's one habit you want to improve as a trader in 2026?
Rules (Quick & Simple) :
1️⃣ Like this Idea
2️⃣ Follow our official TradingView account
3️⃣ One entry per person
Note:
💡 Winners will be selected at random.
🚫 Multiple entries won’t count.
Keep an eye on this space. We’ll announce the winners on January 5.
Happy holidays from TradingView 🎄📈

Why Every Trend Begins and Ends With LiquidityEvery trend in crypto begins and ends with liquidity. Before a trend can move with force, the market must collect the stop orders that provide the fuel for expansion. These orders sit above equal highs, below equal lows, inside inefficiencies, and around obvious retail breakout levels. Price does not trend because sentiment magically aligns.
It trends because the market clears liquidity at one side of the structure and then expands toward the next pool. The earliest phase of any trend usually starts with a sweep: price reaches beyond a key high or low, triggers stops, absorbs the resting orders, and immediately snaps back. This wick is the first sign that the breakout attempt failed and that larger participants have used the liquidity to take positions.
Once liquidity is taken, the market shifts into structural progression. Higher highs and higher lows form not because traders collectively decide to buy, but because the market now has trapped sellers below the sweep, providing momentum as price moves toward the next logical liquidity target.
Structure becomes the visible footprint of this process. Impulse legs show aggression after liquidity collection, and pullbacks tend to remain orderly because the directional objective has not yet been completed.
Every trend is essentially a journey from one liquidity pool to the next, with structure simply describing how that journey unfolds.
The end of a trend is equally tied to liquidity. A trend rarely dies from weakening momentum alone. Instead, it typically completes when price reaches a major pool of opposing liquidity, often equal highs in an uptrend or equal lows in a downtrend.
The final move into that level is usually fast and dramatic, designed to trigger breakout traders while simultaneously running the stops of those holding late in the trend. Once the liquidity is collected, the market loses incentive to continue and snaps back inside the level, exposing the sweep as a terminal event rather than a continuation. This reversal wick marks the end of one trend and the beginning of the liquidity cycle in the opposite direction.
From there, the process repeats. Liquidity is taken. Structure shifts. Displacement confirms intention. A retest provides the entry. And the new trend begins by targeting the next liquidity pool in line.
When traders understand this cycle, trends become far easier to read. Direction is no longer based on hope, indicators, or isolated candles. It is built on recognising how liquidity motivates movement and how structure validates that movement.
Liquidity shows where the market wants to travel, structure shows how it gets there, and together they form a practical framework for identifying when trends are forming, when they are maturing, and when they are preparing to reverse.
BEducation

BTCUSDTHello Traders! 👋
What are your thoughts on Bitcoin?
Bitcoin has entered a corrective phase after a strong bearish move and is currently ranging between a clearly defined support and resistance zone. As long as price remains inside this range, no major directional move is expected.
At the moment, price is expected to move toward the upper boundary of the range. Once this area is reached, price behavior should be closely monitored for confirmation.
Bullish case:
If price breaks and holds above the range high, the next upside targets marked on the chart will come into play.
Bearish case:
If price gets rejected from the range high and the lower boundary of the range is broken, bearish continuation is likely, with the next downside target around 73,000.
⚠️ Until a clear breakout occurs, the market remains in a consolidation phase
Please Don’t forget to like and share your thoughts in the comments! ❤️

EUR/AUD at a Crossroads!The EUR/AUD pair is trading in an upward trend on the four-hour timeframe following the pullback that took place between November 25 and December 10.
The pair is now at a crossroads between continuing the upward trend from the current support levels at 1.77340 and 1.77154, targeting 1.77792 as the first short-term objective. If the price rises above 1.78064 and records a candle close above this level on the four-hour timeframe, this would indicate the potential for further gains in the medium term.
The bearish scenario for EUR/AUD comes into play if the price declines below 1.76849, which represents the most recent higher low. To confirm this scenario, it is preferable to wait for a four-hour candle close below this level.

How Emotions Sneak Into Your Trades (and How to Catch Them)Because the market doesn’t care how you feel — but your portfolio absolutely does.
Every trader likes to believe they’re rational. Calm. Data-driven. A master of charts and probabilities.
And sometimes that’s true — at least until price starts moving faster than expected, your P&L flickers red, and suddenly you’re “just making a small adjustment.”
Emotions rarely kick the door down in trading. They sneak in quietly, wearing sensible shoes and carrying very reasonable arguments. By the time you notice them, they’ve already rearranged your trade plan.
🕵️ Emotion’s Favorite Disguise: Logic
The most dangerous emotions don’t announce themselves as fear or greed. They show up as logic.
“This breakout looks stronger than usual.”
“I’ll give it a little more room.”
“It’s only falling because of low volume.”
Each sentence sounds responsible. Each one is also a potential emotional leak. By the time the trade goes wrong, it feels like bad luck — not emotional interference.
📉 Losses Hurt More Than Gains Feel Good
Behavioral finance has a name for it: loss aversion. Traders experience losses maybe twice as intensely as equivalent gains.
That’s why a small drawdown can hijack your focus while a string of solid wins rarely registers as a lesson. It’s also why traders hesitate to close losing trades, but happily take profits early.
Emotionally, it feels safer to wait than to admit defeat — even when waiting is the riskier choice, especially if you’re deep into volatile crypto markets .
🧠 The Subtle Art of Revenge Trading
Revenge trading rarely looks dramatic. It doesn’t start with yelling at screens or slamming desks.
It usually begins with a quiet thought: “I’ll win the next one.”
That’s when trades get larger, setups get looser, and discipline takes a coffee break. The trader isn’t angry — they’re determined.
The market, unfortunately, doesn’t reward determination. It rewards discipline . Revenge trading isn’t about making money back. It’s about repairing a bruised ego — and markets have a way of charging interest for that.
🎢 Winning Can Be Just as Dangerous
Emotions don’t only sneak in during losses. They love winning streaks, too.
After a few good trades, confidence creeps up. Position sizes grow. Rules bend “just a little.” Suddenly, the trader isn’t following a system but a feeling.
This is how consistency quietly breaks down. Not in chaos, but in comfort.
🧰 Catching Emotions Before They Trade for You
The goal isn’t to eliminate emotion — that’s impossible. The goal is to spot it early, before it gets a vote.
Professional traders use simple, boring safeguards:
Repeating the same setups
Reviewing decisions away from the screen
Noting why a trade was taken, not just the result
Paying attention to behavior, not just outcomes
Emotion leaves footprints. The more familiar you are with your own patterns, the easier it is to catch them mid-step. “When you're centered, your emotions are not hijacking you.” - Ray Dalio.
🎁 The Takeaway
The real edge in trading comes from awareness — understanding how emotions quietly enter the process, recognizing their disguises, and catching them early before they influence your decisions.
Build that awareness, and emotions stop being obstacles — they become signals you know how to manage.
Off to you : How do you manage your emotions when you're trading? Share your strategy in the comments and let's get talking!

How to Use VWAP in Confluence with StructureVWAP is one of the few indicators that consistently adds value when used correctly. It does not predict direction and it does not replace market structure, but it provides a powerful reference point for where fair value sits within the current session or trend.
When combined with structural analysis, VWAP helps you filter trades, improve timing, and avoid impulsive entries that fight the underlying flow.
The first step is understanding what VWAP represents. It shows the average price weighted by volume, reflecting where most transactions have occurred. When price trades above VWAP, it signals that buyers are in control of the session.
When price trades below it, sellers dominate. This context becomes meaningful only when it aligns with the higher timeframe structure.
Start by establishing your bias through market structure.
If the higher timeframe is in an uptrend and price trades within a discount zone, VWAP becomes a dynamic confirmation tool. A reclaim of VWAP after a liquidity sweep or after a break of structure is one of the cleanest signals that buyers are stepping back in.
The same applies in reverse for downtrends: a VWAP rejection after a pullback into premium strengthens the short bias.
VWAP also adds clarity during intraday consolidation. Ranges often form around VWAP because it reflects the session’s equilibrium. Breakouts that occur away from VWAP without pullbacks frequently lack durability.
However, a breakout followed by a retest of VWAP shows acceptance and builds confidence in continuation. This combination turns a common indicator into a reliable filter rather than a standalone signal.
Another effective use of VWAP is identifying exhaustion. When price aggressively pushes far above or below VWAP, it often signals that the move is extended. This does not mean you fade the trend, but it does mean you tighten expectations and wait for structure to align before entering. Once price reconnects with VWAP and shows intent, the next move becomes more sustainable.
VWAP becomes particularly powerful when paired with session logic. Trading above VWAP in a bullish higher timeframe environment during London or New York sessions often leads to cleaner impulses.
Trading against VWAP during low-volume hours produces far more false signals. Timing, structure, and VWAP together create a cohesive framework.
Used in confluence, not in isolation, VWAP supports disciplined decision-making.
It aligns entries with momentum, filters low-quality setups, and clarifies whether the market accepts or rejects a level. When you combine VWAP with structure, liquidity, and session context, your trades become more intentional, less emotional, and significantly more consistent.
Navigating Volatility Amid Unprecedented Scale and Future InvestNASDAQ:META Meta Platforms, Inc. (META) presents a compelling bullish case rooted in its unparalleled execution within the digital advertising core business, juxtaposed against significant strategic investments in future technologies—investments that, while costly, are funded by immense cash flows and may secure the company's dominance for the next decade. Despite a post-earnings sell-off that erased over $200 billion in market capitalization, the fundamental engine of Meta's business demonstrates remarkable strength and scalability. As of early December, shares traded at $647.10, with a forward P/E of 22.17—a valuation that many bulls argue fails to fully account for the core business's profitability and optionality value of its long-term bets.
The Core Bull Case: Unmatched Scale and Profitability
The cornerstone of the bullish thesis is the sheer, almost unprecedented, scale and growth of Meta's primary advertising business.
Blockbuster Financial Performance: Meta's Q3 2024 results were exceptional. Revenue of $51.2 billion not only surpassed estimates but also represented a 26% year-over-year increase—the fastest growth rate since 2021, excluding the pandemic anomaly. Critically, this growth is not on a small base; Meta added $10.7 billion in revenue in a single year, a figure larger than the total annual revenue of most public companies. Operating income grew 18% to $20.5 billion, showcasing the operating leverage of its platform.
AI-Driven Advertising Engine: The revenue surge is underpinned by Meta's successful integration of AI throughout its ad stack. From automated ad creation and placement to advanced targeting and measurement, AI is driving higher engagement and return on ad spend for marketers, which in turn fuels Meta's pricing power and market share gains. The company's industry-leading Average Revenue Per User (ARPU) and robust user engagement across its "Family of Apps" (Facebook, Instagram, WhatsApp, Messenger) remain formidable moats.
Resilience to Regulatory Overhang: While regulatory scrutiny in the EU and legal challenges in the U.S. (particularly concerning youth safety) present headline risk, the bullish view posits these are unlikely to materially impair the core advertising flywheel in the near to medium term. Fines and operational adjustments are seen as manageable costs within the context of Meta's prodigious cash generation.
The Source of Market Skepticism: Investment-Led Volatility
The recent sharp decline in Meta's market cap following stellar earnings highlights the market's acute focus on two forward-looking, capital-intensive areas:
Reality Labs and the Metaverse Bet: The Reality Labs segment continues to report operating losses of approximately $4 billion per quarter. This remains a major point of contention for investors focused on near-term profitability. However, bulls like Andrew Beeli note a strategic pivot: capital intensity is shifting from the metaverse towards AI infrastructure, and Reality Labs is showing promising product evolution with the Meta Ray-Ban smart glasses and developments in neural interface wristbands. The expectation is for losses to plateau and eventually decline as investments mature.
Rising Capital Expenditures and Margin Pressure: Management's guidance for significantly higher capital expenditures—primarily for building a world-leading AI data center fleet—has spooked investors concerned about peak margins. The bears fear a prolonged period of elevated spending with uncertain returns. The bulls counter that Meta benefits from massive economies of scale in AI infrastructure, that these investments are necessary to maintain competitive advantage in both advertising and the emerging AI landscape, and that the company's strong balance sheet (evidenced by a recent $25 billion bond issuance at attractive rates) and cash flow fully support this strategy without jeopardizing financial health.
Valuation and Technical Perspective
From a valuation standpoint, a forward P/E of 22 for a company growing revenue at over 20% annually and generating operating margins above 40% in its core business is viewed as attractive relative to its growth profile and the wider tech sector.
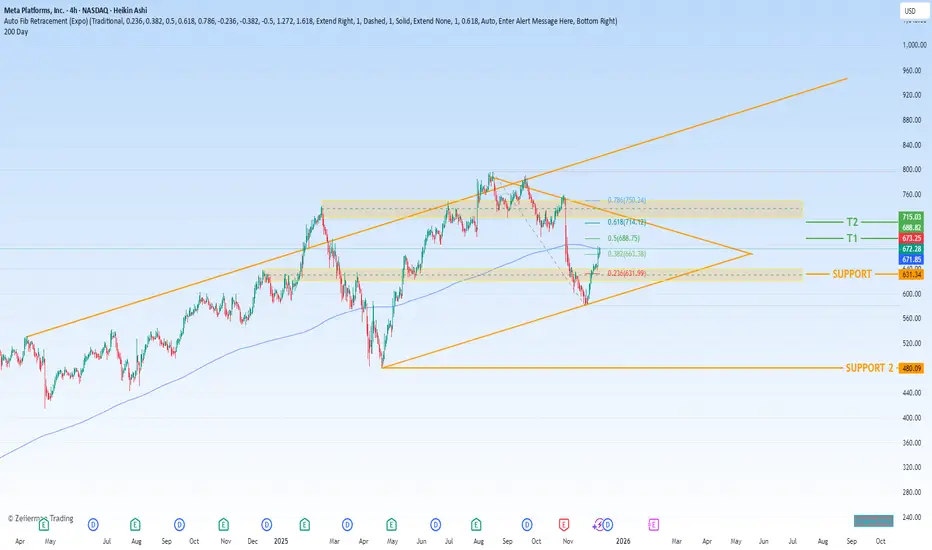
A technical analysis of the stock chart identifies key levels that may define its near-term trajectory:
Support Zones:
Primary Support: $631.99 (0.236 Fibonacci retracement level). This represents the first major test for the bulls following the post-earnings dip.
Major Support: $480.00. This deeper level represents a more severe pullback scenario and aligns with a longer-term structural support area, underscoring the stock's potential volatility range.
Upside Targets (Fibonacci Extension):
Target 1: $688.75 (0.5 Fibonacci level). A recovery to this zone would signal a reclaiming of bullish momentum.
Target 2: $714.12 (0.618 Fibonacci level). Achieving this target would indicate a full breakout and validation of the growth narrative overcoming investment concerns.
Conclusion: A Bet on Execution and Optionality
This thesis builds upon earlier bullish analyses, such as the one highlighted by LongYield in May 2025. Meta's approximate 13% appreciation since that coverage reaffirms the core tenets of sustained advertising strength and strategic patience.
The perspective from Beeli Capital reinforces this view while diving deeper into the market's reaction to Q3 specifics—namely the tension between stellar present results and expensive future ambitions. Investing in Meta today is a belief in two key premises: first, that the core advertising business will continue to generate enormous, growing cash flows for years to come; and second, that management's aggressive investments in AI and Reality Labs represent optionality on future platforms that could eventually yield significant returns. The stock's path toward the $688-$714 target zone will depend on its ability to demonstrate that rising CapEx is translating into tangible competitive advantages and that Reality Labs can begin to narrow its losses, thereby reassuring the market that today's investments are tomorrow's growth engines.
GC(XAU/USD) technical analysis and directional opinion*In this analysis I will not include macroecnomic analysis as we all know broad financial market is waiting for BoJ to create clear directional bias upcoming end of this week on Friday. However I will make a seperate post regarding "How to decode BoJ decision" on the day before the Japanese rate decision
Technical analysis on Gold futures/XAUUSD 8hour time frame
For better swing opportunity, I have done some analysis on 8hour time frame, as for me I prefer using 8hour on Gold for clearer directional evidence. As we can see in the chart, some people might ape in long position at this exact point, since it is pretty obvious Gold is trying for new ATH, yet my standpoint is a bit different. Remember the times before 2025 XAUUSD bullrun, the times when Gold was in years of indeicison phase, lots of XAUUSD traders have been forced to exit the market. Although the time frame is uncomparably smaller, considering BoJ meeting is just few days left, my opinion is to speculate the market before confirmation either macroecnomically or technically happens. So i have made two different set up on Gold one is long position and one is short position. The previous structure before recent 1.57% drop can be read in two different wave structure, one is ending diagonal(rising wedge) and one is accumulation for strong impulse(3) to the upside. As for me, I am eyeing on either side of structure to break via breakdown through the black trendline or breaking the previous liqudity point to ATH.
Some cautions
Even though we have standard of entry at this point, this is important to keep in mind, in this market where US monetary policy is not indicating clear direction but many people are awaiting for BoJ, the liquidity is extremely thin the structure can be manipulated so as for me I will wait until BoJ rate decision structure(at the moment) will break and retest either point. Also keep in mind for today's NFP, it might stimulate the liquidity temporarily and give us clear retest on either set up.
*This is not a trading advice. It is highly recommended for you to make your own decisions. God bless your account.

Nasdaq-100: Lower Low and Lower High?The Nasdaq-100 made a lower low, and now it might have made a lower high.
The first pattern on today’s chart is the November 21 low of 23,854, some 353 points below the October trough. That broke a series of higher lows since April.
Second, the tech-heavy index peaked at 25,835 on December 10. That was 347 points under the all-time record on October 29. That could represent a lower high after the lower low, potentially breaking seven months of uptrend.
Third, NDX stalled last week near October 31’s weekly close. That could suggest resistance has developed below the recent high.
Next, stochastics are dipping from an overbought condition.
Finally, prices are sliding below their 21-day exponential moving average and 50-day simple moving average. Those signals may reflect emerging weakness in the short- and intermediate-term timeframes.
TradeStation has, for decades, advanced the trading industry, providing access to stocks, options and futures. If you're born to trade, we could be for you. See our Overview for more.
Past performance, whether actual or indicated by historical tests of strategies, is no guarantee of future performance or success. There is a possibility that you may sustain a loss equal to or greater than your entire investment regardless of which asset class you trade (equities, options or futures); therefore, you should not invest or risk money that you cannot afford to lose. Online trading is not suitable for all investors. View the document titled Characteristics and Risks of Standardized Options at www.TradeStation.com . Before trading any asset class, customers must read the relevant risk disclosure statements on www.TradeStation.com . System access and trade placement and execution may be delayed or fail due to market volatility and volume, quote delays, system and software errors, Internet traffic, outages and other factors.
Securities and futures trading is offered to self-directed customers by TradeStation Securities, Inc., a broker-dealer registered with the Securities and Exchange Commission and a futures commission merchant licensed with the Commodity Futures Trading Commission). TradeStation Securities is a member of the Financial Industry Regulatory Authority, the National Futures Association, and a number of exchanges.
TradeStation Securities, Inc. and TradeStation Technologies, Inc. are each wholly owned subsidiaries of TradeStation Group, Inc., both operating, and providing products and services, under the TradeStation brand and trademark. When applying for, or purchasing, accounts, subscriptions, products and services, it is important that you know which company you will be dealing with. Visit www.TradeStation.com for further important information explaining what this means.

Lingrid | GOLD Sideways Movement Ahead of FOMC DecisionOANDA:XAUUSD perfectly played out my previous trading idea . Price is holding inside a well-defined consolidation after its prior surge, with price rotating above the rising channel base. The trend remains constructive, but momentum has cooled, suggesting participants are waiting for a catalyst rather than committing aggressively.
If buyers continue to defend the trendline and the lower boundary of the range, gold could attempt another gradual push toward the upper resistance near 4,300. A brief dip toward the channel support may occur to gather liquidity, potentially offering a better positioning point before any renewed upside attempt.
➡️ Primary scenario: support holds near 4,160 → rotation higher toward 4,300.
⚠️ Risk scenario: a sustained breakdown below the channel could weaken the bullish structure.
If this idea resonates with you or you have your own opinion, traders, hit the comments. I’m excited to read your thoughts!

BOJ to Stress Test Global Markets? Why a Black Swan Is PossibleWhile US markets are busy debating AI valuations and parsing the Fed’s latest rate cut , something far more understated — and potentially more disruptive — is brewing across the Pacific.
The Bank of Japan is expected to raise interest rates on Friday, marking what could be its first hike in 11 months. That might not sound dramatic by global standards, but in Japan (where ultra-low rates have been a defining feature for decades) it’s the equivalent of flipping a very large switch.
It’s a moment that could stress test global markets, from US equities to crypto markets and beyond. And yes, that includes your favorite high-beta names.
💴 The Yen Problem
The backdrop here is deceptively simple. Despite narrowing interest rate spreads between the US and Japan, the yen has remained stubbornly weak , even as US yields have cooled.
Normally, shrinking rate differentials would support the yen. Instead, Japanese investors have continued to bet on US equities, keeping dollars in demand and the yen under pressure. In other words: the textbook relationship broke down.
That divergence — between what rates say should happen and what FX markets are doing — is increasingly uncomfortable. Forward rate markets are already hinting that the current setup isn’t sustainable, and that yen appreciation may be waiting just ahead.
For the BOJ, patience has its limits.
🏦 Why the BOJ’s Hand Is Being Forced
The BOJ has been cautious to a fault over the past two years, moving slowly and communicating carefully. But a weak currency is difficult to ignore forever.
A rate hike this week, especially if paired with guidance that more tightening could follow, would signal something bigger than a single policy move. It would mark the beginning of a potential yen-strengthening cycle.
And that’s where things get interesting — and a little dangerous.
🧳 The Carry Trade: Cheap Yen, Expensive Consequences
For years, the yen has been the funding currency of choice. Borrow cheaply in Japan, convert to dollars, and deploy the cash into anything that smells like yield or growth.
Stocks? Nvidia NASDAQ:NVDA , Microsoft NASDAQ:MSFT , the Magnificent Seven.
Crypto? Bitcoin BITSTAMP:BTCUSD and friends.
Fixed income? US bonds, credit, you name it.
Just about every hedge fund manager on the planet has had some version of this trade on. And then some. Estimates suggest more than $20 trillion has been borrowed in yen and scattered across global risk assets.
Since the BOJ’s last rate hike, about half of that — roughly $10 trillion — has already been unwound. That still leaves a massive amount of exposure tied to the assumption that yen funding stays cheap and stable.
That assumption is now being questioned.
🧮 A Simple Example With Uncomfortable Math
Say you borrowed 100 million yen when FX:USDJPY was at ¥160. That loan was worth about $625,000. You used it to buy a mix of meme stocks, AI leaders, maybe a little crypto — because why not, it’s free money after all, right?
Now imagine the yen strengthens by 10%, pushing FX:USDJPY down to ¥140. Suddenly, that same loan is worth $714,000.
Nothing went wrong with your stocks. Nvidia NASDAQ:NVDA didn’t crash. Bitcoin BITSTAMP:BTCUSD didn’t implode. But your liability just grew by nearly $90,000.
At that point, selling isn’t about market conviction — it’s about liquidity. You sell what you can, not what you want.
⚠️ Why This Could Become a Stress Test
This is where the word “Black Swan” starts getting thrown around — not because one asset is broken, but because forced selling doesn’t ask permission.
If the BOJ hikes and signals more to come, carry trades get squeezed. Borrowing costs rise. Currency losses pile up. And assets across the risk spectrum can face pressure — not due to fundamentals, but because traders need to cover yen loans before the math turns hostile.
That’s how correlations spike. That’s how unrelated markets suddenly move together. And that’s how calm conditions can flip fast.
🧭 What Traders Should Watch Next
The BOJ decision itself matters — but the guidance matters more. A one-off hike is manageable. A roadmap toward further tightening changes everything.
If the yen begins a sustained strengthening cycle, it could reshape flows across global markets well into 2026. The AI trade may still be intact and US growth may still look solid. But funding conditions would no longer be as forgiving.
In markets, the most dangerous moments often arrive quietly — announced in polite language, during meetings most people aren’t watching.
Off to you : Are you worried about Friday’s decision and subsequent market reaction? How do you think it’ll go? Share your views in the comment section!

How i Sell Spot btc & Close my Longs at TopThis isn’t a call on where Bitcoin goes next. It’s simply the chart that helped me exit my long positions right near the top.
I’ve kept this setup unchanged for years. No fancy indicators, no complicated overlays. Just the long-term trend lines that have guided every major expansion and slowdown since Bitcoin’s early cycles. When price tapped the upper boundary of this structure, the reaction was enough for me to start unwinding my longs. Nothing mystical here — just respecting a level that has mattered for nearly a decade.
The point of sharing this is to show how even the oldest, simplest charts can keep you grounded. Markets get noisy. Narratives change every week. But the big structure rarely lies. This chart helped me stay disciplined, and it still sits on my screen the same way it did years ago.

GOOG: Is a 10% Surge Imminent? The Setup for $340 Explained🚀 NASDAQ:GOOG : Is a 10% Surge Imminent? The Setup for $340 Explained
In the noisy world of trading, clarity is power.
Today, we are looking at Alphabet Inc. (GOOGL). We are not predicting the future, we are simply preparing for a high-probability outcome.
We have identified a textbook Bull Flag pattern. As noted in the chart, this specific structure historically carries a 71% success rate. However, a statistic is only as good as the execution plan behind it.
The Technical Analysis
The price action is currently consolidating between two parallel yellow lines. This "pause" is healthy, it allows the market to build energy for the next potential leg up.
The key level to watch is $323 . We are looking for a clean breakout above this resistance.
A breakout is only valid if it is accompanied by significant volume . Without volume, a move above $323 could be a "fake-out", and that would be bearish.
If the price loses the $305–$309 zone , the Bull Flag structure is broken, and this specific trade idea is invalid . We must respect the market's "no."
The Projection
If the market gives us the green light at $323 , we have two targets based on standard projections:
Conservative : The 100% projection lands us at $336 .
Aggressive : For those holding longer, the 161.8% extension points higher ( approx. $346) .
Here are the levels I would use to set-and-forget in my trading system:
🎯 Take Profit: White lines ($336 - $346) | > 4-7% Potential
🛡️ Stop Loss : ~$314 Zone (Inside the flag structure) | ~ 2.5% Risk
⚖️ Risk/Reward : 2:1 Ratio or more
🎁 Let’s make a simple deal.
I will handle the heavy lifting to find the top 1% of setups like this, and you just HIT the 🚀 Rocket, Follow and Enjoy.
🤝 Deal?

DOGE pulls back before major decline DOGECOIN is in a range formed against the backdrop of a downtrend. The market is under pressure from above at 0.155 - 0.153 - 0.150. The structure is bearish. The rebound from 0.134 is directed towards 0.1415. A false breakout could trigger a decline.
There is no volume from the bulls, and the market is weak. After each correction, the market updates its lows. The zone of interest is 0.1415 - an order block and a retest of resistance could stop the correction.
Scenario: false breakout of 0.1400 - 0.1415 and further decline to 0.1332

BTC Corrections Don’t Kill Bull Market. They Power Them1. Primary Trend Structure
Macro trend: Clearly bullish. Price has respected a rising diagonal trendline since the 2022–2023 cycle low. Market structure shows higher highs and higher lows, confirming an intact uptrend.
This is a classic bull market staircase: impulsive advances (green boxes) followed by corrective consolidations (red boxes).
2. Cycle & Time Symmetry Observation
Advancing phases lasting roughly 120–225 days
Corrective phases averaging 80–120 days
Volume tends to expand during upswings and contract during consolidations
This suggests:
Healthy demand-driven rallies
Corrections are time-based rather than price-destructive
Importantly, the current corrective phase (~118 bars) is statistically aligned with prior pullbacks.
3. Current Price Action (Key Focus)
Price is pulling back toward the rising trendline. This is the first meaningful retest after a strong impulsive leg.
Historically, BTC has often reacted positively at this trendline
This zone acts as:
Dynamic support
A decision point between trend continuation vs. deeper correction
4. RSI & Momentum Context
RSI is around 45
This is neutral-to-bullish, not oversold. Momentum has cooled without breaking down
Interpretation:
No bearish divergence visible
RSI reset is consistent with bull market consolidations, not trend reversals
5. Volume Behavior
Declining volume during the pullback
Higher volume during prior upswings
This supports:
Profit-taking, not aggressive distribution
Sellers lack conviction so far
6. Key Levels to Watch
Support
Rising trendline (critical)
Prior consolidation midpoint (green box support area)
Psychological zone near previous cycle high region
Resistance
Recent local highs
Upper range of the last distribution box
Break-and-hold above prior ATH zone would signal continuation
7. Probable Scenarios
Scenario 1: Bullish Continuation (Higher Probability)
Trendline holds
Price forms a base
Next impulsive leg begins → new highs
Scenario 2: Deeper Correction (Lower Probability but Possible)
Daily close below trendline
Retest of prior green box support
On-Chain Confirmation
a) Long-Term Holder (LTH) Behavior
LTH supply remains stable to rising. No evidence of aggressive LTH distribution yet
Interpretation:
Smart money is holding, not exiting.
Exchange Balances
BTC on exchanges continues a structural decline
Indicates:
Reduced sell-side pressure
More cold storage / institutional custody
This supports the idea that pullbacks are liquidity-driven, not supply-driven.
Macro Liquidity Context (Primary Driver)
Global Liquidity (M2 & Financial Conditions)
Bitcoin’s major uptrends historically align with expanding global liquidity, not strictly rate cuts.
Even with policy rates elevated, financial conditions have eased via:
Treasury issuance absorption
Stable banking reserves
Risk-on capital rotation
Implication:
BTC can continue trending higher before rate cuts, as long as liquidity is not contracting aggressively.
ETF & Institutional Flow Impact:
Spot BTC ETFs introduced:
Persistent baseline demand
Structural bid during dips
Even during corrections:
Flows slow, but do not reverse violently
This changes historical cycle dynamics (less violent bear legs)
Risk Signals to Monitor (Invalidation Checklist)
This bullish macro/on-chain thesis weakens if:
Global liquidity contracts sharply
LTH supply begins sustained decline
Exchange inflows spike aggressively
Daily & weekly close below the rising trendline + failure to reclaim
Absent these, pullbacks remain buy-the-dip corrections.

2025 BITCOIN TARGETS: Reality Check
Forecasting is easy. Being right is hard.
1. When Targets Turn Into Illusions
Look at this chart.
Bitcoin at $90,000. Sixteen days left in 2025.
And every “expert” target — JPMorgan, VanEck, Standard Chartered, Tom Lee, Kiyosaki, BlackRock, Cathie Wood —
all of them missed. Every single one.
Why?
Because it’s almost impossible to stay objective when you own the asset you’re predicting.
When you hold a position, your mind paints infinity.
You stop seeing the market — you start seeing your hopes.
You stop analyzing — you start believing.
These price targets were never forecasts.
They were wishful thinking, dressed up as analysis.
2. My Position — Stay Sane
In my posts, I always try to remain objective and grounded.
I don’t trade emotions.
I observe, analyze, and share what I actually see — not what I want to see.
And here’s what I see now:
Those bullish targets might still be achieved one day —
but not by the end of 2025.
Not even by the end of 2026.
According to my cycle analysis, the next real bull market peak will come around 2029.
And even then, it’s hard to name a precise number.
But if history repeats — and each new cycle doubles the previous one —
then levels like $250k, $275k, or even $300k are possible.
Still, even those words must be questioned.
Because the market has one constant lesson — humility.
And those who sound most confident are usually the first to be wrong.
3. Why Bitcoin Will Keep Growing Anyway
Despite all the chaos and uncertainty, one thing remains clear:
Bitcoin will keep growing in the long run.
The reasons are structural, not emotional:
mining difficulty keeps rising,
competition among miners is increasing,
the industry is expanding,
institutional interest is growing,
the circulating supply is shrinking,
the market is becoming more concentrated, leveraged, and volatile.
We’re witnessing moves that a few years ago were unimaginable.
A $20,000 daily swing is no longer shocking — it’s the new normal.
Just look back at October 11th — Bitcoin dropped $20,000 in a single day.
That’s a record.
And it will be broken again.
Because the game keeps escalating.
Bitcoin won’t die.
Unlike thousands of altcoins that fade into oblivion,
Bitcoin has too many players, too much capital, too much gravity to disappear.
4. Where We Are Now
Let’s be honest —
we’re not even halfway through this bear market.
Not even close.
Maybe 20% of the way.
The real pain is still ahead — disappointment, capitulation, and exhaustion.
And not only among retail traders.
Funds, miners, corporations — all of them will face it.
Every cycle demands maximum rejection.
It needs the crowd to give up.
That’s how markets reset.
Bear markets are not crashes — they’re slow, grinding declines that strip away hope.
They don’t destroy capital first — they destroy conviction.
5. The Bicycle Metaphor
If you plan to stay in this market the whole way down,
I’ll compare you to a man riding a bicycle downhill.
He tells himself:
“Yes, I’m going down, but I’ll keep pedaling.
When others quit, I’ll be ahead.”
But the truth is —
when he reaches the bottom,
and the next uphill begins,
he’ll have no strength left to climb.
He’ll be burned out — mentally, financially, emotionally.
He won’t make it up the next mountain.
6. What’s Happening Now
Right now, we’re in a correction phase.
The impulse move is over.
The small bounces you see — they’re not a reversal,
just temporary relief before the next leg down.
This is not the start of a new bull market — it’s a pause between declines.
The macro setup doesn’t support growth yet.
The structure isn’t there.
The market simply isn’t ready.
Every cycle gets heavier.
Each one demands more pain, more time, more cleansing.
7. The Bottom Line
I have no illusions.
No fantasies about instant rallies to $300k.
Only realism and patience.
The market will sort itself out.
But by the time the next real bull run begins,
most of those who are still “pedaling downhill” now
won’t have the energy — or the faith — to climb again.
Best regards, EXCAVO

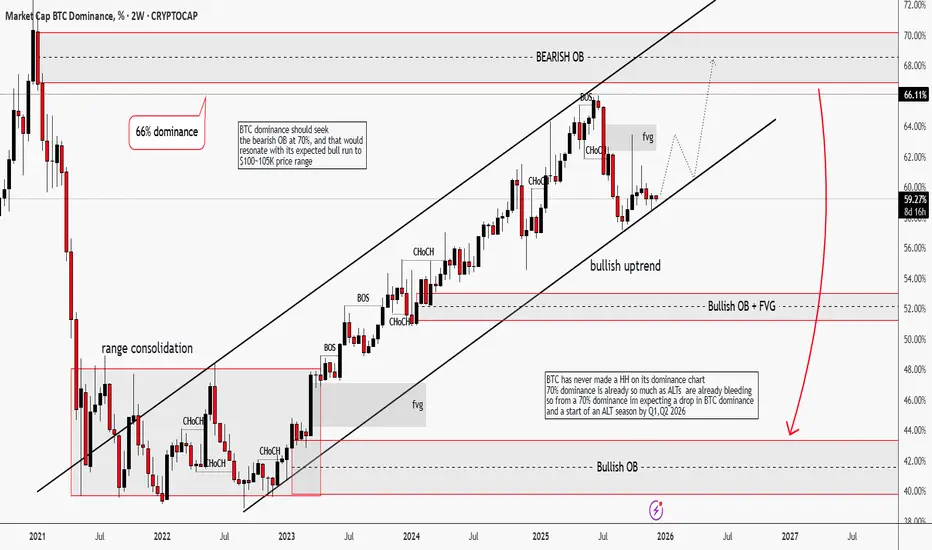
BTC Dominance | Winter is "Almost" ComingHello traders,
Its been a minute since I last checked my wallet, cause I don't love seeing red. Who loves to?
BTC dominance on the 2W timeframe has been in an impulsive bullish uptrend. Structure-wise, it has printed multiple BOS + CHoCH, which tells me that capital are still rotating into Bitcoin, not alts.
What make me believe this further, is that BTC is forming a short-term bullish structure that might target $100-105k price range
Only after BTC dominance reaches 70% area, we might start expecting shift. Distribution on BTC.D and the conditions for an ALT season.
Historically, BTC dominance has struggled to make HH that is why I'm expecting a drop from the previous Bearish OB
TL;DR: BTC dominance shall drop from the range of the bearish OB 70% which shall align with its projected bull run to $100k-105k price range. After that, we can call for ALT season.
Good Luck!
Please drop a like and share your thoughts traders.