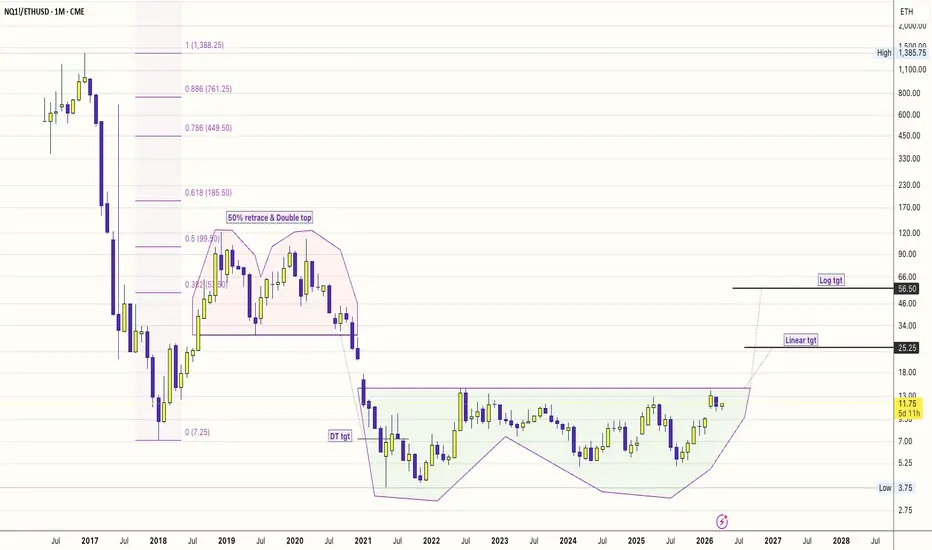
AI Infra > DeFi Infra: The 4-Year Relative Strength Breakout!1. The "Big Base" Logic
Observation: A 4-year base (2022–2026) in the NQ/ETH ratio.
This isn't just a price move; it’s a liquidity migration.
#DeFi (Ethereum) was the hero of the low-interest-rate era (2020-2021).
But in 2026, the "Real World" needs GPUs, data centers, and power grids.
The Nasdaq is the ticker for that physical reality.
The Trigger: Intel’s +24% move and Nvidia’s Blackwell dominance are the fundamental "fuel" for this technical breakout.
2. AI Infra (Hardware) vs. DeFi (Software)
The "Physical" Advantage: AI infra is now a $2.5 Trillion market.
It involves tangible assets (Chips, Fiber, Cooling).
The "Protocol" Fatigue: DeFi has become hyper-fragmented. There are too many L2s and protocols competing for the same liquidity. AI Infra, however, is a bottleneck economy—there is only so much compute to go around.
3. Key Levels
The Pivot: 13.00. A weekly close above this "Neckline" completes the 4-year U-Base.
The Targets: * Target 1 (25.25): The "Linear" target. This assumes Nasdaq continues to grow while ETH stays stagnant—a "repricing of utility."
Target 2 (56.50): The "Blue Sky" log target. This represents a world where AI agents become the primary users of the internet, making traditional human-centric DeFi secondary.
#NQ1! #ETHUSD
#NVDA, #INTC, #BTCUSD
#AIInfrastructure #RelativeStrength #DePIN #MacroEconomy #Semiconductors
In 2026, we’ve moved from "training" models to "running" them (Inference).
Running them requires constant, stable hardware—exactly what the Nasdaq companies are building.
NASDAQ 100 E-mini Futures
No trades
In-depth trading ideas
NQ: One hour_Up Fibonacci_+1,706 Ticks to targetThe NQ one hour time frame is in an up trend.
The market is making higher highs and higher lows.
The market has an up Fibonacci with an extension
price point 27472.50 about +1,706 Ticks above. As
long as the market does not take out the one boundary
price point 25933.75. The expectation is the market
is to U-turn bullish and push to the one hour Fibonacci
extension target.
Entry: Counter trend line break bullish ideally at
26,660.25 or lower (That is when rewards is bigger than
risk.
STOP: 25886.25
LIMIT: 27472.50
Another Entry Idea: If the risk is too large off the one hour
time frame. It will be a good idea to look for long ideas
off the five minute time frame with less risk.

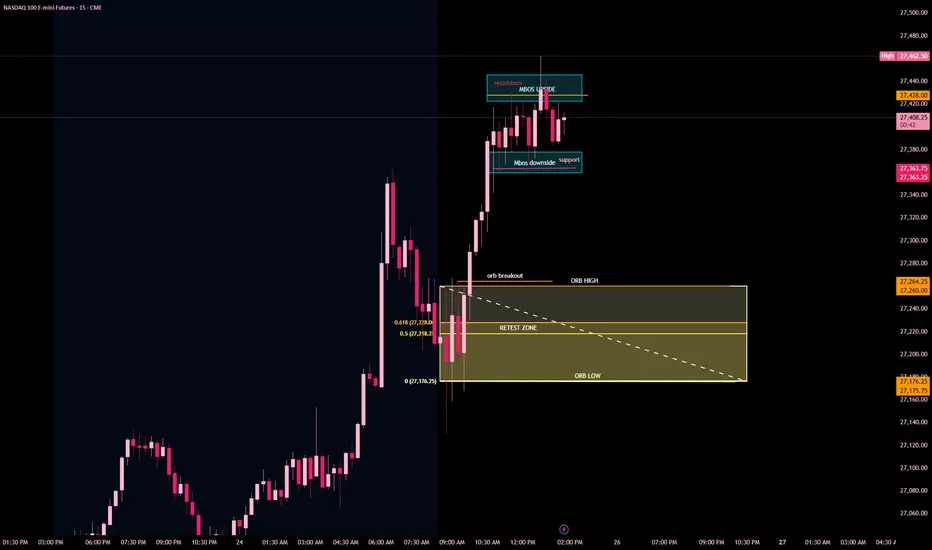
ORB strategy backtest
Planned this as an ORB retest play, but price never gave the clean pullback after the breakout. Instead of forcing it, I waited for an mBOS + momentum confirmation and took the entry there. Different model, same idea just let price lead I will try again with ORB soon
Why I Stopped Building Indicators and Started Building AgentsMost automated trading systems are built like single-purpose machines: one strategy, one set of rules, one set of conditions to meet. They work until the regime they were built for ends, and then they don't.
The interesting question isn't how to make a single strategy more robust. It's whether robustness is the right goal at all — or whether it's better to build systems where individual components can stay narrow, and the coordination between them is where the durability lives.
That reframing changes a lot of things.
It changes how you think about risk. A risk layer that's tangled up with strategy logic has to be reasoned about every time the strategy changes. A risk layer that's a peer to the strategy — making decisions about whether any strategy gets to fire — is a different kind of system. Cleaner to maintain. Harder to bypass accidentally.
It changes how you think about context. Market context — regime, news, calendar, session phase — isn't a feature you bolt onto a strategy. It's its own concern, with its own logic, that informs strategies without being inside them. When context lives in its own layer, every strategy gets it for free, and you can update how context is generated without touching trade execution.
It changes how you think about review. When the parts of a system are loosely coupled and each part's reasoning is logged separately, you stop debugging a black box and start having something closer to a conversation with your own automation. That's a different relationship to the work.
None of this requires the most expensive AI tooling, or the latest model, or any particular framework. It requires being willing to slow down and define what each part of the system is responsible for — and then resisting the temptation to let the parts bleed into each other.
The hardest part hasn't been the trading logic. It's been the architecture: deciding which decisions belong to which layer, and what happens when they disagree.
More on this as the work matures.
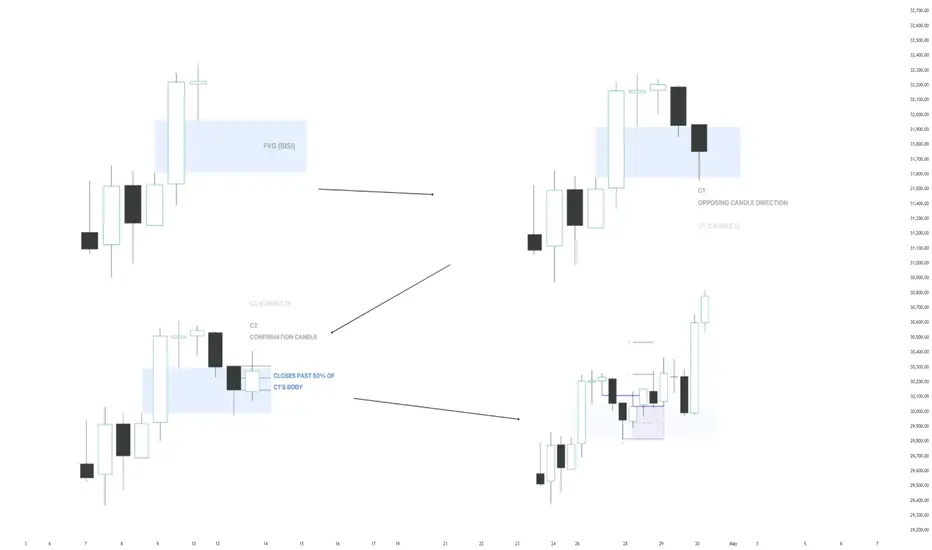
MBZ Model Type 4 - Continuation ModelMBZ Model Type 4 is a continuation pattern built around the failed displacement of a Fair Value Gap, followed by structural confirmation in the original trend direction. Once the formation completes, it projects forward extension levels that mark where delivery is expected to resume after a controlled retracement through prior inefficiency.
Type 4 is the continuation variant in the MBZ Model series. Where earlier types in the series focus on reversal logic at structural extremes, Type 4 is designed to capture the moment a trending market reasserts itself after dipping back into an unfilled imbalance.
Core Concept
The model is built from three sequential candle conditions, each of which must form in the correct order for the setup to be considered valid.
The formation begins with a Fair Value Gap (FVG) delivered in the direction of the prevailing trend. In a bullish scenario this is a Buy-Side Imbalance / Sell-Side Inefficiency (BISI), formed by a three-candle sequence where the high of the first candle sits below the low of the third. In a bearish scenario the inverse condition applies (SIBI). The FVG represents an unfilled price inefficiency and serves as the structural anchor for the rest of the formation.
The next required element is C1, the opposing candle. C1 is a candle whose direction opposes the prevailing trend and which displaces into the FVG region. In a bullish setup C1 is bearish and pushes price back down through the imbalance, representing a counter-trend reaction tapping into the inefficiency. C1 alone does not validate the model — it only sets the conditions for confirmation.
The setup is completed by C2, the confirmation candle. C2 must close past 50% of C1's body in the original trend direction. This close demonstrates that the opposing displacement of C1 has failed, that participants have rejected the counter-trend move, and that delivery is resuming in the direction of the underlying bias.
The mid-body close is the threshold that locks in confirmation.
When all three conditions are satisfied in sequence — FVG, C1, C2 — the MBZ Type 4 formation is valid, and the projection phase begins.
How To Use
Type 4 is a discretionary read on price action, not a standalone signal. After a valid formation appears, the C2 confirmation candle serves as the entry reference, the T4 zone as structural invalidation, and the 1/2/4 projections as staged objectives for the continuation leg.
The model is most reliable when higher-timeframe bias is aligned with the direction of the FVG and when the formation occurs after a clean impulsive leg rather than inside choppy consolidation. It is intended to be applied within a broader framework of market context and bias, not in isolation.
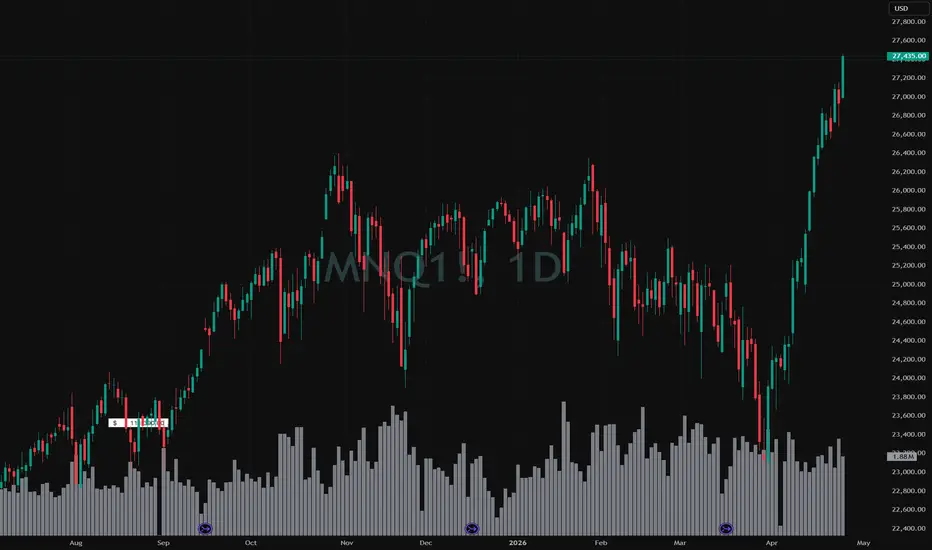
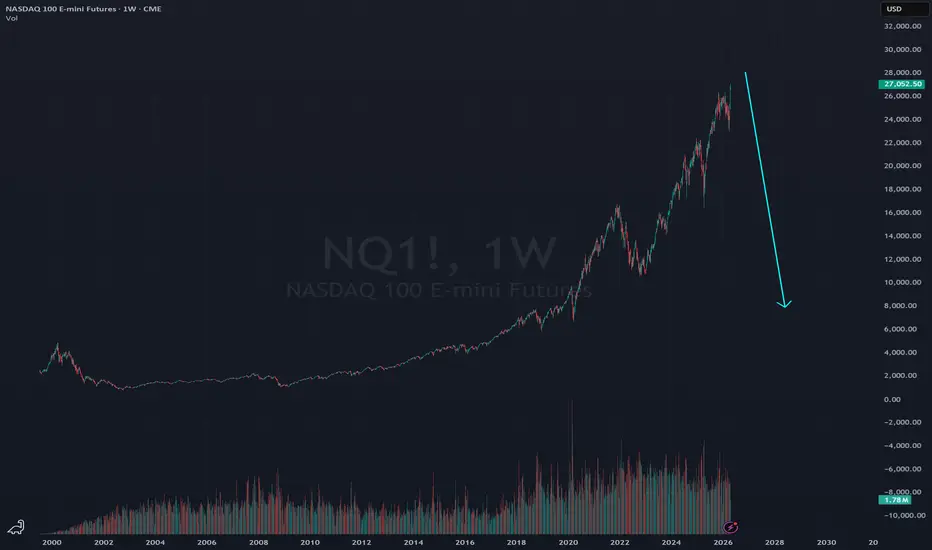
DANGER WILL ROBINSON DANGER!Going to say it now - we make new ATHs and then something black swan-like (probably credit) will destroy the market shortly after. Maybe they give us a few weeks, or a few months, but this will eventually happen. Too much stress under the foundations of our financial and economic system. If you want me to do a deep dive on what could be coming, tell me below!
So you are aware - Sovereign Alpha is not tuned to trade on the daily chart, so that is why it looks the way it does. Sure, I should have tweaked the settings for the post, but I forgot and am not a perfectionist. Or neurotic. Lol.

The end game, stagflation by 2027 then depression by 2029The generational economic cycle is closing the doors soon. Hard days are coming ahead and many will rush to exit doors. The oil shock impact will be fully in effect by YE in all sectors and supply chains. Hyperinflation will be fought by rising interest rates to record levels leading to a recession (similar to 70s post oil embargo situation but worse this time). Unemployment will exceed 2008 levels and will drag the world's economy into a depression. Energy stocks might be the best hedge against what's about to take place, yet, cash is king. A reset of the economy will take place by 2030. Any paper profits not realized before the mother of stock market crashes will never be recovered. Cash holders will have the opportunity of a life time to buy quality companies at insane low prices below real valuations. Interest paid on cash will be 10% or more to fight the hyperinflation. Have a plan and start to prepare your exit strategy. BTFD won't work any more, any dead cat bounce will be opportunity to sell at a lower loss.
Be safe...
NQ Range (04-20-26)NAZ out above prior churn zone, looking for a pull back this week. Down yellow is the PB move, yellow at 27,200 is target and start of turn zone that goes to 28k. The CZ started in 2025, we had the 1,500 point move below and looking for the same above CZ only to return back into the CZ. Above 28k would be the breakout. Prior Post's have mentioned my view of the drop to pop (as we have seen last week). However, the move may have come too quick and too much O/N PA. Looking for some gap filling prior to potential 28k BO. Should the drop test not bounce, strong short.

Nasdaq - time to make a drop Nasdaq - time to make a drop
price of nasdaq - overextended ofthen price come back to vwao
that's why i think we can see $25 000 - 25 500 this week
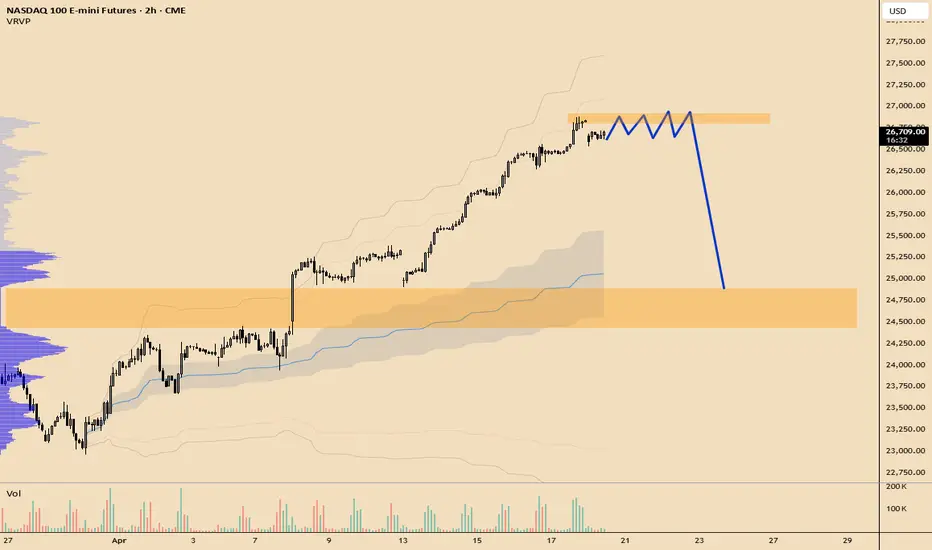
The Nasdaq Peak: Why Smart Money Is Scaling Out of NAS100The Nasdaq 100 is currently displaying classic signs of an overextended market, and if you’re still chasing the long side here, you might be providing the exit liquidity for smart money. In today's analysis, we break down the NAS100 price action, why the lack of daily red candles is a major red flag, and how to position yourself for the inevitable mean reversion. 📉
As professional traders, we prioritize logic over FOMO. We’ve seen a perfect trend with thin liquidity following a significant accumulation phase. While retail traders are jumping in at the highs, institutional players are likely scaling out. I’m walking you through my counter-trend sell thesis based on Volume Profile and market structure.
What we cover in this video:
Volume Profile Analysis: Why the current Value Area High (VAH) is a critical rejection zone. 📊
Liquidity Gaps: Identifying where price is likely to "snap back" to fill thin volume areas.
The Fade: My specific targets for a move back through the Value Area toward the Point of Control and Value Area Low. 🎯
The market doesn't move in a straight line forever. Understanding the shift from accumulation to distribution is what separates profitable traders from the herd.
Risk Disclaimer: Trading involves significant risk of loss and is not suitable for all investors. The content in this video is for educational and informational purposes only and does not constitute financial advice. Always perform your own due diligence before entering any trade.

NQ: One Hour_+3,009 Ticks to Fibonacci ExtensionThe NQ one hour time frame is in an up trend.
The market is making higher highs and higher lows.
The market has an up Fibonacci with an extension
price point 27472.50 about +3,009 Ticks above. As
long as the market does not take out the one boundary
price point 25933.75. The expectation is the market
is to U-turn bullish and push to the one hour Fibonacci
extension target.
Entry: Counter trend line break bullish ideally at
26,660.25 or lower (That is when rewards is bigger than
risk.
STOP: 25886.25
LIMIT: 27472.50
Another Entry Idea: If the risk is too large off the one hour
time frame. It will be a good idea to look for long ideas
off the five minute time frame with less risk.

NQ Targets (04-27-26)NAZ to revisit Mid Level of prior Churn Zone, Turn Zone may be between Top Orange TL and upper triangle top. The Orange TL's & upper channel started at NAZ 13,500 on 10/2022. Shaded Zone or Churn Zone started on 9/2025 and the Blue lines are open levels of 2026 & 2025. Bounce off 23,000 was 6% below CZ and came out of a Diablo TL. The lift zoomed through the CZ and has now hit upper orange TL. This lift has been by way (mostly) of Overnight price action and on normal volume in the Reg Sessions. Any selling or rejection inside the Triangle may support a retest of ML of CZ for next move. "Buy in May" may revert back to "Sell in May" and if not trading will be small lifts up with zero pull backs or selling, until October.

NQ (Nasdaq-100) Analysis, Key-Zones, Setup for Thursday (April 2Nasdaq-100 futures printed a decisive recovery session on Wednesday, with NQM26 settling at 27,083.00 higher by 448.25 points or 1.68 percent. The day's range ran 26,727.75 to 27,136.00, and the high marks a fresh 52-week and all-time record, 63 ticks above Tuesday's intraday high of 26,901.75. The path of the session was an overnight fade to the low, a strong European-to-NY-morning advance that cleared 27,000, consolidation into midday, and a final push into settlement that tagged the new ATH.
Market Structure:
Higher-timeframe trend unambiguously bullish. Price trades above every major moving average, with the 5-day at 26,755.85, the 20-day at 25,141.49, the 50-day at 25,043.12, the 100-day at 25,458.71, and the 200-day at 25,192.50. The 5-day over 200-day spread expanded to roughly 1,563 points, the widest of the April melt-up. Multi-indicator composite lifted to 72 percent buy, improving from 56 percent a week ago and flipping hard from a 100 percent sell reading one month ago. Momentum reads deep in overbought territory: 9-day RSI 81.68, 14-day RSI 74.32, stochastic 14-day %K 95.29 / %D 96.00, ADX 9-day 40.32 with +DI 37.53 against negative directional 10.73. The 9-day ATR of 456.25 and the 14-day ATR of 479.62 bracket expected range.
Key Levels:
Resistance:
27,645 computed pivot 3rd resistance stretch upside
27,390 computed pivot 2nd resistance, aligned with 2nd standard-deviation 27,398
27,236 computed pivot 1st resistance
27,171 multi-indicator composite target price
27,135 today's ATH, aligned with dealer Combo 3 concentration (NDX 27,009 map)
27,126 dealer Large Gamma 2 concentration (NDX 27,000 map)
27,056 dealer Combo 4 concentration (NDX 26,930 map)
Support:
26,982 computed pivot point, first downside magnet
26,878 14-day RSI 70 reading
26,828 computed pivot 1st support, aligned with 1st standard-deviation 26,860
26,826 dealer Call Wall map (NDX 26,700)
26,727 today's low
26,634 previous close
26,574 computed pivot 2nd support
26,416 dealer volatility inflection map (NDX 26,290)
26,420 computed pivot 3rd support stretch downside
25,562 dealer gamma flip map (NDX 25,436)
Tech Drivers:
Mag7 Leadership: TSLA reported Q1 at 16:05 ET Wednesday and beat estimates, with shares advancing in the after-hours session. IBM beat Q1 (operating EPS 1.91 versus 1.81, revenue 15.92 billion versus 15.67 billion). Positive single-stock lift into Thursday's Nasdaq open.
Semiconductors: 16-session advance, the longest such rally on record. Semiconductor leadership is the dominant Nasdaq narrative into the April 29 FOMC window.
AI Sentiment: NVDA-Anthropic partnership framework from Tuesday remains constructive; Commerce Secretary Lutnick confirmed zero China H200 sales as of today, treated by the market as already-discounted.
Fed Policy: WH Senior Adviser Hassett opened the possibility of rate cuts running alongside balance-sheet reduction, a dovish tilt for duration-sensitive growth. April 29 FOMC is terminal event risk for the month.
Volatility: Broader equity-volatility conditions moderated with Iran ceasefire extension; real-time hedging flow in the broader index complex printed +6.1 billion on the session, upper-decile cumulative delta reading.
News and Sector Analysis:
Three macro catalysts drove the day. The administration extended the Iran ceasefire and stepped back from Tuesday's threat to resume bombing, easing the geopolitical premium. The earnings profile stayed constructive across IBM, Boeing, Philip Morris, and TSLA after hours. Hassett's dovish framework reached directly into tech valuations. Brent settled near 102 per barrel, well contained given the continuing US blockade of Iranian-linked vessels. The 20-year bond auction cleared at 4.883 percent high yield with 2.680 bid-to-cover, indicating no supply indigestion at the long end. The combination of de-escalation, earnings strength, and dovish signaling compounded into the 1.68 percent advance.
On dealer positioning, NQ currently trades 257 points above the primary Call Wall map at 26,826, placing price in the extended "pinned-above-wall" environment. Sellers of upside calls at the 27,126-27,135 Combo 3 concentration must delta-hedge by selling NQ futures into strength above that shelf, mechanically capping the move absent a new catalyst.
Primary Setup:
Direction: Short
Entry Zone: 27,135 to 27,171 on a retest of today's ATH and the dealer Combo 3 concentration shelf
Stop Loss: 27,245 above R1 27,236 with a small buffer
Target 1: 26,982 computed pivot point, first downside magnet
Target 2: 26,878 14-day RSI 70 reading
Rationale: Fresh ATH tagged at settlement with 9-day RSI at 81.68, stochastic 14-day %K above 95, and price closed 257 points above the primary dealer Call Wall map. Entry zone sits at the Combo 3 / Large Gamma 2 / today's ATH confluence where mechanical call-selling hedging pressures price. Stop is structural beyond R1. Targets stack on computed pivot and the RSI 70 reading.
Alternate Setup:
Direction: Long
Entry Zone: 26,828 to 26,880 on a pullback to S1 / Call Wall reclaim / 14-day RSI 70 zone
Stop Loss: 26,760 below the 1st standard-deviation support 26,860 and today's low zone
Target 1: 27,083 Wednesday's settlement
Target 2: 27,135 today's ATH / Combo 3 shelf
Rationale: If price holds above the dealer Call Wall map on a pullback, the positive-gamma environment reasserts: dealers buy weakness and sell strength, stabilizing the intraday range.
Bias:
Two-way with a mild upside skew that is heavily conditional on the 09:45 ET Flash PMI read. The trend is positive on every higher-timeframe measure, cumulative options delta prints upper-decile, and the semiconductor cohort is in a record advance. Offsetting, momentum is stretched on 9-day and 14-day windows, price closed 257 points above the primary dealer Call Wall map, and today's ATH was posted into settlement with no time to retest.
Night Session Forecast (Asia/Europe, 18:00 ET to 08:00 ET):
Directional bias slightly positive into 03:15 to 04:00 ET European Flash PMI prints. Expected range 26,982 to 27,171. A clean hold of 27,000 through Asia opens a retest of the 27,135 ATH. European PMIs sub-50 would lean price toward 26,982 pivot without a directional break.
Morning Session Forecast (08:30 ET to 12:00 ET):
The 08:30 ET Initial Jobless Claims (consensus 210k, prior 207k) and 09:45 ET US S&P Flash PMI (Services 50.6 consensus, Manufacturing 52.5 consensus, Composite 50.6 consensus) are the decisive inputs. A Services PMI above 50.6 with Manufacturing above 52.5 projects a push through 27,135 toward R1 27,236. An in-line to slight-miss PMI projects 26,878 to 27,083 consolidation. A PMI miss below prior readings pushes price to S1 26,828 and tests Call Wall reclaim.
Afternoon Session Forecast (12:00 ET to 16:00 ET):
Expected chop around the morning's established direction. The 13:00 ET 5-year TIPS auction is the only scheduled macro input; a hot tail would lift long yields and weigh on Nasdaq. Absent a surprise, afternoon drift should respect the dealer Combo 3 shelf at 27,135 on the upside and the Call Wall map at 26,826 on the downside.
Thursday April 23 Events:
03:15 ET French Flash PMI Manufacturing, Services, Composite
03:30 ET German Flash PMI Manufacturing, Services, Composite
04:00 ET Eurozone Flash PMI Manufacturing, Services
08:30 ET US Initial Jobless Claims consensus 210k, prior 207k
08:30 ET US Continued Jobless Claims consensus 1.8165M, prior 1.818M
09:45 ET US S&P Flash PMI Services 50.6 c, Manufacturing 52.5 c, Composite 50.6 c
10:00 ET US Trade Representative Greer speaks
11:00 ET ECB's Nagel speaks
13:00 ET US 5-Year TIPS auction high yield and bid-to-cover
19:30 ET Japanese CPI Overall Nationwide consensus 1.4 percent YoY
How I'm seeing it:
Bullish on the trend but cautious on the immediate chase given overbought momentum and the mechanical dealer cap at 27,126-27,135. A PMI beat would clear the shelf and open R1 27,236. A PMI miss would test the Call Wall reclaim at 26,826. Between those two outcomes, consolidation 26,950 to 27,170 is the central expectation. The TSLA after-hours beat supports a firm overnight profile but does not change the dealer positioning map.
Good Luck !!!

NQ Targets (04-24-26)NAZ on the edge of the channel, key Friday to Monday play. The typical move is up from Friday into Monday close. We did have a 2 way move yesterday and this has been propped up by the O/N going into the Reg Session. We do have a Failed Auction zone at 26,750, this may get a retest should the Open Drive sell off (usual move) after the O/N Pump into the big volume Dump. Highly doubt that we pass 27,400, rejection here would send it to 26,750, no hold look for 25,500 (over next days). Passing 27,400 may try for 28,200 (no volume needed) and may come in the Overnight (mostly) or gap up type PA.

NQ APRIL 21 PLANBullish bias on NQ today with futures holding green on strong tech sentiment, so today I will be look for a liquidity sweep low based on my scenario 1 and 2 by reclaim of Friday low, Overnight Low and even Friday Low range for continuation toward prior highs, but be cautious of early fake breakout to the upside due to geopolitical volatility—if price rejects highs and breaks structure below VWAP or EMA shift bearish targeting session lows; overall I expect a volatile two-sided day rather than clean trend unless momentum confirms early.

NQ: One hour Up Fibonacci_+2,707 Ticks to targetThe NQ one hour time frame is in an up trend.
The market is making higher highs and higher lows.
The market has an up Fibonacci with an extension
price point 28165.25 about +2,707 Ticks above. As
long as the market does not take out the one boundary
price point 26535.00. The expectation is the market
is to U-turn bullish and push to the one hour Fibonacci
extension target.
Entry: Counter trend line break bullish ideally at
27304.75or lower (That is when rewards is bigger than
risk.
STOP: 26484.75
LIMIT: 28165.25
Another Entry Idea: If the risk is too large off the one hour
time frame. It will be a good idea to look for long ideas
off the five minute time frame with less risk.

Is NQ Topping Out After SMT + C2 Signal? Next Move Lower or FakeSEED_ALEXDRAYM_SHORTINTEREST2:NQ Multi-Timeframe Outlook (Clean Read)
Higher Timeframe Context (Daily)
- We’ve printed a C2 reversal candle → this is not random, it signals potential shift in delivery
- Internal Range Liquidity + Devil’s Mark acting as reference points
- If C3 confirms → expect expansion phase to the downside
👉: This is no longer a “buy every dip” environment. Market is preparing for a repricing move
4H Context (Where the shift started)
- Clear 2-stage SMT / strength failure at highs
- Highs were taken but no continuation → classic distribution behavior
- Price now compressing instead of expanding higher
👉 This is important:
Strong markets don’t stall at highs, they expand.
This one didn’t → weakness.
1H Execution View (Where the trade is)
- Price retraced into H1 SIBI (premium)
- Structure shows:
- Expansion → Consolidation → Manipulation (SMT)
- Now transitioning into distribution phase
👉 This is where you act, not guess.

Impulse Base/Buy-the-Dip/Micro-balance 1.Clear, prior balance i.e. price acceptance
***multiple rotations
***a series of overlapping, sideways bars
***volume concentration (HVN)
"This base = balance = price acceptance = fair market value."
AMT (Auction Market Theory) term: short-duration balance, micro-balance
Traders' terms: buy-the-dip zone, impulse base, pullback zone
2.Clear, unmistakable move from balance to imbalance, from price acceptance to price rejection
***one or more bars reject the balance
***price leaves and doesn't return
***volume shifts from two-sided to one-sided
One side INITIATED a rejection of the balance in order to find a new balance - a new fair market value.
AMT term: rejection of value
Traders' term: impulse bar
3.Initiative continuation
***directional bars
***no return to base
***volume
There must be follow-through. If price returns it is noise not initiative.
AMT term: imbalance, price discovery
Traders' term: expansion, impulse leg
4.First pullback test
***first pullback must be toward the base
***base must act as support/resistance
***base must be defended by INITIATIVE buying/selling NOT merely RESPONSIVE buying/selling.
NOTE: This is why a VALID TRADE requires micro-balance in relation to VWAP, followed by a micro-hinge (compression i.e. volatility collapse), followed by an impulse bar. This is ALL-IMPORTANT.
AMT term: return to prior acceptance
Traders' term: base retest
Terms can be confusing. This is meant to be a glossary - a definition of terms. This is also the chart I will use as we begin this new trading week - 04/26 - 05/01/2026.

Dominant StructureMajor directional expansion coming
HVN clusters near apex
Heartbeat: 26715 - 26739
Compressing, coiling, building, maturing = breakout is coming
It seems to be waiting for good news regarding the flow of traffic through the Strait of Hormuz.
Micro-hinges that form inside this Macro-hinge are tradeable for small amounts. Valid bull entry = price above VWAP + balance + micro-hinge + impulse bar. Flip the script for a bear trade.
You know institutions are watching this hinge.
Respect the hinge or you will be chopped up.

NASDAQ: Climbing against a wall of worryNasdaq futures have recently shown strength, breaking above resistance at 26,399. As a result, we’re allowing for a bit more upside in the near term.
Primary Scenario
In the primary scenario, we believe an interim correction has concluded. We expect an initial high to form above 26,399. The low of the following pullback should occur in our green Target Zone (24,509–23,624). After reaching this zone, Nasdaq is expected to rally toward our red Target Zone (27,252–29,700), where the final high of the larger upward move should be established. Afterward, NQ is likely to enter a significant correction.
Alternative Scenario
Alternatively, the index could face renewed selling pressure and drop below support at 23,027. In this case, we would expect a lower correction low in our green Alternative Target Zone (22,602–21,429) before another move higher (probability: 30%).
Long-Term Outlook
On the monthly chart, after the larger upward move completes within our red Target Zone (27,252–29,700), we anticipate a broad correction. We expect its low only within our green Target Zone (10,084–5,649). Alternatively, the index could bottom in our green Alternative Target Zone (16,314–13,199), establish a sustainable base there, and then resume its upward trajectory (probability: 33%).

NQ (NASDAQ, QQQ) Analysis, Key-Zones, Setup for Wed (Apr 22)NQ printed a fresh 52-week high at 26,901.75 in the morning session and was rejected with pace, fading through the New York afternoon to close at 26,634.75, lower by 114.00 points or 0.43 percent on the day. Underlying Nasdaq-100 cash finished at 26,569.70 while the Volatility Index climbed to 19.49 and crude oil surged 3.64 percent to 92.79. The immediate driver was renewed Iran geopolitical tension alongside tight US crude inventories, and the combination was enough to remove the benefit-of-the-doubt premium that had been extending to rate-sensitive growth names into the record print.
Session internals confirmed the rejection read. Price closed beneath session VWAP 26,728.75, beneath yesterday's point-of-control 26,730.50, and beneath the intraday high. The 9-day relative strength index sits at 80.51 and the 14-day at 72.45, both squarely in overbought territory. The composite technical opinion composite now reads 56 percent buy weakening after having flipped from 96 percent sell one month ago, indicating the net-buy signal is mature rather than fresh. Every major moving average sits below price (20-day at 25,009.95, 50-day at 25,011.91, 200-day at 25,175.29), so the uptrend remains intact, but the 10.35 percent extension over the 20-day is the widest it has been in this leg.
Market Structure
The primary trend across the weekly and daily is bullish. Price is above every major moving average and the 14-day directional index of 30.33 (with +DI 30.03 vs -DI 16.33) confirms a strong trending market. Shorter windows, however, read overbought with 14-day stochastic %K and %D at 96.21 and 97.42. The all-time high 26,901.75 was made intraday and then rejected by more than 350 points, establishing near-term supply. Yesterday's volume profile value area is 26,661.50 to 26,780.50 with point-of-control 26,730.50. Today's close sits below the entire value area.
Key Levels
Resistance:
26,703.83 First overhead pivot, acts as immediate magnet on any bounce
26,760 Dealer Call Wall and Absolute Gamma confluence (QQQ proxy)
26,847.67 R1 and rejection shelf from today's session
26,996.58 R2 and round-number 27,000 confluence
27,165.42 R3 and stretch upside target
Support:
26,579.92 S1, above 1st standard-deviation support 26,554.70
26,551.75 Session low (today)
26,411.08 S2, second standard-deviation zone
26,287.17 S3, stretch downside
25,490 Dealer Volatility Trigger on the broad Nasdaq gamma curve
Primary Setup (Short)
Direction: Short
Entry: 26,840 to 26,900 on a retest of today's rejection shelf near R1
Stop: 26,955 (above today's all-time high with a small buffer)
Target 1: 26,703.83 pivot
Target 2: 26,580 (S1 / dealer-support confluence)
Rationale: Fresh all-time high rejected with an expanding volatility complex, deeply overbought short-term momentum, and a crude-oil-driven macro headwind against rate-sensitive growth. Entry sits at the supply shelf where today's reversal formed; stops sit beyond structural invalidation. Tesla earnings after Wednesday's close add binary overnight risk and size should reflect the implied-move exposure.
Alternate Setup (Long)
Direction: Long
Entry: 26,560 to 26,600 on a pullback to S1 and dealer Zero-Gamma zone
Stop: 26,500 (beneath today's low)
Target 1: 26,703.83 pivot
Target 2: 26,847.67 R1
Rationale: Primary trend remains strong across every major moving average, S1 sits on the 1st standard-deviation support, and the dealer positive-gamma mechanics would be expected to slow downside acceleration near this zone. Invalidates on a decisive break of 26,500.
Bias
Two-way with a mild downside skew into Wednesday's cash session. Structural trend says higher, short-term momentum says overbought and rejected, dealer positioning says range-bound around QQQ 644 to 645 (NQ 26,720 to 26,760), and Wednesday after-close carries an asymmetric single-stock risk through Tesla at 16:05 ET. A decisive break-and-hold above 26,760 reopens the path to R2 26,996 and 27,000. A break below 26,560 accelerates into 26,411 with limited dealer-gamma support until 23,500.
Night Session Forecast (4:00 PM ET Tue through 9:00 AM ET Wed)
Overnight tone biased to consolidation with two event risks. Japan Total Trade Balance and Imports at 19:50 ET are likely non-events for Nasdaq futures unless JGB yields move. The UK headline and core CPI release at 02:00 ET is the consequential catalyst, with headline forecast to cool to 3.0 percent from 3.3 percent and core to hold at 3.2 percent. A downside surprise lifts global duration and supports a bid toward 26,703 pivot. An upside surprise pressures yields and pushes NQ toward 26,580 S1 and below. Expected overnight range 26,550 to 26,780.
Morning Session Forecast (9:30 AM through 12:00 PM ET Wed)
Opening bell digests whatever tone was set overnight by the 02:00 ET UK CPI release. Boeing earnings at 07:30 ET and AT&T at 09:30 ET are secondary sentiment inputs. The near-term price logic pivots on the 10:30 ET EIA weekly crude oil inventory release: another large draw extends Tuesday's oil-inflation trade and pressures NQ into 26,580; a build or in-line result relieves pressure and opens the 26,700 pivot as magnet. First-hour expected range 26,580 to 26,760. Disciplined entries wait for the 9:45 ET mark after the opening range forms.
Afternoon Session Forecast (12:00 PM through 4:00 PM ET Wed)
The 13:00 ET US 20-year bond auction is the early-afternoon event. A soft tail with low bid-to-cover pressures NQ toward 26,580 by reigniting duration concerns; a clean auction lets the index rebuild toward 26,703 and potentially 26,760. Into the close, price action trades in anticipation of two after-close earnings prints: Tesla at 16:05 ET and Texas Instruments at 16:30 ET. Expect position-reduction flows as 15:30 ET approaches, with implied volatility on Nasdaq ETF options likely to expand 10 to 15 percent ahead of Tesla results. Cash close zone 26,580 to 26,760.
Good Luck !!!

Panduhh's NQ BlueprintHi! Here are the newest pivot updates. I also laid out Elliott Wave Structure as well as a Wyckoffe "Jump the Creek" pattern we are possibly in right now.
The previous pivots were reaction points for the last few trading sessions and today we broke through R3 with the announcement of a ceasefire with Iran. We are in a very headline driven market and the opens movement (which played off previous pivots perfectly) proves it.
I would like to see reaction tomorrow to this area as it is an elliott wave point for middle structure. I will post another idea that reveals the pivot points between these levels so it can be used intraday.
Trade well!
------------------------------------------------------------------------------------------------------------------
These are the equilibrium levels for the current structure in the NQ futures
Levels are derived from internal framework using structure and geometric relationships—not time-based inputs.
Focus is not on prediction, but on order flow response at price.
Reaction at each level determines outcome:
– Acceptance → continuation within value
– Rejection → rotation away
– Failure → discovery beyond the range

NQ (Nasdaq-100) Analysis, Key-Zones, Setup for Mon (Apr 27)
Nasdaq-100 futures settled Friday at 27,441.00, up 507.00 points or 1.88 percent, a decisive breakaway session that cleared the 27,155.75 prior all-time-high on volume and closed within two points of the session high. Price now trades in clean-air territory above every prior overhead reference, with the 27,100 to 27,155 zone converting from resistance to defended support. The advance extended the chip-cohort leadership that has defined the April move, with the QQQ cash proxy up 1.91 percent in near-lockstep and Nvidia adding 4.32 percent on the session as the single-name accelerator at the semiconductor epicenter.
Market Structure
Higher-timeframe trend remains decisively bullish. Price trades above every major moving average in a widening linear stack: 5-day 27,110, 20-day 25,720, 50-day 25,180, 100-day 25,510, 200-day 25,260. Momentum reads deep overbought and has not yet flagged divergence against the new high, with 9-day RSI near 81, 14-day near 76, 20-day near 70. The stochastic stack sits saturated across 9, 14, and 20-day windows above 95 percent. 9-day directional index prints near 46 with positive directional index 38 versus negative directional index 9, a strong-trending environment with dominant buyer control. Multi-indicator composite lifted to 96 percent BUY from 88 percent Thursday and 72 percent mid-week, with the April V-reversal now fully embedded in every short- and medium-term signal group. 14-day statistical expected range 453 points or 1.68 percent; a one-band projection from Friday's settle brackets Monday at roughly 26,988 to 27,894, a meaningful range expansion on the breakout.
Key Levels
Resistance
27,930 one-ATR upper band from Friday's settle, outer edge of the statistical Monday range
27,740 R3 pivot resistance and 2 standard-deviation upper band
27,640 1.618 Fibonacci extension and dealer call-concentration mapping, primary hedge-selling wall above Friday's close
27,540 R2 pivot and dealer call-concentration mapping, high-probability reaction zone on continuation
27,460 Friday intraday high, immediate overhead test on Monday's open
27,440 Friday settle and Globex close, first pivotal reference for overnight direction
27,400 session-magnet shelf and R1 pivot area, intraday fulcrum on controlled pullback
27,360 daily pivot-point, session-midpoint magnet that defines bullish-versus-neutral character on the open
Support
27,300 Monday S1 pivot-point, first structural pullback zone on any early rotation
27,260 1 standard-deviation lower band and breakout-retest reference above the prior all-time-high region
27,200 dealer large-gamma-concentration mapping and prior-week high area, layered institutional-support zone
27,155 prior 52-week and all-time intraday high from Wednesday, critical flip-level from resistance to support
27,100 100-handle round and dealer gamma-concentration mapping, last defense of the breakout zone
27,053 Thursday intraday high, pre-breakout overhead reference and secondary support magnet
27,000 psychological round-number and dealer positioning mapping, next meaningful support below the breakout zone
26,900 dealer Call-Wall mapping from prior session structure, most important institutional pivot-below-spot
Broader Market Drivers
Three inputs defined Friday's advance. The Intel and Texas Instruments after-hours reports on Thursday extended 18 percent plus overnight and flowed into Friday's cash open as direct positive leverage through the chip and analog sub-indices. Macro readings softened constructively for tech duration, with the dollar index easing 0.27 percent to 98.53 and the US 10-year yield retreating 1.6 basis points to 4.301 percent, a net supportive read for long-duration growth equities into the Wednesday Federal Reserve rate decision. Institutional risk appetite concentrated in mega-cap technology rather than broad-market participation; the Dow futures complex finished down 0.18 percent on the day, which is the standard narrow-breadth signature for Nasdaq outperformance windows that historically continues one to two sessions before either broadening out or rolling over on rotation.
The Magnificent-7 reporting block around the Wednesday, April 29 session defines the week's positioning rhythm. Amazon, Meta Platforms, Microsoft, and Alphabet all report around that session, with Apple the following week. No Magnificent-7 reports on Monday itself, which lets the session digest the weekend positioning-reset and the Friday after-hours residual rather than trade a single-stock catalyst. The 16-session semiconductor advance that preceded Friday's close is the longest such run on record in the Nasdaq-100 complex and remains the dominant cross-sector theme into the mid-week positioning window.
Geopolitical background remains two-sided. The US-Iran peace-talk process is stalled, and WTI crude eased to 95.16 on Friday after the Thursday push, which relieved a portion of the energy-premium drag on inflation expectations. Any restart-of-talks headline is the overnight fat-tail catalyst on either side, with a breakdown accelerating the duration-supportive bid and a breakthrough pressuring long-end yields on risk-on reallocation.
Volatility and Positioning
The VIX closed 18.70, down 3.11 percent on the session, completing a full cycle through the prior-week elevated readings. Nasdaq-100 volatility ran lower in confirmation of the broad-market compression, and the VXN against VIX spread held near unchanged, removing the tech-stress signal that intermittently precedes rotation breaks. Dealer-positioning stability at the broad-market level sits near 30 percent, the mid-band historically consistent with controlled-continuation windows rather than imminent reversal. Cumulative options-flow on the QQQ cash proxy ran positive throughout Friday and closed with a bullish signature, a constructive read on institutional positioning.
QQQ is the 95-percent-plus correlated options-flow proxy for Nasdaq-100 futures; the futures contract carries no directly liquid options complex, so QQQ flow drives the Nasdaq-100 cash index and by extension NQ futures at a structural premium. Observed dealer-concentration structure on QQQ 663.88 places hedge-selling zones near 668 and 667 above spot in layered confluence, a volatility-inflection level near 662, and a dealer gamma-flip level near 661. Mapped to NQ futures at the observed premium, the actionable confluences for Monday are NQ 27,640 at the extended concentration shelf, NQ 27,540 at the secondary concentration mapping, NQ 27,360 at the volatility-inflection mapping, NQ 27,260 at the dealer gamma-flip overlay, and NQ 27,200 at the layered large-gamma institutional-support shelf.
Options metrics on the QQQ proxy round out the read. The 14-day statistical expected range holds above 450 points on NQ, and implied volatility sits in the lower third of the trailing 30-day window. Multi-indicator composite reads 96 percent BUY with every short-term and medium-term signal group at 100 percent BUY. Put-call volume leans call-heavy into the Monday open on the QQQ weekly expiry, consistent with positive-delta hedge demand and supportive of the upside-biased environment. The complex reads insured rather than complacent going into the Federal Reserve decision window.
Forecast:
Overnight: Globex reopens at 6:00 PM ET Sunday carrying the residual after-hours bid. Japanese preliminary industrial-production and Asian tech-cohort prints (TSMC, Samsung, Sony, SoftBank) through the Sunday evening window set the initial Nasdaq tone. European morning brings the German IFO stack at 4:00 AM ET with Business Climate consensus near 86.0, a European-tone driver. Bias constructive with an upside skew on the chip-complex residual; expected Globex range 27,340 to 27,560, with asymmetric upside on a Sunday headline catalyst.
AM Session: Monday carries no scheduled tier-one US data. The 9:30 AM ET cash open digests overnight headline flow and the weekend positioning-reset ahead of the Wednesday Federal Reserve rate decision. If NQ holds 27,400 through the open, the 27,540 concentration mapping is the first upside target. If 27,360 pivot fails in the first hour, the 27,260 breakout-retest is the first support test and the 27,200 institutional-support shelf becomes the session-defining battle line. Expected first-hour range 27,360 to 27,500.
PM Session: Afternoons ahead of a Wednesday Federal Reserve rate decision historically drift, with positioning hedges layering through the 2:00 to 3:30 PM ET window and compressing intraday swings. If the morning holds above 27,400, the move drifts into the 27,540 mapping by 3:00 PM ET. If the morning breaks below 27,260, the reaction is a bounce attempt to reclaim 27,360 followed by a second wave lower into the 3:30 to 4:00 PM ET window on profit-taking ahead of the week's main event stack. The 4:00 PM ET cash close sets positioning into the 10:00 AM ET Tuesday Consumer Confidence release.
Daily Close: Bias mildly bullish with a tight-range skew. Most likely close range 27,420 to 27,520, pivotal decision level 27,360 on pullback and 27,540 on continuation. A sustained afternoon hold above 27,400 resets the scenario to primary-continuation; a break below 27,260 into the 3:30 PM ET window activates the downside-retest scenario with 27,100 as the extension target.
Expected Range: 27,340 to 27,560 NQ (220 points). Implied 1-Day Move 0.8 percent on QQQ.
Most Likely Path: Path A (45 percent): Pullback-and-reclaim, opens above 27,440, trades a shallow dip into 27,360 to 27,400, reclaims into 27,500, consolidates between 27,400 and 27,540 through the afternoon; a plus 0.2 to plus 0.5 percent session. Path B (25 percent): Pin-and-chop, opens flat, trades a 27,400 to 27,500 range all session on light data and weekend positioning-reset; a plus or minus 0.2 percent day. Path C (20 percent): Break-and-retest lower, opens soft, fails the 27,360 pivot in the first hour, tests 27,260 by mid-morning, bounces back to 27,360 into the afternoon; a minus 0.3 to minus 0.6 percent session. Path D (10 percent): Continuation acceleration, opens strong on Sunday headline, clears 27,540 by the 10:30 AM ET window, extends into 27,640 by lunch; a plus 0.7 to plus 1.0 percent day.
Monday Events:
- 04:00 AM ET German IFO Business Climate (consensus 86.0) and Expectations / Current Conditions stack
- 09:30 AM ET US cash market open, first-order event for NQ absent scheduled prints
- 09:45 AM ET Chicago PMI data window varies; secondary macro input if released
- No scheduled tier-one US releases; the open itself is the event
- No Magnificent-7 earnings scheduled for Monday
- Tuesday, April 28 preview: Conference Board Consumer Confidence at 10:00 AM ET (KEY Tuesday first-order event)
- Wednesday, April 29 preview: Federal Reserve Rate Decision at 2:00 PM ET with Powell press conference at 2:30 PM ET, plus Amazon, Meta Platforms, Microsoft, and Alphabet earnings grouped around the session
How I'm seeing it:
- Friday printed a wide-range impulse candle that broke the 27,155 prior all-time high on volume and closed within two points of the session high, a bull-continuation session with unfinished business above rather than exhaustion.
- Daily candle structure is continuation-bullish with no distribution signal, 4-hour frame shows an uninterrupted sequence of higher-highs and higher-lows from the April 7 low with no change-of-character trigger on any structural reference.
- Dealer-positioning mapping above 27,540 activates mechanical call-concentration hedging that caps acceleration absent a fresh catalyst, while the 27,200 layered large-gamma zone anchors pullback absorption below the breakout; 27,260 is the precise line whose failure flips the setup from continuation to retest.
- Binary catalysts into the session are a US-Iran peace-talk headline in either direction and a semiconductor-export policy shift from the Commerce Department, both capable of producing 150-point plus moves on release.
- Cross-asset read is constructive with the VIX down 3.11 percent, the dollar index easing, and long-end yields softening modestly; the Magnificent-7 earnings block around Wednesday remains the single largest source of directional risk through the week rather than Monday itself.
- 14-day RSI near 76 and 9-day near 81 are deep overbought but inside a strong-trending environment confirmed by 9-day directional index above 45; the level whose failure flips the framing is 27,000, below which the 200-point cushion that defines the bullish-continuation thesis is lost.
- Primary Setup: Long NQ 27,360 to 27,400, stop 27,260 (below the 1 standard-deviation lower band and breakout-retest reference), T1 27,540 (R2 pivot and dealer call-concentration mapping), T2 27,640 (1.618 Fibonacci extension and extended concentration shelf), T3 runner 27,740 (R3 pivot and 2 standard-deviation upper band, contingent on continuation through 27,540 without material rotation). R:R to T2 roughly 2.7:1.
- Alternate Setup: Short NQ 27,260 after 15-minute failure and close below the breakout-retest reference, stop 27,320 (above the reclaim line on the 1 standard-deviation lower band), T1 27,200 (dealer large-gamma institutional-support shelf), T2 27,155 (prior all-time-high flip-level retest), T3 runner 27,100 (dealer gamma-concentration mapping, contingent on negative dealer flow and positive VXN expansion). R:R to T2 roughly 1.8:1. Size smaller until 27,155 is decisively lost on a daily close.
- Invalidation: Sustained 15-minute close below 27,260 negates the Primary Long thesis and activates the Alternate short structure; a sustained daily close below 27,155 with positive VXN expansion and negative dealer flow unlocks the 27,100 to 27,000 downside retest band. On the upside, a decisive daily close above 27,640 with strong internals unlocks 27,740 to 27,930 as the next extension band into the Wednesday Federal Reserve session.
Monday frames as a decision-session between continuation of the Friday breakout and a mean-reversion retest of the 27,155 flip-level as the Federal Reserve rate decision positioning window begins. The session carries no scheduled tier-one data, so structure and dealer-positioning mechanics drive the session. Risk-management into the Wednesday, April 29 event stack favors tight stops and smaller size until the decision-session resolves, with the 27,260 to 27,540 band defining the operational range for the session.
