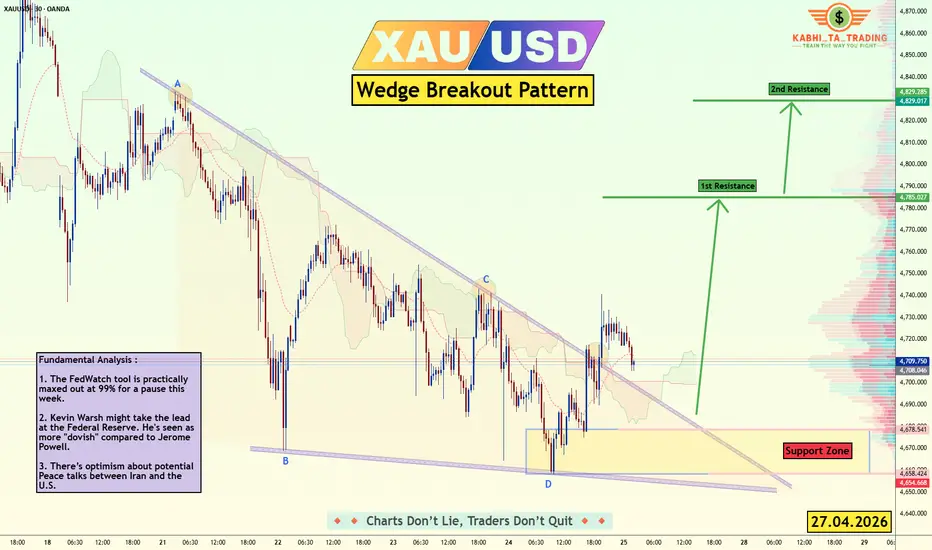
BUY XAU/USD - Wedge Breakout (27.04.2026) XAU/USD is showing a potential wedge breakout pattern after price reacted strongly from the marked support zone. Gold has broken above the descending wedge trendline, suggesting that bullish momentum may be building for a move toward higher resistance levels. OANDA:XAUUSD
Support Zone:
The key support zone is around 4,658 – 4,678. This area acted as the main demand zone where buyers stepped in.
1st Resistance:
The first upside target is around 4,785.
2nd Resistance:
If bullish momentum continues, the next resistance level is around 4,829.
Fundamental Analysis :
1. The FedWatch tool is practically maxed out at 99% for a pause this week.
2. Kevin Warsh might take the lead at the Federal Reserve. He's seen as more "dovish" compared to Jerome Powell.
3. There’s optimism about potential Peace talks between Iran and the U.S.
Disclaimer ⚠️
This analysis is for educational purposes only and is not financial advice. Always use proper risk management, wait for confirmation, and trade according to your own strategy.
#XAUUSD #Gold #GoldTrading #ForexTrading #ForexAnalysis #WedgeBreakout #BuySetup #PriceAction #TechnicalAnalysis #TradingView #KABHITATrading
Support the idea with a like, comment, and follow for more gold trading analysis.
Fundamental Analysis
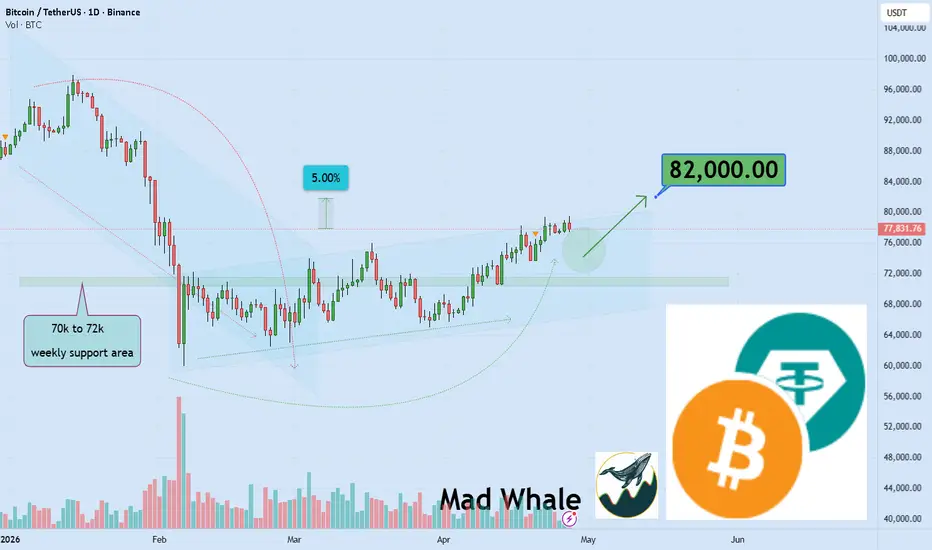
Uptrend channel hints at 5% move to $82k for BTCHi,
Technically speaking, we’ve got a clean uptrend channel and a seriously strong weekly support holding things together, so I’m eyeing at least a 5% move up with a target around $82,000 📈🚀. Fundamentally though, there’s some weird-but-good stuff bubbling under the surface that makes me feel the market wants to climb higher 🤔✨. And yes, I said feel don’t laugh just yet 😄. It’s that oddly reliable “trader instinct” you get after staring at charts and candles day and night for years 👀. Sounds a bit mystical, sure, but it’s really just experience in disguise so if this target hits, don’t just celebrate, start training that instinct of yours too.
Need a little love!
We pour love into every post your support keeps us inspired! Don’t be shy, we’d love to hear from you on comments. Big thanks
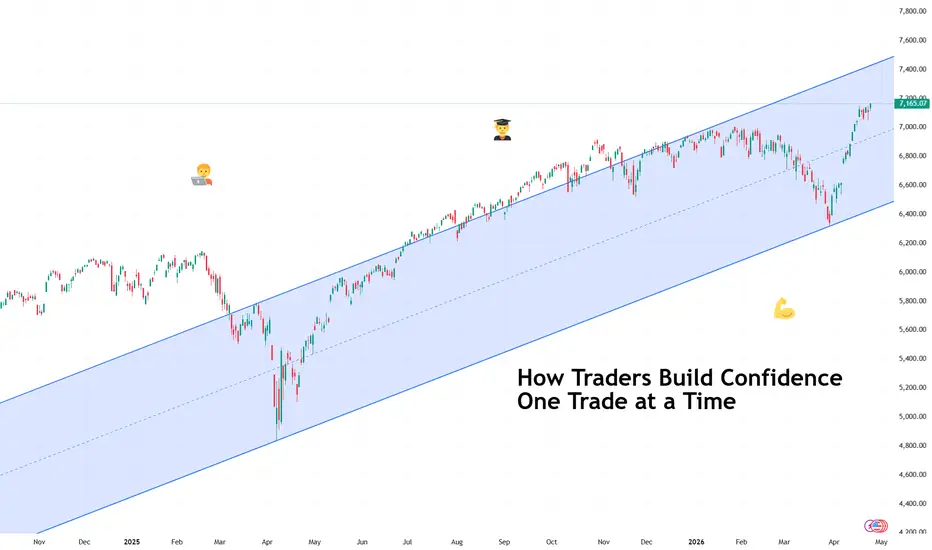
How Traders Build Confidence One Trade at a TimeAnd how you can too.
🧭 Confidence Starts Smaller Than You Think
Confidence in trading rarely arrives as a dramatic breakthrough moment. It usually begins quietly, somewhere between a well-timed entry and a disciplined exit that followed the plan exactly as intended.
Many traders expect confidence to appear after a winning streak. In practice, it grows from consistency rather than excitement. One correctly executed trade builds trust. Two reinforce it. Ten start to feel like structure instead of luck.
Confidence forms when your process begins to feel familiar.
📊 The First Ingredient Is a Repeatable Plan
A repeatable plan means knowing what conditions justify entering a trade and what conditions suggest waiting. Traders sometimes call this a ‘setup,’ which simply describes a recognizable pattern or environment that increases probability.
When traders follow setups consistently, outcomes become easier to interpret. A losing trade feels manageable because it still followed the rules. A winning trade becomes meaningful because it confirms the approach.
Confidence grows faster when decisions feel intentional rather than improvised. (And yes, that includes no revenge trading .)
🧠 Small Wins Train the Mind
Early confidence rarely comes from large profits or the hot trade of the day . It develops through smaller moments that prove discipline works. Waiting patiently for a setup. Respecting position size. Closing a trade according to plan instead of emotion.
These actions build psychological stability. Stability is a big one because markets constantly test patience, timing, and expectations. Sometimes, more than most people can handle.
Over time, repetition turns uncertainty into familiarity, and familiarity makes decisions calmer.
⏳ Reviewing Trades Builds Real Clarity
Professional traders treat review as part of the strategy rather than an afterthought. Looking back at past trades helps identify patterns that charts alone cannot reveal.
A trading journal, which could simply be a record of entries, exits, and reasoning, often becomes one of the most powerful confidence tools available. It transforms memory into evidence. Evidence strengthens conviction.
Confidence feels stronger when supported by observation rather than guesswork.
📉 Losses Still Play a Role
Losses contribute to confidence when they occur inside a structured plan. A controlled loss confirms that risk management is working as intended. Risk management refers to limiting how much capital is exposed on any single idea so that no individual trade can cause lasting damage.
Traders who manage risk effectively begin trusting their ability to stay consistent across changing market conditions (think a wild earnings season or surprise economic data ).
🚀 Confidence Changes How Trades Feel
As confidence grows, hesitation begins to fade. Entries feel clearer. Position sizes feel more appropriate. Decisions arrive with less urgency and more perspective.
Confidence isn’t predicting the market correctly every time — no one can do that, not even your favorite hedge fund bro. It means understanding your approach well enough to execute it without second-guessing each move.
🎁 OK, But How?
Confidence develops through repetition, structure, and reflection rather than dramatic breakthroughs. Each disciplined trade adds another layer of trust between the trader and the process.
Over time, those layers become something powerful: the quiet certainty that you can navigate uncertainty one decision at a time.
Off to you : How do you know you’ve developed enough confidence to be a successful trader? Share your approach in the comments!
EURJPY - The end of the correction will lead to an uptrend FX:EURJPY remains in a bullish trend. Signs of the correction coming to an end are emerging, which generally gives the market a chance to continue its upward movement.
The currency pair has been in a bullish trend since last March. Technically, the bullish structure remains intact. The weak Japanese yen is supporting the euro’s upward movement.
Technically, the price is breaking through the resistance of the local correction and local consolidation. If the bulls keep the price above 186.8–186.87, we can expect growth to continue in the medium term.
Resistance levels: 187.92, 187.70
Support levels: 186.87, 186.43
A retest of 186.87 and price consolidation above that level will confirm the price’s readiness for growth. Zones of interest: 187.7–187.95
Best regards, R. Linda!

Gold Pauses as Markets Await US–Iran DevelopmentsGold Pauses as Markets Await US–Iran Developments
Gold is well-positioned to rise at the moment, but the fact that the US and Iran seem unwilling to let go of the ropes could push the talks forward.
This is creating a pause in OIL and GOLD this week. The market will wait for a possible deal before moving.
If Gold starts moving before we have any news, it could be from insider trading that may know something in advance.
Even if gold moves down, we should be careful as it could rise again quickly given the geopolitical situation, but now also the economic one, which is not good.
You can find more details on the chart.
Thank you and good luck! 🍀
⚠️PS: Do your own analysis and use your own strategy to join the trade.
❤️ If this analysis helps your trading day, please support it with a like or comment ❤️

XAUUSD | 474x Sellers’ stronghold or the calm before a breakoutThere are times when the market moves with clarity.
And there are moments like now — gold is simply hovering, consolidating, testing traders’ patience.
After the pullback from 489x, price is compressing inside a range, and all eyes are now on 474x — the first major stronghold for sellers.
Key resistance levels:
474x — the most important resistance right now
477x — next upside test if 474x breaks
4795–4800 — major structure-defining zone
Key support levels:
467x — near-term support
464x — important lower boundary
4607–4600 — deeper support zone
My view
As long as 474x hasn’t been reclaimed decisively, I still lean toward a range-trading / scalp mindset, rather than chasing breakout moves.
Below 474x → market remains in a tug-of-war.
Break above 474x → potential move toward 477x.
Break above 4800 → then the broader narrative may shift.
For now, the market feels like it’s holding its breath ahead of bigger catalysts.
And often, after this kind of compression… comes a meaningful move.
Do you see 474x as a distribution zone for sellers, or a launchpad for a breakout?
Drop your view below — let’s discuss the next possible scenario.

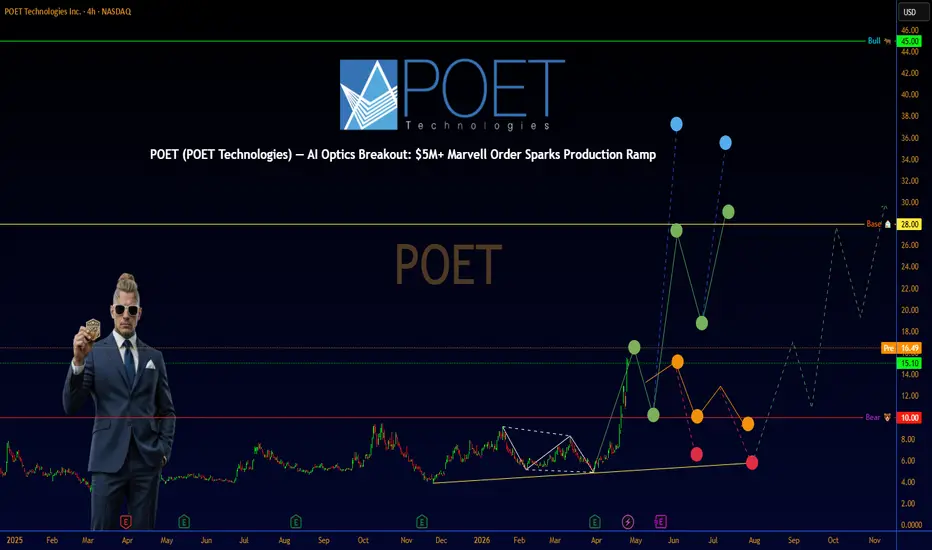
POET (POET Technologies) — AI Optics Breakout: $5M+ Marvell Ordr💡 POET (POET Technologies) — AI Optics Breakout: $5M+ Marvell Order Sparks Production Ramp
**SECTION 1 — Executive Summary** 💼
POET Technologies is at a pivotal commercialization inflection with its Optical Interposer platform solving critical power and bandwidth bottlenecks in AI data centers just as hyperscalers accelerate 800G/1.6T+ optical interconnect deployments. Recent confirmation of production orders exceeding $5 million from Marvell-linked customers plus massive capital raises position the company for its first meaningful revenue ramp in 2026. Overall rating: Buy. 12-month price target: $28 (blended DCF and peer comps methodology incorporating initial optical engine shipments plus TAM capture in AI photonics). The single biggest reason to own this stock right now is POET’s disruptive wafer-scale integration technology delivering lower cost/power optical engines at the exact moment AI infrastructure demand is exploding. The single biggest risk is execution slippage on volume production scaling against well-funded competitors.
**SECTION 2 — Business Overview** 🏢
POET Technologies develops and commercializes advanced photonic integrated circuits using its proprietary Optical Interposer platform that integrates lasers, modulators, detectors, and waveguides onto a single silicon chip for high-speed optical data transmission. Revenue breakdown (latest available): Primarily non-recurring engineering (NRE) and early product revenue from optical engines and light sources with 100 percent tied to AI/data center and telecom applications (no geographic split publicly detailed yet). Business model generates revenue through design wins, NRE fees, and high-margin optical engine/module sales with future recurring potential via licensing and volume shipments to hyperscalers and module makers. Competitive moat comes from patented passive alignment and wafer-scale semiconductor manufacturing that eliminates costly active alignment steps used by traditional photonics players delivering superior cost, power efficiency, and scalability for 800G/1.6T+ AI interconnects.
**SECTION 3 — Financial Deep Dive** 📈
Key metrics (most recent publicly available as of Q4 2025 ended Dec 31 2025; source: company filings Apr 1 2026):
Revenue: $341k (Q4 2025) vs $29k (Q4 2024); TTM ~$1.07M.
Net income: -$42.7M (Q4 2025).
EPS: -$0.32 (Q4 2025, non-GAAP context similar).
Gross margins: Not yet meaningful at commercial scale.
Free cash flow: Negative reflecting R&D and ramp investments.
YoY growth rates: Revenue +1,075 percent (Q4) but from tiny base; net loss improvement on per-share basis.
Balance sheet health: Cash and equivalents ~$430M post-2025/early-2026 financings; low debt; strong liquidity.
Cash flow quality: Operating cash flow negative but aligned with pre-revenue ramp phase (no red flags).
Capital allocation: Heavy focus on R&D, manufacturing partnerships, and production scale-up with recent equity raises funding AI optics acceleration.
**SECTION 4 — Growth Analysis** 🚀
Total addressable market (TAM): Global optical transceiver market projected to reach $27.6B by 2030 (CAGR 16.8 percent 2026-2030 per industry reports); AI-specific segment within silicon photonics/optical engines exceeding $20B+ opportunity by late 2020s. Current market share: Nascent but first production orders signal entry into high-growth AI segment. Key growth drivers for next 3-5 years: Initial shipments of POET Infinity optical engines (800G/1.6T), partnerships with module makers (Lessengers, LITEON), and hyperscaler adoption for AI clusters. Management guidance points to 2026 as inflection with 30k+ engine shipments targeted; analyst consensus more cautious near-term but aligned on long-term optics boom. Growth primarily organic via proprietary platform rather than acquisition-dependent.
**SECTION 5 — Valuation** 📊
DCF analysis: Base case assumes revenue ramp to hundreds of millions by 2028-2030 on optical engine adoption, 40 percent+ gross margins at scale, WACC 12 percent (reflecting early-stage risk), terminal growth 4 percent . Implied value supports $28 target. Comparable company analysis (peers as of April 2026): Broadcom, Marvell, Coherent (optics proxies) trade at 20-40x forward sales on AI growth; early-stage photonics names at premium to revenue. Historical valuation range (limited): Pre-commercial volatility with recent surge. Bull target $45 (accelerated 1.6T+ wins); Base $28; Bear $10 (delayed shipments). Current price ~$15 offers ~87 percent upside to base target.
**SECTION 6 — Risk Analysis** ⚠️
1. Production execution and yield ramp delays (high probability/impact): Triggered by manufacturing scale challenges; watch quarterly shipment updates and partner confirmations.
2. Intense competition from established photonics players (medium-high): Broadcom, Intel, Ayar Labs; monitor design win announcements.
3. Dilution from additional capital raises (medium): Though cash is now strong; track balance sheet updates.
4. Macro/AI capex slowdown (medium): Hyperscaler spend cuts; watch big-tech guidance.
5. Regulatory/PFIC tax or listing risks (low-medium): Recent U.S. redomicile plans mitigate; monitor shareholder vote.
Short interest elevated but declining post-rally per recent data. Insider activity shows confidence via retained holdings. No major accounting quality flags.
**SECTION 7 — Catalyst Calendar** 📅
Next earnings date: Mid-May 2026 (Q1 2026 results with likely production update). Upcoming events: First optical engine shipments targeted Q3 2026; potential additional design wins from Foxconn/Luxshare. Macro events: AI infrastructure capex announcements from NVIDIA/Meta/Google. 12-month timeline: Q2 earnings August, volume production milestones late 2026, potential U.S. listing progress.
Global optical transceiver market exploding on AI demand underpins massive TAM.
AI-specific optical engine packaging trends show clear shift toward co-packaged solutions where POET competes.
**SECTION 8 — Technical Analysis** 📈
Primary Chart: Daily timeframe, 1-year view shows explosive breakout in April 2026 from multi-month base around $5-7 to new 11-year highs near $15+ with massive volume. Price action well above both 50-day and 200-day moving averages confirming strong uptrend. RSI (14) elevated but not extreme (~70+ on surge days) with room before overbought; MACD bullish crossover with expanding histogram. Major support zone $10-12 (prior breakout), resistance $18-20. Visible chart patterns: Clear higher highs/lows since March lows plus volume climax on news. Technical implication: Bullish continuation into May earnings if momentum holds with potential for further extension on positive updates.
**SECTION 9 — The Verdict** 🏆
Bull case ($45 target, 35 percent probability): Multiple design wins and 2026 shipments exceed expectations driving re-rating to AI infrastructure leader.
Base case ($28 target, 45 percent probability): Steady order execution and cash burn management deliver first profitable trajectory.
Bear case ($10 target, 20 percent probability): Ramp delays or competitive losses lead to dilution and sentiment reset.
Expected value calculation: Probability-weighted price target = $28.50. Final recommendation: Buy with High conviction. The 30-second elevator pitch: POET is the rare early-stage photonics pure-play with proven tech, massive cash, and first commercial orders exactly as AI data centers demand cheaper/faster optical engines — positioning it for explosive growth in a $20B+ TAM.
**Sources**
POET Technologies Investor Relations (poet-technologies.com) Q4 2025 results and MD&A Apr 1 2026; Yahoo Finance/Seeking Alpha financial data and news Apr 2026; company press releases on Marvell/Celestial AI orders Apr 2026; industry reports on optical transceiver market (Business Research Company, LightCounting) 2026 forecasts; MarketBeat/TipRanks analyst commentary Apr 2026.
What are your thoughts on POET? Drop them below 👇
#POET #AIOptics #SiliconPhotonics #OpticalInterposer #DataCenterAI #MarvellOrder #PhotonicsStock #800G #1.6T #AIBoom
Gold Price Outlook – Trade Setup (XAU/USD)📊 Technical Structure
OANDA:XAUUSD Gold remains in a range-bound structure, with the 4,737–4,743 resistance zone acting as the upper boundary and the 4,679–4,686 support zone holding as the lower boundary.
After rebounding from support, price is now moving back toward the upper range but has not confirmed a breakout. The latest structure suggests fading upside momentum near resistance, creating a potential sell-on-rally setup.
Short-term bias: Bearish within range
🎯 Trade Setup (Sell on Resistance)
Entry Zone: 4,737 – 4,743
Stop Loss: 4,748
Take Profit 1: 4,686
Take Profit 2: 4,679
Risk–Reward Ratio: Approx. 1:5.37
📌 Invalidation:
A sustained break above 4,748 would invalidate the bearish setup and shift the structure toward bullish continuation.
🌐 Macro Background
Gold has some macro support from US-Iran peace hopes, softer oil prices, and lower Fed hike expectations. However, with the FOMC meeting ahead and price still capped below resistance, buyers may hesitate near the upper range.
🔑 Key Technical Levels
Resistance Zone: 4,737 – 4,743
Support Zone: 4,679 – 4,686
Invalidation Level: 4,748
📌 Trade Summary
Gold is approaching resistance within a range structure.
Preferred strategy: Sell near resistance, targeting a move back toward the support zone.
⚠️ Disclaimer
This analysis is for reference only and does not constitute trading advice. Financial markets involve significant risk; proper risk and position management are essential.

XAUUSD Breakdown from Wedge – Bearish Pressure Below ResistanceGold is currently trading around the 4730 region, positioned at a critical zone following a shift in near-term momentum.
🔍 Market Structure Insight (1H):
Price action reflects increasing bearish pressure after a breakdown from a wedge structure and a move below the 21-period moving average. This signals weakening bullish momentum, with sellers gaining control in the short term.
📈 Bullish Scenario:
If price reclaims and sustains above the 4740 resistance level with strong momentum, it may trigger a recovery toward the 4880 supply zone as buyers regain control.
📉 Bearish Scenario:
Due to:
= Strong US Dollar limiting upside
= Ongoing geopolitical tensions capping gains
= Technical breakdown and weak structure
If price remains capped below the 4730–4740 resistance zone, gold may continue its downside move toward the 4510 demand zone.
⚠️ Key Levels to Watch:
Resistance: 4740
Support: 4510
💡 Trading Idea:
Watch for rejection near resistance or continuation signals below current levels. A confirmed reclaim above resistance would shift short-term bias.
This is just a personal market view based on price action, not financial advice.
#Gold #XAUUSD #Forex #TradingView #PriceAction #TechnicalAnalysis

BTC: Waiting For The Price To Exceed 79420BTC: Waiting For The Price To Exceed 79420
BTC has been moving in a clear uptrend for about 1 month since it reached 65K.
The price tested 65K on March 29, 2026 and since then BTC has been slowly rising showing clear bullish accumulations.
For the price to rise further, BTC needs to move above the new pattern or above 79420.
Only if it moves above 79420 will the new impulse wave start again.
Main Targets:
82600
86000
You can find more details on the chart.
Thank you and good luck! 🍀
⚠️PS: Do your own analysis and use your own strategy to join the trade.
❤️ If this analysis helps your trading day, please support it with a like or comment ❤️

EUR/USD: Both ECB and Fed will talk, markets will listenThe previous week started with Retail Sales figures in the US. In March this indicator was increased by 1,7% m/m, above market estimates of 1,1%. On a yearly basis, retail sales increased by 4%, highly above estimated 2,4% y/y. The S&P Global Composite PMI flash for April was standing at 52,0, modestly above forecasted 49,9. Friday brought the University of Michigan Consumer Sentiment final for April of 49,8, just a bit above expected 47,6. The five year inflation expectations were modestly increased to 3,5% from previous 3,2%.
The Producers Price Index in Germany in March was increased by 2,5% for the month, but still holding a negative territory for the year of -0,2%. Figures were above market forecasts of 0,8% m/m and -0,2% y/y. The ZEW Economic Sentiment Index in the Euro Zone in April was standing at -20,4, while in Germany it reached -17,2. Both indicators were lower from market estimates. The S&P Global Manufacturing PMI flash for April in Germany was at the level of 51,2, and in line with market expectations. The same indicator for the Euro Zone reached 52,2. The Ifo Business Climate in April in Germany was at the level of 84,4 just a bit lower from estimated 85,4.
The previous week was a relatively calm one on the currency side. The EUR/USD currency pair was moving in a relatively shorter range, where EU currency continued to be modestly pressured. On the opposite side, the US currency was under a short relief related to expected positive developments in the Strait of Hormuz and dropping prices of oil. The week started with a rejection of the 1,18 resistance line, and moved toward the lowest weekly level at 1,1670 which was also rejected on Friday. Weekly closing price was 1,1722. The RSI modestly dropped to the 51, however, closed the week at the level of 53. Investors are still perceiving the overbought market side, rather than the opposite one. The MA50 crossed the MA200 and continued to move below it, indicating a potential trend change in the coming period.
The previous week was a relatively calmer one, but the week ahead promises to bring increased volatility. A lot of important macro data will be released for both US and EU, and most importantly, both ECB and Fed will decide on interest rates. Wednesday and Thursday will be extremely sensitive days, where central bankers will talk and the market will listen and adjust their positions according to expectations on future macro developments. Current charts are pointing to an equal probability for moves toward both sides. A move toward the upside will push eur/usd to test 1,18, the next resistance level. On the opposite side, in case that 1,1670 is broken down, then levels to watch will be 1,1640 down to 1,16 support line.
Important news to watch during the week ahead are:
EUR: GfK Consumer Confidence for May in Germany, Economic Sentiment in April in the Euro Zone, preliminary inflation rate in Germany in April, Retail Sales in March in Germany, Unemployment rate in April in Germany, GDP Growth rate flash for Q1 in Germany and the Euro Zone, Inflation rate in the Euro Zone flash for April, Unemployment rate in the Euro Zone in March, ECB meeting and interest rate decision for euro will be held on Thursday, April 30th.,
USD: Building Permits preliminary in March, Durable Goods Orders in March, Housing Starts in March, FOMC meeting and interest rate decision will be held on Wednesday, April 29th, PCE Price Index in March, Personal Income and Personal Spending in March, ISM Manufacturing PMI in April.

SHIB/USDT: Day-Swing Setup | Entry, TP & SL Mapped🐕🦺🔥 SHIB/USDT — "SHIBA INU vs. TETHER" 💵
🎯 CRYPTO MARKET PROFIT PATHWAY SETUP | Day Trade / Swing Trade
"The Thief never enters the market blindly — we stalk the setup, then strike with precision." 🦅
🗺️ THE THIEF'S MASTER PLAN — BULLISH PATHWAY 📈
Direction: 🟢 BULLISH (Conditional — Awaiting Resistance Breakout)
⏳ Waiting For Resistance Breakout @ 0.0000064
The Thief's intelligence team has identified a critical breakout level at 0.0000064 USDT. Price must close convincingly above this zone on meaningful volume before any entry is considered valid. No breakout = no entry. We are disciplined operators, not gamblers. 🎯
🚀 ENTRY STRATEGY
🔰 Entry Trigger: Any price level after a confirmed, clean breakout above 0.0000064 USDT
🔰 Entry Method: Wait for candle close above resistance → confirm volume surge → enter on the retest or breakout momentum
🔰 No pre-entry. No FOMO. Patience is the sharpest weapon in the Thief's arsenal. 🗡️
🎯 PROFIT TARGETS — THE ESCAPE ROUTE
📍 Target 1 (T1): 0.0000072 USDT
📍 Target 2 (T2): 0.0000080 USDT
⚠️ Police Force Zone Warning: The price area above T1 acts as a strong resistance cluster — historically loaded with overbought conditions, institutional traps, and sharp reversal triggers. This is where the market police set their ambush. Smart Thieves book profits here and don't get greedy. 👮♂️🚨
💬 "Dear Ladies & Gentlemen — Thief OG's — I am NOT recommending you fix only my TP levels. Your profit strategy is your own choice. Make money, then TAKE money. That is the Thief's Golden Rule. Trade at your own risk, always." 🤝
🛑 STOP LOSS — THE THIEF'S ESCAPE HATCH
🔴 Thief SL: 0.0000058 USDT
Positioned below the key multi-year accumulation floor to protect capital against false breakouts and sudden market-maker sweeps. A stop loss is not weakness — it is the Thief's armour. 🛡️
💬 "Dear Ladies & Gentlemen — Thief OG's — I am NOT recommending you use only my SL level. Capital management is a personal discipline. Make money, then protect money. Your risk, your rules." 💼
🔗 RELATED PAIRS TO WATCH — CORRELATION DASHBOARD 🌐
Keep your eyes on these correlated and momentum-driven pairs to gauge broader market direction:
🔸 DOGE/USDT — The original meme coin godfather. When DOGE pumps, retail FOMO floods SHIB hard. High direct positive correlation. DOGE longs are currently sitting at 70% on Binance futures Spoted Crypto, signalling retail bullish bias in the meme sector.
🔸 PEPE/USDT — The newer meme rival. In April 2026, PEPE has dropped more than 80% from its peak while SHIB has fallen below key support levels Gate.com — both are consolidating simultaneously. A PEPE recovery often ignites a SHIB sympathy rally.
🔸 ETH/USDT — The mother chain. SHIB is an ERC-20 token — Ethereum gas costs, network congestion, and ETH price sentiment directly impact SHIB on-chain activity and ShibaSwap volume. ETH recovery = SHIB tailwind.
🔸 BTC/USDT — The macro king. BTC dominance sits at 58.1% with global crypto market cap holding at $2.68 trillion Spoted Crypto. When BTC breaks above $80,000 decisively, altcoin and meme coin liquidity rotates aggressively. Watch BTC closely.
🔸 BONE/USDT — The Shiba ecosystem governance token. BONE is SHIB's ecosystem partner powering ShibaSwap and Shibarium transaction fees. Strength in BONE = on-chain ecosystem activity = supportive for SHIB.
🔸 LEASH/USDT — The scarcity token within the Shiba ecosystem. Works as a market sentiment signal for the broader SHIB army community confidence.
📰 REAL-TIME FUNDAMENTALS & ECONOMICS FACTORS 🌍💹
The following reflects what the actual market data and verified recent developments are showing — presented neutrally, not biased toward this trade setup.
🔥 SHIB BURN MECHANICS — SUPPLY CONTRACTION
The SHIB burn rate surged 237% on April 13, retiring millions of tokens in a single session, while Shibarium Layer-2 crossed 1 billion total transactions and 175 million unique wallet addresses.
As of recent data, the project has systematically removed 410 trillion SHIB tokens from circulation — representing 41% of its original one-quadrillion-token supply — through over 20,000 individual burn transactions. BTCC However, burns are a positive long-term narrative but mathematically insignificant at current rates — it would take decades to materially impact the multi-trillion supply.
🏛️ SHIBARIUM LAYER-2 — TECHNOLOGY CATALYST
The core development team is preparing a major upgrade to the Shibarium Layer-2 network, scheduled for Q2 2026, integrating Fully Homomorphic Encryption (FHE) in collaboration with cryptography firm Zama. This upgrade aims to transform Shibarium into a privacy-focused network targeting enhanced utility for gaming, DeFi, and token burn mechanisms.
🗾 RAKUTEN & JAPAN LISTING — REGULATORY CREDIBILITY
Rakuten Wallet listed SHIB in Japan on April 7, 2026, with the Japanese fintech giant's integration providing new liquidity and regulatory credibility.
Additionally, Japan's JVCEA added SHIB to its Green List alongside Bitcoin and Ethereum, easing domestic exchange listings, and the SEC and CFTC joint framework in March 2026 classified SHIB as a digital commodity.
🐋 WHALE ACCUMULATION vs. SELL PRESSURE — MIXED SIGNALS
A massive $505 billion SHIB left exchanges on April 21, 2026 — one of the largest outflow events this month — signalling possible whale accumulation.
However, declining open interest and a sustained pattern of lower highs suggest that selling pressure has not yet fully dissipated.
🏛️ US GOVERNMENT SHIB HOLDINGS — INSTITUTIONAL SPOTLIGHT
The U.S. Marshals Service now holds 54 billion SHIB, underscoring its growing presence in the institutional digital asset sphere.
📉 MACRO CRYPTO SENTIMENT — FEAR ENVIRONMENT
The broader crypto Fear & Greed Index reads 29 (Fear) as of late April 2026, with SHIB up 4% over the past seven days — modest but positive in this cautious climate. Bitcoin ETF inflows hit $2 billion over 8 days ending April 24, 2026, with U.S. spot Bitcoin ETFs recording $223.21 million in net inflows on April 23 alone — marking eight consecutive days of positive flows.
📊 BITCOIN MACRO SETUP — THE BIG BROTHER FACTOR
BTC broke above $77,000 on April 17, 2026 for the first time since February, with a single-session short liquidation event flushing over $209 million in bearish positions, adding structural buying pressure.
The broader macro crypto picture remains cautiously constructive. The uptick is primarily driven by regulatory optimism and institutional momentum, with the Fear & Greed Index starting to recover from recent lows, though negative funding rates indicate many traders remain cautious.
⚖️ COMPETITION RISK — MEME COIN FRAGMENTATION
SHIB faces intensifying competition from a growing field of rival meme coins, and adoption metrics remain modest relative to the token's market capitalisation.
The meme coin space is crowded — narrative rotation is fast and ruthless.
🌐 ETF INCLUSION PIPELINE — UPCOMING CATALYST
Inclusion in proposed institutional ETF filings is among the most closely watched upcoming catalysts for SHIB in 2026. If confirmed, this would represent a structural shift from retail-only participation to institutional market access.
⚙️ TECHNICAL CONTEXT — WHAT THE CHART IS SAYING
🔸 SHIB reached its lowest price of 0.00000508 USD on February 6, 2026 establishing a major cycle support floor.
🔸 Analysts are closely watching for a clean breakout above $0.00000612 resistance to confirm a shift, while on-chain data shows whales may be accumulating at these lower levels. Watch for a sustained increase in trading volume to validate any breakout attempt.
🔸 The technical picture does not support a breakout today — but the $0.0000087 resistance level is the line to watch. A daily close above it, backed by volume, changes the near-term narrative.
🔸 RSI and momentum indicators remain in neutral-to-cautious territory — no clean directional bias confirmed yet.
🧠 THIEF TRADING COMMANDMENTS
🔑 Never enter before the breakout is confirmed
🔑 Volume must support the move — no volume = no validity
🔑 Always manage your own risk — this is YOUR money
🔑 Partial exits at T1 secure profits while leaving runners for T2
🔑 Never average down into a losing meme coin trade
🔑 The market is a battlefield — only the disciplined survive
⚠️ RISK DISCLOSURE
This idea is for educational and analytical purposes only. Meme coin markets are extremely volatile and sentiment-driven. Always conduct your own research (DYOR). Past setups do not guarantee future results. Trade responsibly. 💼
🐾 Stay sharp. Stay patient. The Thief always waits for the perfect moment.
💜 Boost 🚀 | Follow 👁️ | Comment 💬 — Help the Thief Army grow!

NZDCHF Descending Channel Breakout SetupNZDCHF Descending Channel Breakout Setup
NZD/CHF is currently trading within a well-defined descending channel, respecting both upper and lower trendlines.
Price has recently tested the channel resistance and is recovering again.
Short-term price action suggests a possible pause before continuation. As long as price holds above the local support area, bullish continuation remains in play.
Main Targets:
0.4635
0.4650
You can find more details on the chart.
Thank you and good luck! 🍀
⚠️PS: Do your own analysis and use your own strategy to join the trade.
❤️ If this analysis helps your trading day, please support it with a like or comment ❤️

Crcl in elliot untill top paralell 120-125Imo Crcl Circle we hit 96 now target 120-125 top of paralell

EUR/JPY Price Outlook – Trade Setup📊 Technical Structure
FOREXCOM:EURJPY EUR/JPY has shifted from a range into a bullish breakout structure, with price holding above the 186.88 support zone and forming higher lows.
The recent impulsive move shows strong buying pressure, and current price is retesting the breakout base, suggesting a continuation setup rather than rejection.
Short-term bias: Bullish
🎯 Trade Setup (Buy on Retest)
Entry Zone: 186.88 – 186.81
Stop Loss: 186.80
Take Profit 1: 187.23
Take Profit 2: 187.30
Risk–Reward Ratio: ~1:4.4
📌 Invalidation:
A clean break below 186.80 would invalidate the bullish structure and signal a return to range.
🌐 Macro Background
Yen weakness remains the key driver as markets price in a dovish BoJ stance, while intervention risk only caps extreme upside. Meanwhile, steady euro positioning and elevated oil prices continue to pressure JPY, supporting EUR/JPY upside.
🔑 Key Technical Levels
Resistance Zone: 187.23 – 187.30
Support Zone: 186.88 – 186.81
Invalidation Level: 186.80
📌 Trade Summary
Structure flipped bullish after breakout.
Preferred strategy: Buy the pullback into support, targeting continuation toward resistance.
⚠️ Disclaimer
This analysis is for reference only and does not constitute trading advice. Financial markets involve significant risk; proper risk and position management are essential.

USD/JPY | Hourly OutlookI will be looking for sells on UJ. Price is inside a daily and 4 hour supply zone and we broke out of the hourly trendline. My entry would be the hourly fvg fill which is right above the most recent highs that I expect will be used as liquidity to fuel the move down to take out the rest of the trendline liquidity. You can take this as a sell limit or wait for lower timeframe confirmation. Sell limit with my setup is a 3.5 RR.

Coinbase in Range – Break or Reject👋 Hello to all TradingView professionals and followers,
Hope you're doing great and your trades are profitable 🌱📈
Today, we’re taking a look at the valuable stock **Coinbase (COIN)**, one of the key players in the crypto industry within the U.S. stock market.
---
💼 **Long-Term Investment Perspective**
Coinbase, as one of the largest cryptocurrency exchanges in the world, directly benefits from the growth of the crypto market. In the long run, this stock shows a strong correlation with the overall crypto trend, especially Bitcoin 🪙
For patient investors, it can deliver significant returns during bullish market cycles.
---
📊 **Technical Analysis Based on the Chart**
🔺 Overall Trend:
After a strong bullish move, the stock has entered a **Broadening Range pattern**.
📌 Key Characteristics:
* Higher Highs 📈
* Relatively equal lows near the support zone 📉
* Increasing volatility ⚡
🟡 **Key Support Zone:**
A strong support area is clearly visible on the chart, which has prevented further downside multiple times 🛡️
⚪ **Critical Resistance Zone:**
The **$220 level** is acting as a major resistance on the daily timeframe 🚧
---
🚫 **No Trade Zone**
Currently, the price is moving between support and resistance, making this range a low-probability area for entries ❗
The best approach here is to wait for a confirmed breakout ⏳
---
🚀 **Possible Scenarios**
🟢 Bullish Scenario:
If price **breaks and holds above $220 on the daily timeframe**:
* احتمال ادامه حرکت صعودی
* Smart money inflow
* Higher targets become achievable 🎯
🔴 Bearish Scenario:
If the support zone is lost:
* Potential for further downside
* Deeper correction scenario activates 📉
---
💡 **Investment Idea**
For a lower-risk entry:
👉 Wait for a **confirmed breakout and consolidation above $220**
👉 Scaling in after confirmation can be a more reliable strategy
---
📊 **What do you think? (Poll)**
🟢 Bullish breakout above $220
🔴 Rejection and drop back to support
🟡 Continued range movement
Drop your thoughts below 👇
---
⚠️ **Disclaimer (Important)**
This analysis is for educational purposes only and should not be considered financial advice.
All investment decisions are your own responsibility. Always practice proper risk management and do your own research (DYOR) before entering any trade.
---
#Coinbase #COIN #TechnicalAnalysis #USStocks #Investing #Crypto #Bitcoin #PriceAction #TradingView #SwingTrading #LongTermInvesting

US500 Bullish Continuation After Flag BreakoutUS500 Bullish Continuation After Flag Breakout
US500 came out of a clear bullish "Flag Pattern", thus showing an increase in bullish momentum.
The price created a new all-time high at 7177 and we are in a small correction before moving higher as shown in the chart.
I think the speculation related the FOMC meeting and the end of Powell's term could push US500 further.
Main Targets 7200 and 7250
You can find more details on the chart.
Thank you and good luck! 🍀
⚠️PS: Do your own analysis and use your own strategy to join the trade.
❤️ If this analysis helps your trading day, please support it with a like or comment ❤️

Microsoft Corp. (MSFT): A Clear BreakoutAs of April 24, 2026, Microsoft (MSFT) stock is trading around $423-$424.62, showing a modest daily increase of over 2% despite recent volatility and a broader tech sector consolidation. the stock is recovering from a 52 week low of $356.28 set in March 2026, while analysts maintain a strong buy consensus with a significantly high long term fair value estimate.
Technical outlook:
The stock made an importance breakout around $420-$423 resistance levels, in respect of the structure. After a retest of breakout , price is slowly making a retracement upward. however we anticipate buy continuation.
Key points:
More bullish confirmation at this moment, activates buy position eyeing $470.08, as next potential bullish.
Thanks for reading.

GME(Update): When a meme meets a nine billion dollar cash pileGameStop is transforming from a video game king into a holding company led by Ryan Cohen, who runs the firm without a salary, without conference calls, and without outdated expectations. Everyone who has ever asked «What will Cohen do with 9 billion?» is now glued to the charts, because silence in the boardroom can only mean one thing – the calm before the loudest deal in retail history.
Fundamentals
The financial results have sealed GameStop's final metamorphosis. Quarterly revenue came in at 1.104 billion dollars - a 14 percent drop, but operating profit rose to 135.2 million, nearly double the year‑ago figure. For the full 2025 fiscal year, the company delivered 232.1 million in operating profit, completely reversing a 26.2 million loss from the previous year. This is no accident; it is the result of Cohen methodically closing unprofitable locations and cutting SG&A expenses to 910.2 million – almost 20 percent lower than last year. The crown jewel: 9.0 billion dollars in cash, equivalents and marketable securities – a massive leap from 4.8 billion a year ago.
Add the Bitcoin strategy. In May 2025, GameStop invested 500 million dollars into 4,710 BTC. Instead of letting the coins sit idle, Cohen moved 4,709 BTC to Coinbase Prime and sold covered call options with strikes between 105,000 and 110,000 dollars, turning digital gold into a yield‑generating asset. This is not just holding reserves – it is a bold move that transforms GameStop into a mini‑Strategy on steroids.
Risks: With this strategy, GameStop caps its upside from Bitcoin above 110,000 dollars. Shareholders face dilution risk because capital was raised through ATM offerings. The retail business continues to shrink.
Technicals
On the weekly chart, price has completed a full trend reversal. The descending trendline that had weighed on quotes for months has finally been broken, and the asset is entering the golden pocket – the zone where the fair value gap meets the 0.618–0.786 Fibonacci retracement, an ideal area for fresh accumulation. A golden cross of moving averages has already occurred, and the OTE zone is formed right now. Indicators confirm the bullish bias: ADX shows a developing trend, directional lines DI+ and DI– clearly signal buyer dominance, and MACD gives a clear buy signal. Weekly volumes remain steadily high, confirming the presence of large players.
Price closed Friday at 24.95 dollars. First target is 31.48, second is 34.70, third is 41.14, the key target is 53.53.
The market continues to value GameStop on a single metric: what Ryan Cohen will do with his nine billion dollar arsenal. The technical breakout is confirmed, the golden pocket is holding, and the targets are above.

EUR/USD Technical Outlook: Breakout, Retest & Bullish RunEUR/USD "THE FIBER" 🔥 | Bullish Breakout Play | Day & Swing Trade Setup | Thief Style 🥷💰🗡️ ASSET:
💶💵 EUR/USD — "THE FIBER" — The most traded Forex pair on the planet, accounting for nearly 28% of daily global FX volume
📊 TRADE PLAN — BULLISH:
✅ Bullish plan confirmed with a clean resistance breakout above 1.17400
🚀 The Fiber cracked through a major resistance ceiling — bulls took control of the battlefield
🧠 Breakout validated on momentum, price action above key moving averages, and shifting macro tailwinds against the USD
🎯 ENTRY ZONE:
⚡ Entry is flexible — you may enter at any price level that fits YOUR risk appetite and chart confirmation
🎯 Aggressive traders: enter on retest of breakout zone near 1.17400
🐢 Conservative traders: wait for a pullback and confirmation candle before pulling the trigger
📐 Always size your position responsibly — the market doesn't care about your feelings, only your plan
💰 TARGET — THE ESCAPE PLAN:
🏁 Primary Target: 1.19000
⚠️ Why 1.19000 is the danger zone — multiple forces converging at this level:
🚔 Police Force Resistance — strong historical supply zone patrolling this area, ready to arrest the move
📈 Overbought conditions likely to develop as price approaches this ceiling
🪤 Bull trap territory — smart money may flip the table on retail longs at this exact zone
🔄 Potential trend change signals emerging near this resistance cluster
🥷 Thief Rule #1: Take money and RUN before they take it back from you
🙏 Dear Ladies & Gentlemen (Thief OG's) — the TP at 1.19000 is a guide, NOT a command. Use your own risk management. You can scale out, trail your stop, or exit earlier — it's YOUR trade, YOUR money, YOUR call ✊
🛑 STOP LOSS — THE THIEF'S ESCAPE HATCH:
🔴 Thief SL: 1.16600
📌 Place your stop loss AFTER breakout confirmation — not before. Never chase a stop blindly
⚠️ A close below 1.16600 would invalidate the bullish structure and signal the bulls lost the war
🙏 Dear Ladies & Gentlemen (Thief OG's) — the SL at 1.16600 is a reference point only. Your stop placement is entirely YOUR decision based on your broker, your spread, and your risk tolerance. Take care of your own capital first 💼
🔗 RELATED PAIRS TO WATCH — USD PAIRS:
📌 OANDA:GBPUSD "THE CABLE" ~1.3490 — Strong positive correlation with EUR/USD (~+0.95). Both the Eurozone and UK economies are closely linked through trade, meaning GBP/USD and EUR/USD often move similarly against the USD. If The Fiber pumps, Cable usually pumps too. Watch for GBP/USD breakout above 1.3500 as a bullish confirmation signal 🇬🇧
📌 OANDA:AUDUSD "THE AUSSIE" ~0.6390 — Moderate positive correlation with EUR/USD. AUD/USD shows bullish continuation signals alongside EUR/USD in the current macro environment, both benefiting from broad dollar weakness. Watch 0.6400 as the key upside trigger 🦘
📌 OANDA:USDCHF "THE SWISSIE" ~0.8820 — Strong negative correlation with EUR/USD (~-0.95). EUR/USD and USD/CHF have a strong negative correlation because the Swiss Franc historically moves similarly to the Euro, and when both are paired against the USD, they move in opposite directions. If Fiber rises, Swissie falls — use it as a cross-confirmation tool 🇨🇭
📌 FX:USDJPY "THE NINJA" ~158.00 — Indirect inverse relationship with EUR/USD via DXY pressure. A weaker dollar that lifts EUR/USD typically weighs on USD/JPY bulls. Watch Ninja closely for risk-off signals 🗡️
📌 OANDA:EURJPY "THE YUPPY" ~184.50 — Positive correlation with EUR/USD. If both EUR strength and JPY weakness align, this cross can outperform — bonus trade opportunity for OG's 🔥
📰 REAL-TIME FUNDAMENTAL & ECONOMIC FACTORS (What The Market Is Actually Saying Right Now):
🏦 CENTRAL BANK WATCH:
🇺🇸 Federal Reserve (FOMC): Expectations for the Fed point toward a pause in rate changes, with a probability close to 99.5% that rates will remain at 3.75%. FOMC decision lands 29 April 2026 — the most important USD event of the week
The tone of the statement and post-decision press conference will matter more than the rate decision itself — watch Powell's words very carefully
🇪🇺 European Central Bank (ECB): ECB deposit rate hold at 2.00% widely expected with roughly 91% probability in the short term. However, growing probabilities of rate increases are building toward year-end
Money markets are fully pricing in two quarter-point ECB rate hikes in 2026, with a 55% probability assigned to a third increase by year-end — hawkish ECB repricing = EUR bullish fuel 🚀
⚡ RATE DIFFERENTIAL:
US rates at 3.75% vs Europe at 2.00% — USD-denominated assets continue to be perceived as more attractive, which keeps a ceiling on EUR/USD rallies over the longer term
US 10-year Treasury yields near 4.3% while European yields sit near 3.4% — this gap continues to favour dollar strength and stronger capital flows toward USD assets
Bulls need clear ECB rate hike signals to close this differential and fuel a sustained EUR/USD advance 📊
🛢️ GEOPOLITICAL RISK — THE HORMUZ WILDCARD:
The stalemate in the Strait of Hormuz has turned the currency market into a hostage to news headlines, pushing traditional macroeconomic factors into the background
The Strait of Hormuz remains effectively closed — Iran retaining control over the strategic route, vessels being detained, and the US maintaining a naval blockade, all supporting high energy prices and increasing inflation risks
Brent Crude pushing above $103 per barrel — deepening stagflation fears across the Eurozone
The longer the stalemate continues, the greater the upward pressure on energy prices, amplifying stagflation risks for Eurozone economies
⚡ However — any diplomatic breakthrough in Hormuz talks could ignite a sharp EUR/USD rally toward 1.1900+ almost immediately 💥
📉 EUROZONE ECONOMIC DATA:
Eurozone private sector contracted in April at the fastest pace since November 2024 — driven by the Iran war pushing up energy costs, hurting consumer demand and the services sector
Germany's Economics Ministry halved its 2026 growth forecast, blaming the energy shock from the Middle East conflict
Germany's IFO Current Assessment Index declined to 85.4 in April from 86.7 in March — limiting bullish EUR momentum
German economic weakness is a real headwind for EUR — this is the friction the bulls must push through ⚔️
📈 TECHNICAL PICTURE (What The Market Is Saying):
EUR/USD on the daily chart has been advancing for multiple consecutive sessions, trading above both the 100-day and 200-day SMAs — underlying uptrend structure remains intact
Momentum indicator supports additional gains while RSI has been hovering in bullish territory, indicating buying pressure remains in control
After the strong April rally, the pair reached resistance near 1.1850 and faced rejection — market currently consolidating without sharp sell-offs, suggesting re-accumulation before the next leg higher
🔑 Key support cluster to defend: 1.1680 – 1.1700 — this is the must-hold zone for bulls
MACD in neutral-to-slightly-negative territory on short-term charts — typical healthy pullback behaviour within an uptrend
📅 UPCOMING HIGH-IMPACT EVENTS THIS WEEK (London Time 🇬🇧):
🔴 Tuesday 29 April — FOMC Meeting Begins (2-day meeting)
🔴 Wednesday 29 April — Fed Interest Rate Decision + Powell Press Conference — MEGA volatility event ⚡
🔴 Thursday 30 April — ECB Policy Statement + Press Conference — crucial for EUR direction
🟡 Monday 28 April — German Consumer Confidence & Eurozone Sentiment Data
🟡 Week of 28 April — US PCE Inflation data + preliminary GDP figures — dollar-moving data points
THIEF TRADER STYLE — WISDOM FROM THE VAULT:
🗡️ "In this market, the best traders are not the bravest — they are the most patient. Wait, watch, strike, and VANISH with the bag."
💰 "The trend is your accomplice. The breakout is your invitation. The exit is your masterpiece."
🧠 "Amateurs watch price. Professionals watch liquidity. Thieves watch BOTH — and then take it all."
🏆 "You don't need to trade every candle. You only need to trade THE candle that matters."
🎯 "Plan the trade. Trade the plan. Protect the profit. Repeat the process."
🌍 "Markets are a global chess game. The Thief doesn't play checkers — we play 10 moves ahead."
🚀 "Stay humble. Stay sharp. Stay funded. The market will always be there tomorrow — make sure YOU are too."
⚠️ THIEF DISCLAIMER:
📌 This is a technical trade idea for educational and analytical purposes only
📌 Always apply YOUR OWN risk management rules — no one else is responsible for your capital
📌 Market conditions can change in seconds — especially with live geopolitical risk events active right now
📌 This is NOT financial advice. It is a Thief-style trade map. You choose the route. You carry the bag. 💼

Amd - It's now time to take profits!🎰Amd ( NASDAQ:AMD ) is sitting at major resistance:
🔎Analysis summary:
This month Amd created an incredibly rally of about +35%. But looking at the higher timeframe, this just happened after a significant all time high break and retest. With the current retest of the major resistance trendline though, we could see a reversal.
📝Levels to watch:
$275
Trusting the Trading Gods🙏🏻

Gold Struggles Under Key SupplyGold Holds Below 4739 as Supply Pressure Continues to Limit Recovery
Gold remains in a technically fragile position on the 4H chart as price continues to trade below the 4739 sell zone, with every recovery attempt still struggling to regain meaningful upside traction. Although the market has shown some short-term stabilization after the recent decline, the overall structure remains corrective, and buyers have not yet done enough to shift the tone back in their favor.
Technical Structure
From a technical perspective, gold is still trading under pressure after breaking below the previous rising trendline support. That breakdown was an important structural signal because it marked the end of the earlier bullish path and shifted the market into a weaker short-term phase.
Since then, price has not produced a strong recovery. Instead, it has remained compressed beneath resistance, showing that bullish momentum is fading rather than rebuilding. The rebounds are shallow, and follow-through to the upside remains limited, which usually reflects a market that is still being controlled by supply.
The 4739 area continues to stand out as the key sell zone. Price is now trading just under this region, and that matters because it shows the market is still unable to reclaim the area where sellers previously became active. As long as gold stays capped below 4739, the structure continues to favor a corrective downside bias rather than a fresh bullish expansion.
Volume profile also supports this view. The market is no longer holding near the higher-value area and instead appears to be rotating away from it. This suggests that current price acceptance is developing below resistance, not above it. In other words, buyers are present, but they are still not strong enough to force a meaningful reclaim of the upper zone.
Another important detail is the current price behavior itself. Rather than trending decisively higher, gold is now consolidating under resistance after the trendline break. This type of compression often signals hesitation before the next move, and in the current context, that hesitation still favors the downside while the sell zone remains intact.
Key Levels
Sell zone / resistance: 4739
Major reaction support: 4556
Buy zone / POC: 4404
Lower structural support: 4352
Scenario & Expectation
The preferred scenario remains a rejection from resistance followed by another move lower.
As long as gold remains below 4739, the market is likely to continue trading with a heavy tone. A failure to reclaim this area would keep sellers in control and maintain pressure on price to rotate lower once again. In that case, 4556 remains the first key downside reference, as the chart already highlights it as an important reaction zone.
If price reaches 4556 and fails to attract a stronger response, then the next area to watch comes in around 4404. This buy zone is significant because it aligns with the POC and suggests a deeper area of interest where stronger demand could begin to re-enter the market.
Below that, 4352 remains the lower structural support and would become relevant if the correction extends further.
On the other hand, if gold manages to reclaim 4739 and hold above it with stronger acceptance, the current bearish pressure would begin to weaken. That would suggest the market is no longer accepting lower prices as easily, and the short-term structure would need to be reassessed from a more neutral perspective.
Conclusion
Gold is still trading in a corrective and technically vulnerable structure on the 4H chart, with the 4739 sell zone continuing to cap recovery attempts and the earlier trendline breakdown still shaping the broader short-term bias.
For now, the market has not shown enough strength to confirm a bullish recovery. Until resistance is reclaimed, gold remains exposed to another leg lower, with 4556 as the first important downside level and 4404 standing out as the more meaningful demand zone below.
