NVDA – The Market Leader Has Been Sitting Still While EverythingHere's what most people are missing on NVDA right now.
While MU ran 69% this year. While MRVL ran 95%. While AMD ran 43%. The stock that started this entire AI trade has been basically flat. The market leader has been coiling for months while the rest of the semiconductor sector went parabolic around it.
That kind of setup — the leader lagging while the sector heats up — doesn't last forever. When the market leader wakes up, it moves fast.
─────────────────────────────────
THE SETUP
─────────────────────────────────
Four day bull flag sitting right at $204. Tight consolidation, clean pattern. Above that is the larger ATH breakout level that everyone who trades this name knows about.
This is textbook. A short-term flag inside a larger base, coiling right under the level that matters most. The pattern is giving you a defined entry with a clear stop — low of today's candle. If that level breaks you're out. Simple.
The semiconductor sector is red hot and NVDA is the engine behind all of it. Revenue was up 73% year over year last quarter. Blackwell chips are sold out through mid-2026. Jensen Huang is already projecting $1 trillion in chip demand by 2027. The fundamentals have not changed. The chart just needed time to catch up.
─────────────────────────────────
TRADE PLAN
─────────────────────────────────
Entry: Break of the 4-day flag above $204
Stop: Low of today's candle
Target: ATH and beyond
Pattern: Bull flag into ATH breakout
─────────────────────────────────
THE ONE RISK
─────────────────────────────────
The QQQ is extended. Any day we could get a 2-3% flush on the index and NVDA will feel it regardless of how good the setup looks. That's just the reality right now. Keep the stop tight, don't press size, and let the trade work. The setup is clean but the market doesn't owe anyone anything.
If it works, this is the old warrior taking the lead again. The market leader reclaiming its spot at the top of the sector. That's a powerful move when it happens.
NVDA
Stock Market Forecast | BTC TSLA NVDA AAPL AMZN META MSFT0:00 Intro – Market Overview, Earnings & Key Data This Week
stock market update, S&P 500 analysis, Nasdaq outlook, Bitcoin overview, macro data, earnings preview, market sentiment
0:27 Sector Rotation – Tech Leadership & Risk-On Environment
sector rotation, XLK technology sector, semiconductor stocks, risk on market, energy sector impact
1:13 Earnings Preview – Big Tech (Microsoft, Amazon, Meta, Google, Apple)
big tech earnings, market catalysts, earnings impact on stocks, guidance outlook, market direction
1:47 Sentiment – Fear & Greed Index + Positioning
market sentiment, fear and greed index, bullish vs bearish positioning, pullback expectations
2:20 Dark Pool Data – Software Sector (IGV) & Market Direction
dark pool trading, IGV analysis, software sector outlook, institutional accumulation, market signals
3:49 Macro – FOMC Meeting & Economic Data
FOMC meeting, interest rates outlook, GDP data, PMI, jobless claims, macro catalysts
5:01 SPY – S&P 500 Strength & Bullish Continuation CME_MINI:ES1!
SPY analysis, S&P 500 all-time highs, market strength, bull trend, pullback expectations
6:32 QQQ – Nasdaq Strength & Resistance Levels CME_MINI:NQ1! NASDAQ:NDX
QQQ analysis, Nasdaq 100 outlook, tech stocks strength, resistance levels, breakout continuation
7:56 Bitcoin – Range, Structure & Relative Weakness CRYPTOCAP:BTC
Bitcoin analysis, BTC price action, crypto market outlook, support resistance, relative strength
9:40 Tesla – Breakout Failure or Support Hold?
Tesla stock analysis, TSLA resistance support, breakout retest, relative weakness
11:52 Meta – Bullish Structure & Earnings Setup
Meta stock analysis, META support resistance, bullish continuation, earnings levels
13:43 Amazon – All-Time Highs & Pullback Scenario
Amazon stock analysis, AMZN breakout, consolidation range, earnings reaction
15:02 Microsoft – Software Strength & Market Driver
Microsoft stock analysis, MSFT outlook, software sector strength, earnings catalyst
16:34 Google – Strongest Stock & Breakout Potential
Google stock analysis, GOOGL relative strength, bull flag, all-time highs
17:53 Apple – Tight Range & Breakout Watch
Apple stock analysis, AAPL consolidation, range breakout, earnings catalyst
18:31 Nvidia – Breakout vs Consolidation Scenario
Nvidia stock analysis, NVDA outlook, semiconductor stocks, breakout levels
19:42 Outro – Weekly Outlook & Key Levels Ahead
stock market outlook next week, key levels recap, trading plan summary

Fundamental and Technical Signals Align in NVDAFundamental and Technical Signals Align in NVDA
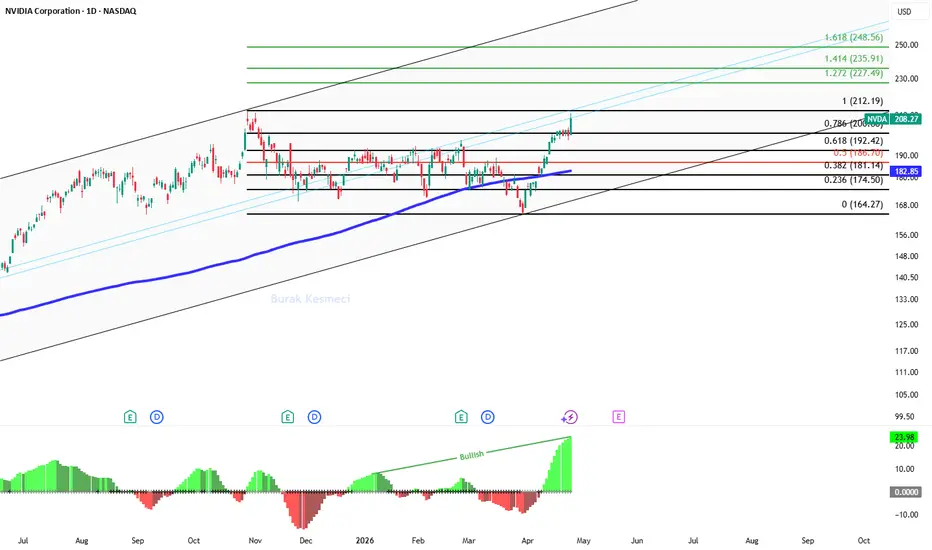
NVDA at $208.27 is displaying a rare technical-fundamental convergence with both valuation compression and squeeze momentum breakout pointing in the same direction.,
What story is the fundamental side telling?
With Wall Street analysts forecasting 73.9% earnings growth for NVDA, the current P/E ratio of 40.5 standing 2.27 times higher than the forward P/E of 17.8 indicates an expected valuation compression exceeding 50% in the coming period, and this figure presents strong repricing potential for a stock positioned significantly below the Nasdaq 100's forward P/E average of 22.4. The $5 trillion market cap company being backed by 44 analysts with a "Strong Buy" recommendation signals that institutional consensus shares this valuation compression expectation and strengthens the argument that profitability growth has not yet been fully reflected in prices.
The forward P/E remaining below the index's 5-year average of 25 reveals that NVDA is still priced in a discounted zone despite its growth story.
What signal is technical momentum giving?
With price trading 13.9% above the 200-day moving average at $182.85, the squeeze momentum indicator's jump from 0 to 23.98 shows the volatility compression breaking to the upside, and this breakout typically serves as a precursor to strong trend-directional moves. The $11.14 daily movement within the $199.81-$210.95 band (5.6% intraday volatility) signals the squeeze explosion gaining momentum, and the current price at $208.47 maintains the strength of the upward structure by positioning significantly above the 0.786 fibonacci level at $200.
Volume-wise, the 214 million lots traded exceeding the average indicates continued institutional participation, and the $181-$192 consolidation band now forming a strong support foundation reduces the pullback risk in upward price movements.
Why does this combination matter?
The valuation compression scenario supported by a 73.9% earnings growth expectation on the fundamental side, when combined with squeeze momentum breakout on the technical side, creates a rarely seen structure, and this situation forms a profile that can simultaneously attract the interest of both value and momentum investors.
The forward P/E being at 17.8 shows that even if prices rise to the $227-$235 band, assuming earnings expectations materialize, the valuation would not move into an excessively expensive zone, and this calculation draws a picture consistent with Fibonacci's upper extension targets. The squeeze momentum's "Bullish" trend signal combined with the 23.98 reading reveals that the uptrend wave starting from $164.27 maintains its acceleration potential, and the fundamental outlook supported by the consensus of 44 analysts confirms there is a strong fundamental foundation behind the technical breakout.
Which levels are critically important?
If persistence above the $212.19 resistance is achieved, both continuation of squeeze momentum and progress toward fundamental valuation targets can be expected, in which case the $227.49 and $235.91 levels could come into play as upside targets, however declines below the $200 level where the 0.786 fibonacci support breaks could signal weakening squeeze momentum, and in that scenario the $192.42 level could serve as the first test point.
On the fundamental side, if 2026 earnings figures come in lower than expected, the forward P/E rising from the 17.8 level could eliminate the valuation advantage, and in that case the 200-day moving average at $182.85 on the technical side could be expected to emerge as a critical support area.
Thanks for reading.
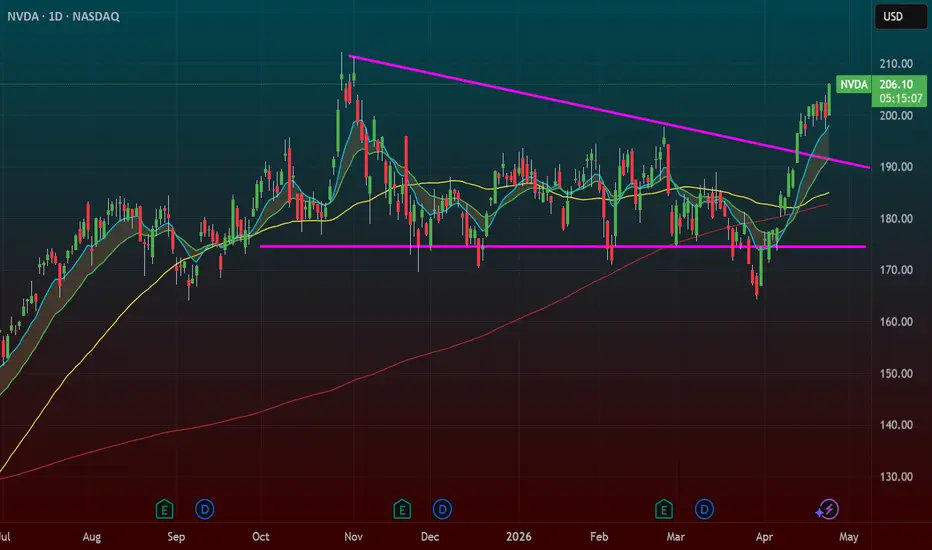
NVIDIA - Big Move Loading Above ResistanceNVIDIA was moving sideways and downward for a while, indicating no clear trend. Now, the price has bounced strongly from around 164 , suggesting sellers are losing control. This suggests the correction may be ending, but the uptrend is not confirmed yet.
Right now, the Stock is near an important level around 197 . If it breaks and stays above it, a strong move up can follow. If it fails, expect more slow and choppy movement. The security has already broken out the parallel channel on the daily timeframe chart. Upside targets after a pullback are 205 - 210.
We will update further information soon.
By @BrightRally_Research

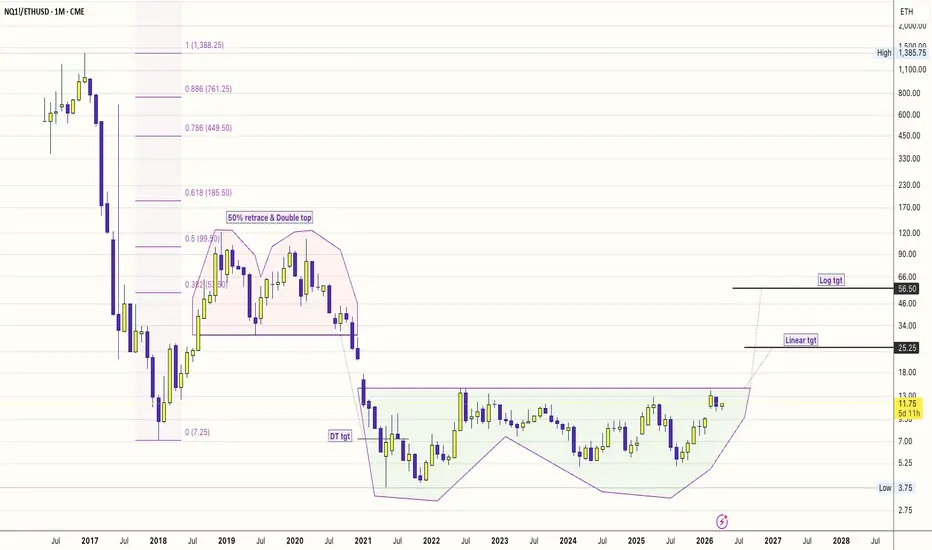
AI Infra > DeFi Infra: The 4-Year Relative Strength Breakout!1. The "Big Base" Logic
Observation: A 4-year base (2022–2026) in the NQ/ETH ratio.
This isn't just a price move; it’s a liquidity migration.
#DeFi (Ethereum) was the hero of the low-interest-rate era (2020-2021).
But in 2026, the "Real World" needs GPUs, data centers, and power grids.
The Nasdaq is the ticker for that physical reality.
The Trigger: Intel’s +24% move and Nvidia’s Blackwell dominance are the fundamental "fuel" for this technical breakout.
2. AI Infra (Hardware) vs. DeFi (Software)
The "Physical" Advantage: AI infra is now a $2.5 Trillion market.
It involves tangible assets (Chips, Fiber, Cooling).
The "Protocol" Fatigue: DeFi has become hyper-fragmented. There are too many L2s and protocols competing for the same liquidity. AI Infra, however, is a bottleneck economy—there is only so much compute to go around.
3. Key Levels
The Pivot: 13.00. A weekly close above this "Neckline" completes the 4-year U-Base.
The Targets: * Target 1 (25.25): The "Linear" target. This assumes Nasdaq continues to grow while ETH stays stagnant—a "repricing of utility."
Target 2 (56.50): The "Blue Sky" log target. This represents a world where AI agents become the primary users of the internet, making traditional human-centric DeFi secondary.
#NQ1! #ETHUSD
#NVDA, #INTC, #BTCUSD
#AIInfrastructure #RelativeStrength #DePIN #MacroEconomy #Semiconductors
In 2026, we’ve moved from "training" models to "running" them (Inference).
Running them requires constant, stable hardware—exactly what the Nasdaq companies are building.
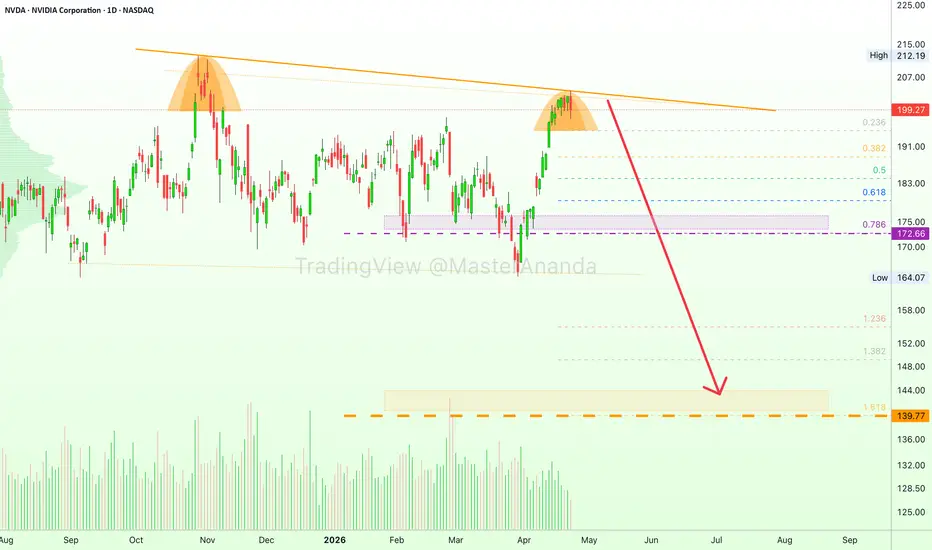
NVIDIA (NVDA) is about to crash · Back to basicsNVIDIA Corporation (NVDA) just produced a six months long lower high. April 2026 vs October 2025. This is a major bearish signal that points to the unfoldment of a bearish wave. This signal is coming in today and confirmation is still needed.
Additional bearish signals (back to basics):
» Decreasing volume for years.
» Bearish MACD, RSI & STOCH.
» Bearish stock market based on market cycle.
NVDA D RSI:
When the RSI peaked in October 2025, it led to several months of bearish action. The same signal is now being repeated.
NVDA D MACD:
The MACD peaked yesterday. Notice how the histogram is already dropping.
NVDA D STOCH:
The stochastic is already crashing down with plenty of room to move lower. The bearish signal on this indicator is many times stronger compared to October 2025.
You can sell everything or go short. There is no need to wait or hold because it will be a very strong correction. If you enjoy the stock, it is better to sell to buy back when prices are low.
» Sell the ones trading at resistance—like this one.
» Buy the ones trading at support—like Crypto (altcoins).
Namaste.
Cup and Handle: NVIDIA ($NVDA) vs the MAGS ETFNVDA & MAGS Market Context (February 2026)
The technical setup is forming against a backdrop of significant volatility and anticipation:
NVIDIA (NVDA): As the "AI bellwether," NVDA reports earnings on Wednesday, February 25, 2026. While it has been the sole Mag7 stock clinging to gains in early 2026 (+0.8% YTD), analysts have noted a dominant near-term downtrend that the Cup and Handle would need to overcome.
MAGS ETF: The ETF has faced a "brutal February," dropping 6.7% as investors rotated away from Big Tech. It is currently testing its 200-day moving average ($61.03); staying above this level is critical for any bullish pattern to hold.
This Cup and Handle breakout suggests NVIDA could "blow" the doors off this earnings call.

$ETH vs $NVDA: The "World Compute" 0.886 Reality Check📉📉📉
The "World Computer" narrative is meeting the 0.886 Fibonacci reset.
While Ethereum ( CRYPTOCAP:ETH ) struggles to clear its $2k ceiling.
The actual compute leader powering 80% of #AI
( NASDAQ:NVDA ) has crushed it in relative price performance.
Ironic since Ethereum used to be mined on NVDIA GPU's !!!
The Setup: We are tracking a deep 0.886 retracement in the ETH/NVDA ratio, a level traditionally seen as the "capitulation zone" for underperforming assets.
Analysis: The AI explosion "real-world compute" has drained liquidity from speculative crypto layers.
Target: Watching for a structural bottom at the 0.886 reset level to see if the "World Computer" can finally find a bid against the hardware king.
Going forward... once achieved
ETH may only do well to simply retest the Double top neckline.

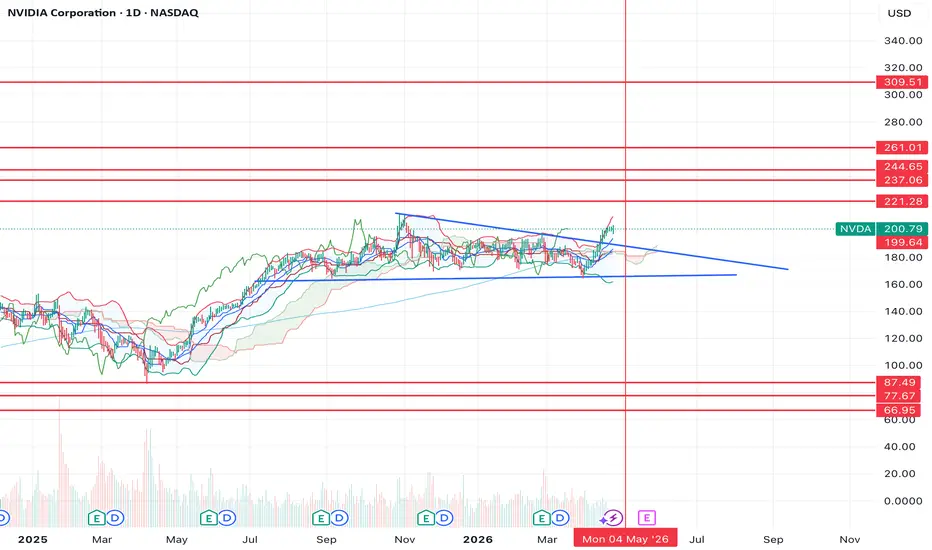
$NVDA final leg before lower?NVDA looks to be breaking higher here. If we can break the previous ATH at $209-211, then I think it's very likely that we see a fast move up to the resistances above.
Specifically the $237-245 area looks the most interesting to me.
After we finish the move higher, then I think we'll head down to one of the lower support levels as this would be the final leg in the trend.
Let's see how it plays out.
Nvidia - Initiating new all time highs!🧸Nvidia ( NASDAQ:NVDA ) is heading for new highs again:
🔎Analysis summary:
Nvidia still remains in a clear underlying bullrun. And while everyone was waiting for an all time high break and retest, Nvidia formed new structure. With the major horizontal level holding price, it seems like Nvidia is now just really rallying towards fresh all time highs.
📝Levels to watch:
$175
🙏🏻Trusting the Trading Gods

This could be next NVDA/MU?This is an edge applications gameplay, keep on eye on edge computing and when people/media talk about it this will go parabolic. Target 500. Stop Loss 111.
All the best !!

Nvidia —Resistance Turns Support Support Confirmed—ATH 260-194This week closes as a full green candle. A rising window or gap was left along the way. This is a bullish development.
The full green candle comes after a rounded bottom and double-bottom long-term. Coming from a resistance level turned strong long-term support.
Keeping it simple, NVDA has been rising and the chart shows potential for additional growth. There can be retraces and corrections; Any retraces and corrections are an opportunity to buy-up, rebuy and reload.
In the case of a strong correction, always, we will end up with a higher low compared to the 7-April weekly session. This session marks the bottom of the correction.
A higher low means the bullish structure remains intact. A bullish structure means a bullish trend. A bullish trend means rising prices which will end up with a new All-Time High in late 2025.
Two new All-Time Highs possible and highly probable in 2025. 194 (mid-term) & 260 (long-term).
Thank you for reading.
Support boost and follow.
Namaste.

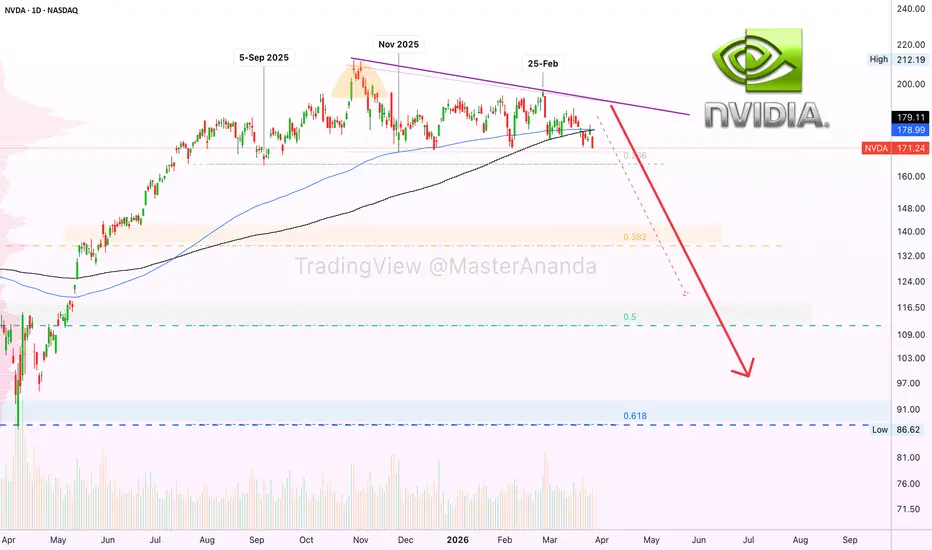
NVIDIA bearish & bullish · NVDA in bearish dominionNVIDIA has been moving sideways. It is a strong chart but has bearish potential. The price is very strong but...
Good evening my fellow trader, I hope you are having a wonderful day.
Here is the tricky situation with NVDA. Bearish or bullish?
The low from September 2025 remains unchallenged, which is bullish. The low from late November 2025 also remains unchallenged. When NVDA moved down that month it found support at EMA144 (blue line on the chart).
It has been sideways. There is a top with an inverted cup pattern (October). In late February, a month ago, we have a lower high.
Here we start to see the mixture of signals. The support levels that were activated remain unchallenged, but there are no new highs and even a lower high is now in place.
The lows from September and November are not tested but the chart continues to weaken. The market found support at EMA144 back then.
Yesterday, NVDA challenged EMA144 as resistance and there was a rejection. So the action is already below this level which was a support last year. And then comes MA200.
Yesterday NVDA lost two support levels at once, EMA144 and MA200, two long-term moving averages. This signal coupled with the lower high, has more meaning than the lack of new lows. It is mixed, but the bears are gaining ground.
It is possible to see a drop in the coming days.
It is not necessary to see a drop right away tomorrow because we are about to witness a major crash, the biggest in years. This move is being consolidated, the build-up process. So it can happen that the market continues to fluctuate. Going sideways, a little up, a little down. In this way, when sellers are fully positioned, the catalyst comes out; some sort of news related event, then we get the crash.
The crash can happen tomorrow just as it can happen next week or next month. The market tends to take as long as it needs, but NVIDIA isn't going up. This is a bearish chart. Bearish as in bearish potential.
135, 111 followed by 90. More or less.
These are the levels that will become relevant in the coming days.
Thank you for reading.
When a market grows for years then suddenly stops, it is time to run away.
There is still time to sell while the action happens close to resistance. There is no way that this market will start a new bull run with this chart structure. First comes a correction and then a new cycle can start. The market moves in waves.
The period of expansion being over, we will see a phase of contraction now, a major correction. Something the majority of holders do not expect. Holders not traders. Traders are ready and prepared. Somehow, they always know.
Namaste.
Stock Market Forecast | BTC TSLA NVDA AAPL AMZN META MSFTStock Market Forecast | CRYPTOCAP:BTC TSLA NVDA AAPL AMZN META MSFT
NASDAQ:NDX CME_MINI:NQ1! CME_MINI:ES1!

SPY NEW HIGHS, GAP CLOSE + NEW LOWS?SPY Sells Paid Last Time Around & Shared Here on TV.
May Puts Are Cheaper This Time Around For Higher Strikes.
Keep in Mind Earnings in The Upcoming Weeks.
I am Shorting Here For Technical + Speculation Reasons Ahead of Major Earnings.
Consider The Idea From A Discount on Premiums Perspective.
Pictured Below is SPY overlayed with The Prices For 700 Puts For May 15th.
I am Looking To Short SPY via 700 Puts For 5/15 Currently @ 10.50.
Targeting a Gap Close + Wick Fill From 656 Low From 4/07.
Conduct your own Due Diligence, None of This is Financial Advice & Only Intended For Informational, Entertainment, or Educational Purposes.

NVIDIA: Sell signal flashing on Megaphone's Top.NVIDIA is almost overbought on its 1D technical outlook (RSI = 69.771, MACD = 3.340, ADX = 32.679) with the price about to test the HH top of the 4 month Megaphone. The current 2 week rally has averted a 1D Death Cross, which may still be formed if the price gets rejected on this top, which is highly likely. If that happens, the 1D Death Cross may enforce a bigger correction but technically within the structure of this Megaphone, the target is the 1.236 Fibonacci extension (TP = 156.00).
See how our prior idea has worked out:
## If you like our free content follow our profile to get more daily ideas. ##
## Comments and likes are greatly appreciated. ##

NVIDIA Corporation stands at the forefront of the AI revolution# SECTION 1 Executive Summary 💡
NVIDIA Corporation (NVDA) stands at the forefront of the AI revolution, with its graphics processing units powering unprecedented demand from data centers amid surging hyperscaler investments. As AI infrastructure spending accelerates toward $600 billion in 2026, NVIDIA's dominant market position and innovative roadmap position it for sustained growth. Investors should prioritize this stock now due to its critical role in enabling transformative technologies like generative AI and autonomous systems.
**Overall rating:** Strong Buy
**12-month price target:** $260 (Methodology: Average of DCF valuation assuming 50% revenue growth in FY2027 and comparable company analysis using EV/EBITDA multiples of peers like AMD and AVGO, discounted at 10% WACC with terminal growth of 5%)
The single biggest reason to own this stock is NVIDIA's 85-90% market share in AI chips, driving record data center revenues amid a multi-trillion-dollar AI buildout. 🎯 The single biggest risk is potential delays in new product ramps, such as Blackwell, which could temper short-term growth if supply constraints persist.
# SECTION 2 Business Overview 📊
NVIDIA designs and manufactures graphics processing units (GPUs) and related software for computing tasks, simplifying complex AI training and inference for everyday use in data centers, gaming, and professional visualization.
**Revenue breakdown by segment, product, and geography (with percentages):** Based on Q3 FY2026 earnings (ended October 26, 2025), total revenue was $57.0 billion. Data Center segment: 90% ($51.2 billion); Gaming: 5% ($2.9 billion); Professional Visualization: 2% ($1.1 billion); Automotive: 1% ($0.6 billion); OEM and Other: 2% ($1.2 billion). By product, GPUs dominate, with AI accelerators comprising the bulk of Data Center. Geographically, U.S.: 45%; Taiwan: 20%; China (excluding restricted sales): 15%; Other Asia: 15%; Europe and Rest: 5% (percentages approximated from investor presentations and earnings transcripts). (Date: November 19, 2025)
**Business model:** NVIDIA earns money through hardware sales of GPUs and networking solutions, supplemented by software subscriptions via its CUDA platform and enterprise services. Repeat revenue is driven by ongoing upgrades to newer architectures (e.g., Hopper to Blackwell), ecosystem lock-in through proprietary software, and recurring cloud inference workloads.
**Competitive moat:** NVIDIA's strength lies in its CUDA software ecosystem, which developers rely on for AI programming, creating high switching costs. Combined with end-to-end solutions like NVLink for scalable AI factories, this makes replication difficult for rivals like AMD or Intel.
# SECTION 3 Financial Deep Dive 💰
**Key metrics table:** (Last 4 quarters and TTM, sourced from Q3 FY2026 earnings and prior reports)
| Metric | Q4 FY2025 | Q1 FY2026 | Q2 FY2026 | Q3 FY2026 | TTM | Source/Date |
|--------|-----------|-----------|-----------|-----------|-----|-------------|
| Revenue ($B) | 39.4 (Jan 2025) | 44.1 (May 2025) | 46.7 (Aug 2025) | 57.0 (Nov 2025) | 187.2 | SEC Filings |
| Net Income ($B) | 12.3 | 14.9 | 15.4 | 32.0 | 74.6 | Earnings Reports |
| EPS ($) | 0.50 | 0.61 | 0.63 | 1.30 | 3.04 | Earnings Reports |
| Gross Margin (%) | 73.0 | 71.8 | 73.3 | 73.4 | 72.9 | Earnings Reports |
| FCF ($B) | 11.5 | 13.2 | 14.0 | 30.5 (OCF minus Capex approx) | 69.2 | Earnings Reports |
| Debt ($B) | 9.7 | 9.7 | 9.7 | 9.7 | 9.7 | Balance Sheets |
**Year-over-year growth rates for all key metrics:** Revenue: +62% (Q3 FY2026); Net Income: +66%; EPS: +62%; Gross Margin: +1.5 pts; FCF: +65%; Debt: Flat. (Date: November 19, 2025)
**Balance sheet health:** Cash and equivalents: $35.1 billion; Total Debt: $9.7 billion; Current Ratio: 3.5; Debt-to-Equity: 0.15 (Strong liquidity, low leverage). (Date: October 26, 2025)
**Cash flow quality:** Operating Cash Flow vs. Net Income Ratio: 1.05 (Closely aligned, no major flags). (Date: November 19, 2025)
**Capital allocation:** Management focuses on R&D ($3.5 billion quarterly) for AI innovation, share buybacks ($15 billion authorized), modest dividends ($0.01/share), and strategic M&A (e.g., AI startups). No major debt issuance; emphasis on organic growth.
# SECTION 4 Growth Analysis 🚀
**Total addressable market (TAM) with source:** AI data center capex projected at $600 billion in 2025, rising to $3-4 trillion by 2030; NVIDIA's GPU TAM within this is $3-4 trillion cumulatively. (Date: January 23, 2026)
**Current market share and trajectory:** 85-90% in AI semiconductors, up from 92% in discrete GPUs in 2025; Trajectory: Increasing due to Blackwell ramp and ecosystem expansion. (Date: May 28, 2025)
**Key growth drivers for the next 3-5 years:** Blackwell Ultra shipments doubling in 2026, Rubin architecture launch in H2 2026, resumption of China sales (H200 chips starting February 2026), and expanding AI factories with partners like Meta and Microsoft.
**Management guidance vs. analyst consensus who is more bullish?** Management Q4 FY2026 guidance: $65 billion revenue (November 2025). Analyst consensus FY2026: $213 billion (more bullish on full-year trajectory). (Date: November 19, 2025) Management slightly conservative on China restrictions.
**Is growth organic or acquisition-dependent?** Primarily organic, driven by R&D and product cycles; Acquisitions supplemental (e.g., for software).
# SECTION 5 Valuation 📈
**DCF analysis with all assumptions clearly labeled and sourced:** Intrinsic value $255. Discounted back to present. (Date: January 5, 2026)
**Comparable company analysis table (minimum 5 peers):** (TTM multiples)
| Company | EV/EBITDA | P/E | Source/Date |
|---------|-----------|-----|-------------|
| NVDA | 39.7 | 45.9 | (Feb 2026) |
| AMD | 33.4 | 72.2 | (Feb 2026) |
| AVGO | 46.3 | 63.5 | (Feb 2026) |
| INTC | 18.1 | -875.9 | (Feb 2026) |
| QCOM | 24.5 | 27.2 | (Feb 2026) |
| TSM | 18.1 | 28.9 | (Feb 2026) |
**Historical valuation range (5-year P/E band):** 35.13 to 65.38; Current 49.36 within band. (Date: February 12, 2026)
**Bull / Base / Bear price targets with assumptions for each:** Bull $300 . Base $260 . Bear $200 .
**Current price vs. each target upside or downside %:** Current ~$187; Bull +60%; Base +39%; Bear +7%.
# SECTION 6 Risk Analysis ⚠️
**Top 5 material risks ranked by probability and impact:**
1. Supply chain delays (High probability, High impact): Triggered by TSMC bottlenecks; Could reduce Q4 revenue by 10%; Watch production updates.
2. Geopolitical tensions with China (Medium probability, High impact): Export bans resume; 15% revenue hit; Monitor U.S. policy.
3. Competition from AMD/Intel custom chips (Medium probability, Medium impact): Market share erosion; 5-10% slower growth; Track peer AI revenues.
4. AI demand slowdown (Low probability, High impact): Hyperscaler capex pause; Revenue flat; Watch Meta/MSFT spending.
5. Valuation compression (High probability, Medium impact): P/E drops to 30x on growth deceleration; 20% stock decline; Monitor multiples.
**Short interest and insider activity data (cite source):** Short interest: 257 million shares, 1.10% of float. (Date: January 30, 2026) Insider activity: $8.4 million in sales by executives (no buys). (Date: February 4, 2026)
**Accounting quality flags (if any):** None; Clean audits, consistent cash flow alignment.
# SECTION 7 Catalyst Calendar 🗓️
**Next earnings date:** February 25, 2026 (After Market). (Date: February 2026)
**Upcoming product launches, regulatory decisions, or strategic events:** Blackwell Ultra ramp (Q1-Q2 2026); Rubin architecture launch (H2 2026); H200 shipments to China (February 2026, pending approval).
**Macro events that specifically impact this stock:** U.S.-China trade policy updates (ongoing); Fed rate decisions affecting tech valuations (Q1 2026).
**Timeline of potential catalysts over the next 12 months:**
- Feb 2026: Earnings, China shipments start.
- May 2026: Q1 results, Blackwell updates.
- Aug 2026: Q2 results, Rubin previews.
- Nov 2026: Q3 results, full Rubin launch.
- Ongoing: AI capex announcements from hyperscalers.
# SECTION 8 The Verdict 🏆
**Bull case:** Price target $300; AI spend hits $600B in 2026, Blackwell exceeds expectations (70% probability).
**Base case:** Price target $260; Steady 50% growth on data center demand (20% probability).
**Bear case:** Price target $200; Supply issues and competition cap growth at 30% (10% probability).
**Expected value calculation:** Probability-weighted price target: (0.7 x 300) + (0.2 x 260) + (0.1 x 200) = $282.
**Final recommendation with conviction level:** Strong Buy; High conviction.
**The 30-second elevator pitch:** NVIDIA is the undisputed leader in AI chips with 90% market share, fueling a $213 billion FY2026 revenue surge amid exploding data center demand. With Blackwell and Rubin launches set to drive 50%+ growth, a $500 billion backlog, and resumption of China sales, this stock offers massive upside in the multi-trillion AI era trade at a reasonable 46x P/E given its moatbuy now before the next earnings beat propels it higher.
# Sources
- NVIDIA Q3 FY2026 Earnings Release (November 19, 2025)
- NVIDIA Investor Relations Website (Accessed February 2026)
- Yahoo Finance Analyst Estimates (January 2026)
- Motley Fool Articles (January-February 2026)
- Bloomberg Reports (January 2026)
- Macrotrends Historical Data (February 12, 2026)
- MarketBeat Short Interest (January 30, 2026)
- Wall Street Horizon Earnings Calendar (February 2026)

Week 10 of 52 – NVIDIA – Absorption or Distribution?After a powerful AI-driven expansion, NVDA is now compressing inside a defined structural range.
Momentum has slowed. Volatility is tightening.
This is typically where the market makes a decision. Is this absorption before continuation… or distribution before rotation?
Rather than chasing strength, I’m watching layered positioning zones:
$170 – First structural reaction level
$155 – Deeper demand pocket
$145 – Major support / broader liquidity zone
Upside Liquidity Targets
First liquidity area: $190
Extension zone: $200
Broader expansion: $210+
NVDA remains one of the primary AI infrastructure leaders.Institutional participation has been strong, but elevated expectations mean the stock now trades in a sensitive zone.When leaders compress, expansion usually follows.
The key is watching how price behaves at these levels. This isn’t about predicting.It’s about positioning around structure.
.... Is this absorption… or distribution?
-Follow for structured weekly market breakdowns
Not financial advice.

Stock Market Forecast | BTC TSLA NVDA AAPL AMZN META MSFT0:00 Intro – Stock Market Overview, Sentiment, Dark Pool Data
stock market update, S&P 500 analysis, QQQ outlook, Bitcoin overview, MAG7 stocks, market sentiment, fear and greed index, dark pool data, sector rotation, semiconductors outlook
0:19 Market Data – Sector Strength & Bullish Signals
sector rotation analysis, XLK technology sector, XLF financials, market breadth strength, bullish market signals, semiconductor bottoming signs
1:38 Dark Pool & Sentiment – Software Sector Breakdown (IGV)
IGV ETF analysis, software stocks selloff, triple bottom breakdown, stop loss sweep, market bottom signal, dark pool levels, SaaS sector outlook
3:26 Earnings Preview – Semiconductors & Financials Key Drivers
earnings season outlook, ASML stock, TSM stock, semiconductor earnings, financial sector earnings, market catalysts, macro outlook
4:32 SPY – S&P 500 Technical Analysis (Short Squeeze → Uptrend)
SPY analysis, S&P 500 breakout, short squeeze rally, higher low formation, trend reversal confirmation, multi timeframe analysis, bullish continuation CME_MINI:ES1!
8:20 QQQ – Nasdaq Technical Analysis (Resistance & Earnings Setup)
QQQ analysis, Nasdaq 100 resistance, tech stocks outlook, consolidation zone, breakout potential, earnings catalyst NASDAQ:NDX CME_MINI:NQ1!
9:08 Bitcoin – CRYPTOCAP:BTC Price Action & Breakout Levels
Bitcoin analysis, BTC support resistance, crypto market recovery, bear flag structure, risk assets correlation, BTC breakout 75k level
10:50 Tesla – TSLA Weakness & Downtrend Continuation
Tesla stock analysis, TSLA downtrend, relative weakness, support levels 330, EV stocks outlook, bearish structure
12:55 Meta – META Resistance & Range Setup
Meta stock analysis, META resistance levels, V-shape recovery, consolidation range, earnings setup
14:31 Amazon – AMZN Breakout & Consolidation
Amazon stock analysis, AMZN breakout, range trading, consolidation after rally, bullish continuation setup
15:44 Microsoft – MSFT Relative Strength vs Software Sector
Microsoft stock analysis, MSFT support levels, software sector weakness, IGV comparison, upside potential, QQQ driver
16:50 Google – GOOGL Strongest MAG7 Stock
Google stock analysis, GOOGL relative strength, bullish trend, market leader, all-time high potential
17:23 Apple – AAPL Tight Range & Breakout Watch
Apple stock analysis, AAPL consolidation, tightening range, breakout setup, earnings catalyst
17:55 NVDA Semiconductors – SMH False Breakdown (Bullish Signal)
SMH ETF analysis, semiconductor stocks outlook, false breakdown, no follow through, Nvidia leadership, market strength confirmation
19:26 Outro – Key Market Signals & Next Week Outlook
stock market outlook next week, key levels to watch, earnings impact, bullish vs bearish scenarios, trading plan recap

Nvidia - Starting the final bearish drop!💩Nvidia ( NASDAQ:NVDA ) can drop a final -20%
🔎Analysis summary:
A couple of months ago, Nvidia perfectly retested the major channel resistance trendline. Thus we already witnessed a clear rejection of about -20%. And looking at the higher timeframe, Nvidia can still drop another -20% before it will retest a major support level.
📝Levels to watch:
$150
SwingTraderPhil
SwingTrading.Simplified. | Investing.Simplified. | #LONGTERMVISION

$NVDA - BULL FLAG SET UPA major bull flag is setting up on NVDA. Te target extension of the bull flag will hit around $313.

TXN, stable CAPEX and FCFF generator (MU side-by-side)As of early April 2026, MU is trading around $379, having recently pulled back from an all-time high of $471.25 set immediately after its March earnings blowout.
Micron is no longer selling generic DRAM. Its HBM4 (High Bandwidth Memory) is a co-designed component for NVIDIA’s Vera Rubin architecture. This creates high switching costs and "stickier" high-margin revenue.
In a bold strategic move in early 2026, Micron retired its Crucial consumer brand to reallocate all manufacturing capacity toward high-margin Data Center and Automotive clients. Management notes that AI demand is "recasting memory as a defines strategic asset," with supply for 2026 and 2027 already essentially sold out.
Using the Free Cash Flow to the Firm (FCFF) model
RFR: 4.30%
Beta: 1.35 (reflecting semiconductor cyclicality, though transitioning to more stable secular growth)
Equity Risk Premium: 4.23% (more or less, keeping conflict in Iran in mind)
...
Cost of Equity: 10.01%
WACC: ~9.8% (Micron is net-debt free with 10.1B in debt and 16.7B in cash)
TTM Revenue: ~$58 Billion
Forward Revenue (2026): Projecting ~$110 Billion based on FQ3 guidance of $33.5 Billion and continued HBM4 ramp-up.
Operating Margin: FQ2 Non-GAAP operating margin hit 69%. While this is a cyclical peak, the shift to specialized HBM4 suggests a higher normalized "floor"
Operating Value: ~$485 Billion (assuming 25% normalized margins and a 12% 5-year CAGR).
...
Add Net Cash: +$6.5 Billion (Cash minus Debt).
Equity Value: ~$491.5 Billion.
Intrinsic Value Per Share (1.14B shares): ~$431.14.
At 12x earnings, the market is still treating Micron as a cyclical commodity firm that will eventually see prices crash. However, if HBM4 remains supply-constrained through 2027, this multiple is severely low. The Opportunity: The market is pricing in a 20% margin "reversion to mean" that hasn't happened yet.
Concerns and fears that the AI memory build-out is overextended. However, the balance sheet (net cash positive) and the 30% dividend increase provide a strong "Value Floor" at $350.
Comparing Texas Instruments (TXN) to Micron Technology (MU) reveals a classic contrast between a "Cash Harvest" story and an "Exponential Growth" story.
While Micron is currently a high-beta bet on the AI memory "scarcity" cycle, Texas Instruments is a lower-risk, high-margin analog giant coming out of a massive multi-year investment phase.
TXN’s story is about 300mm manufacturing dominance. They have spent the last six years (2020–2025) in an "elevated CapEx cycle," building massive internal capacity. In 2026, they are entering the "harvest" phase, where CapEx should stabilize, and Free Cash Flow (FCF) is expected to surge. They are an "underrated AI play" because their analog chips manage the power and heat for the very AI servers Micron populates.
MU’s story is about HBM4 (High Bandwidth Memory) pricing power. They are currently in the "Growth/Hype" phase, where demand exceeds supply, leading to record margins. However, they are highly cyclical and require constant, massive CapEx to stay competitive.
Using the Free Cash Flow to the Firm (FCFF) model
...
RFR: 4.30%
Beta: 1.05
Equity Risk Premium: 4.23%
Cost of Equity: ~8.74%
WACC: With a very manageable debt load and a 3.0% dividend yield, TXN’s WACC is ~8.2% (vs. MU’s ~9.8%)
...
2025 Revenue: ~$17.5 Billion
2025 FCF Growth: 96% YoY ($2.9B TTM)
Operating Margin: ~43% (Historically one of the highest in the industry, though MU is currently seeing a cyclical peak of 69%)
...
In February 2026, TXN announced the acquisition of Silicon Labs, which adds a "Real Option" on the massive embedded wireless/IoT market
...
Operating Value: ~$205 Billion (assuming a return to 25%+ FCF margins post-CapEx cycle)
Add Cash: +$9.5B
Subtract Debt: -$11.2B
Equity Value: ~$203 Billion
Intrinsic Value Per Share (907M shares): ~$223.81
TXN appears "more expensive" on a P/E basis (34x vs 12x), but this is a "Quality Mismatch." TXN’s margins are structural and permanent; MU’s current margins are cyclical. You pay a premium for TXN to avoid the "Memory Crash"...
Which is the better investment?
The choice comes down what you goals are in the AI space. TXN is a sleep well investment that is entering a phase where it will stop building factories and start returning massive amounts of cash to shareholders. A fair price to pay is anywhere under $200/share.
MU is a "High-Delta" play. It has higher upside ($430+ target), but if the AI server build-out slows down, the stock could drop 40% in a quarter. Texas Instruments is the better diversifier for your portfolio to stabilize your overall Beta.

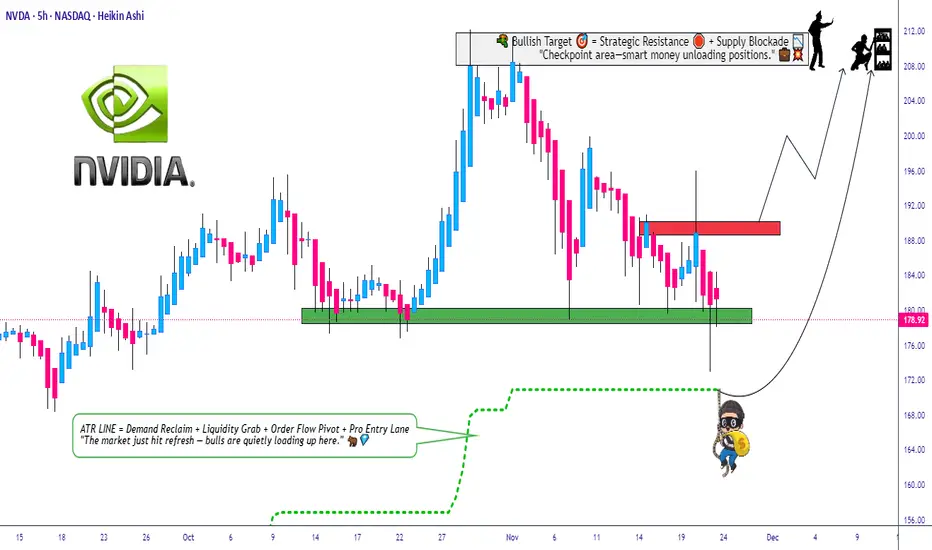
Can NVDA Hold the Pullback Zone and Extend the Uptrend?🔥 NVDA Bullish Pullback Playbook – Thief-Style Swing Setup 🚀🕵️♂️
Hey traders & my fellow Thief OG’s 😎🕶️ — here’s a clean, polished, TradingView-friendly version of my NVDA Swing Trade Playbook with a professional + funny touch. Let’s get to the setup 👇🔥
📌 Asset
NVDA – NVIDIA Corporation (NASDAQ)
Swing Trade | Momentum | Trend-Following Setup
📈 Plan: Bullish Pullback Strategy (Pending Orders Active)
The trend is strong, the buyers are steady, and NVDA is still delivering clean higher-lows. We're waiting for either a breakout continuation or a discounted pullback entry. 📊⚡
🎯 Entry Zones
1️⃣ Breakout Entry – Momentum Thief Mode 🥷⚡
Enter after clearing the nearest resistance at $191.00
• Clean breakout
• Volume confirmation
• Trend continuation strength
2️⃣ Pullback Entry – SuperTrend ATR Sniper Entry 🎯📉
Watch for a discounted pullback near $170.00 around the SuperTrend ATR zone.
• Trend support retest
• Lower-risk entry
• Ideal for swing traders who wait for “patience-pays entries” 😎
🛡️ Stop-Loss (Thief Style – Risk First)
Breakout Entry SL → $180.00
SuperTrend Pullback SL → $160.00
Note: Dear Ladies & Gentlemen (Thief OG’s) ❤️
I’m NOT recommending you use only my SL. Choose your own levels — you make the money, you protect the money. Trade at your own risk 🔐⚠️
🎯 Target (Take-Profit Zone)
Our target → $210.00
Why?
• Strong resistance zone
• Overbought region historically
• Buyer trap zone where police force 🚔👮♂️ usually waits — so escape with profits early 😂💨
Note: Dear Ladies & Gentlemen (Thief OG’s) 🙌
I’m NOT recommending you set my TP only. Choose your own TP — your money, your exit. Trade with responsibility 💼💰
🔍 Related Pairs to Watch (Correlation Insights + Key Notes)
NASDAQ:AMD
• High positive correlation with NVDA
• When AMD shows volume expansion, NVDA often follows
• Good for momentum confirmation 🔥
NASDAQ:SOXX (iShares Semiconductor ETF)
• NVDA is a major weighted component
• ETF direction confirms big-money flow 🧠💸
• Great for spotting sector-wide risk-on / risk-off shifts
NASDAQ:QQQ (NASDAQ 100 ETF)
• NVDA is one of the heaviest weights
• If QQQ trends strongly → NVDA often mirrors
• Macro sentiment index for tech strength 📊⚡
NASDAQ:SMH (VanEck Semiconductor ETF)
• Clean supply/demand signals
• NVDA mirrors SMH breakouts frequently
• Helps confirm breakout validity before taking the trade
All these help you avoid fakeouts and align with overall semiconductor market strength.
✨ “If you find value in my analysis, a 👍 and 🚀 boost is much appreciated — it helps me share more setups with the community!”
⚠️ This is a thief-style trading strategy created just for fun. Trade responsibly.