Nvidia continues to hit new highsIt has been a strong start to the week for Nvidia, with the stock posting a daily gain of more than 3.5%. Over the last two trading sessions, the price has advanced by more than 7%, highlighting a strong bullish bias in current price action.
Buying pressure has been supported by expectations of solid demand in the artificial intelligence sector, along with positive outlooks for upcoming tech earnings. This has allowed the stock to continue printing new short-term highs.
However, it is important to note that any negative developments that weaken market confidence could trigger meaningful profit-taking, especially given that the stock is trading near all-time highs.
Uptrend remains intact: Over recent weeks, optimism around Nvidia has allowed the price to break out of the sideways range that had been in place since late 2025. This breakout not only invalidated the previous structure but also reinforced a solid bullish bias, resuming the longer-term uptrend that has been in place for several months.
In this context, the upward trendline once again becomes the key technical reference. That said, the pace of the recent rally has been quite strong, which could open the door to short-term corrections.
RSI: While the RSI remains above the 50 level, it has now moved into overbought territory (above 70), suggesting a potential imbalance driven by strong buying momentum. This could lead to short-term pullbacks.
MACD: A similar signal is emerging in the MACD, where the price continues to make higher highs while the indicator shows lower highs. This points to a bearish divergence, which may indicate fading momentum and the potential for corrective moves in the near term.
Key levels to watch:
$220: With no historical references above current levels, this stands as the nearest psychological barrier. Sustained moves above this level could reinforce a more aggressive bullish trend in the short term.
$197: A nearby support level just below the $200 psychological area. This level could act as a key reference in the event of short-term corrections.
$185: Key support aligned with the 50 and 200-period moving averages. A move toward this level could weaken the current bullish structure and open the door to a more pronounced phase of indecision.
Written by Julian Pineda, CFA, CMT – Market Analyst
Nvidia

Fundamental and Technical Signals Align in NVDAFundamental and Technical Signals Align in NVDA
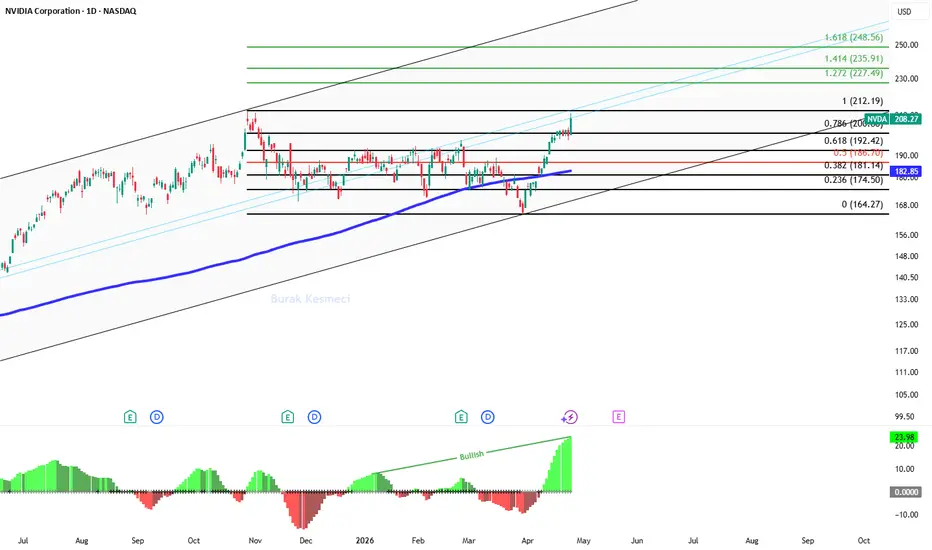
NVDA at $208.27 is displaying a rare technical-fundamental convergence with both valuation compression and squeeze momentum breakout pointing in the same direction.,
What story is the fundamental side telling?
With Wall Street analysts forecasting 73.9% earnings growth for NVDA, the current P/E ratio of 40.5 standing 2.27 times higher than the forward P/E of 17.8 indicates an expected valuation compression exceeding 50% in the coming period, and this figure presents strong repricing potential for a stock positioned significantly below the Nasdaq 100's forward P/E average of 22.4. The $5 trillion market cap company being backed by 44 analysts with a "Strong Buy" recommendation signals that institutional consensus shares this valuation compression expectation and strengthens the argument that profitability growth has not yet been fully reflected in prices.
The forward P/E remaining below the index's 5-year average of 25 reveals that NVDA is still priced in a discounted zone despite its growth story.
What signal is technical momentum giving?
With price trading 13.9% above the 200-day moving average at $182.85, the squeeze momentum indicator's jump from 0 to 23.98 shows the volatility compression breaking to the upside, and this breakout typically serves as a precursor to strong trend-directional moves. The $11.14 daily movement within the $199.81-$210.95 band (5.6% intraday volatility) signals the squeeze explosion gaining momentum, and the current price at $208.47 maintains the strength of the upward structure by positioning significantly above the 0.786 fibonacci level at $200.
Volume-wise, the 214 million lots traded exceeding the average indicates continued institutional participation, and the $181-$192 consolidation band now forming a strong support foundation reduces the pullback risk in upward price movements.
Why does this combination matter?
The valuation compression scenario supported by a 73.9% earnings growth expectation on the fundamental side, when combined with squeeze momentum breakout on the technical side, creates a rarely seen structure, and this situation forms a profile that can simultaneously attract the interest of both value and momentum investors.
The forward P/E being at 17.8 shows that even if prices rise to the $227-$235 band, assuming earnings expectations materialize, the valuation would not move into an excessively expensive zone, and this calculation draws a picture consistent with Fibonacci's upper extension targets. The squeeze momentum's "Bullish" trend signal combined with the 23.98 reading reveals that the uptrend wave starting from $164.27 maintains its acceleration potential, and the fundamental outlook supported by the consensus of 44 analysts confirms there is a strong fundamental foundation behind the technical breakout.
Which levels are critically important?
If persistence above the $212.19 resistance is achieved, both continuation of squeeze momentum and progress toward fundamental valuation targets can be expected, in which case the $227.49 and $235.91 levels could come into play as upside targets, however declines below the $200 level where the 0.786 fibonacci support breaks could signal weakening squeeze momentum, and in that scenario the $192.42 level could serve as the first test point.
On the fundamental side, if 2026 earnings figures come in lower than expected, the forward P/E rising from the 17.8 level could eliminate the valuation advantage, and in that case the 200-day moving average at $182.85 on the technical side could be expected to emerge as a critical support area.
Thanks for reading.
NVIDIA - Big Move Loading Above ResistanceNVIDIA was moving sideways and downward for a while, indicating no clear trend. Now, the price has bounced strongly from around 164 , suggesting sellers are losing control. This suggests the correction may be ending, but the uptrend is not confirmed yet.
Right now, the Stock is near an important level around 197 . If it breaks and stays above it, a strong move up can follow. If it fails, expect more slow and choppy movement. The security has already broken out the parallel channel on the daily timeframe chart. Upside targets after a pullback are 205 - 210.
We will update further information soon.
By @BrightRally_Research

AI Infra > DeFi Infra: The 4-Year Relative Strength Breakout!1. The "Big Base" Logic
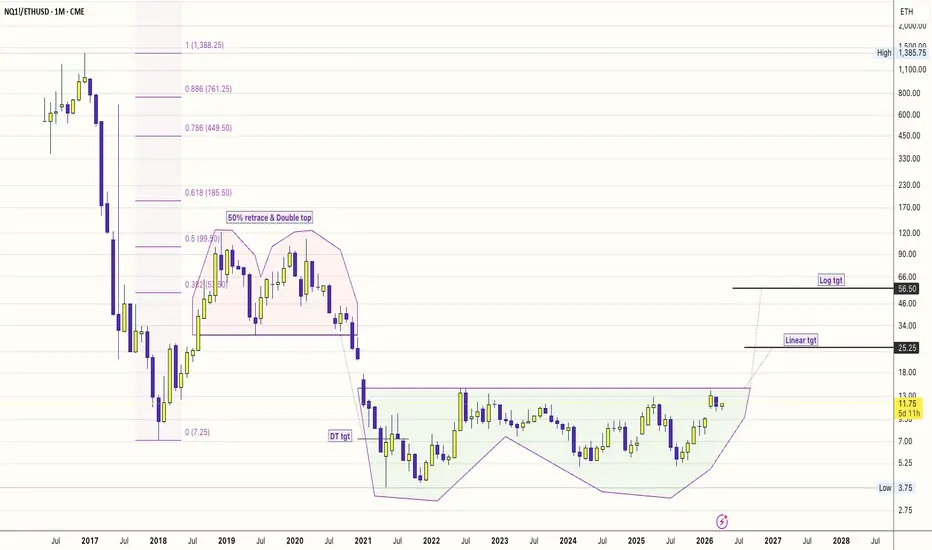
Observation: A 4-year base (2022–2026) in the NQ/ETH ratio.
This isn't just a price move; it’s a liquidity migration.
#DeFi (Ethereum) was the hero of the low-interest-rate era (2020-2021).
But in 2026, the "Real World" needs GPUs, data centers, and power grids.
The Nasdaq is the ticker for that physical reality.
The Trigger: Intel’s +24% move and Nvidia’s Blackwell dominance are the fundamental "fuel" for this technical breakout.
2. AI Infra (Hardware) vs. DeFi (Software)
The "Physical" Advantage: AI infra is now a $2.5 Trillion market.
It involves tangible assets (Chips, Fiber, Cooling).
The "Protocol" Fatigue: DeFi has become hyper-fragmented. There are too many L2s and protocols competing for the same liquidity. AI Infra, however, is a bottleneck economy—there is only so much compute to go around.
3. Key Levels
The Pivot: 13.00. A weekly close above this "Neckline" completes the 4-year U-Base.
The Targets: * Target 1 (25.25): The "Linear" target. This assumes Nasdaq continues to grow while ETH stays stagnant—a "repricing of utility."
Target 2 (56.50): The "Blue Sky" log target. This represents a world where AI agents become the primary users of the internet, making traditional human-centric DeFi secondary.
#NQ1! #ETHUSD
#NVDA, #INTC, #BTCUSD
#AIInfrastructure #RelativeStrength #DePIN #MacroEconomy #Semiconductors
In 2026, we’ve moved from "training" models to "running" them (Inference).
Running them requires constant, stable hardware—exactly what the Nasdaq companies are building.
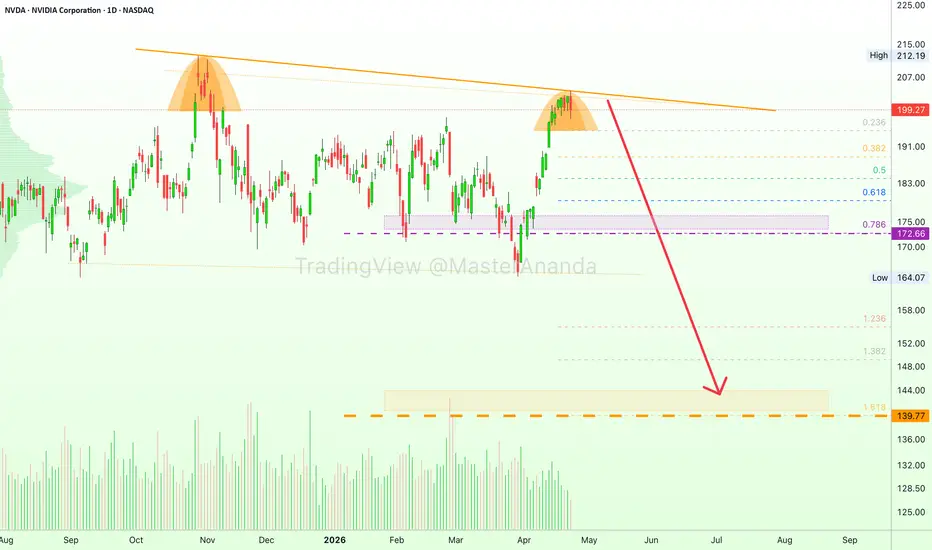
NVIDIA (NVDA) is about to crash · Back to basicsNVIDIA Corporation (NVDA) just produced a six months long lower high. April 2026 vs October 2025. This is a major bearish signal that points to the unfoldment of a bearish wave. This signal is coming in today and confirmation is still needed.
Additional bearish signals (back to basics):
» Decreasing volume for years.
» Bearish MACD, RSI & STOCH.
» Bearish stock market based on market cycle.
NVDA D RSI:
When the RSI peaked in October 2025, it led to several months of bearish action. The same signal is now being repeated.
NVDA D MACD:
The MACD peaked yesterday. Notice how the histogram is already dropping.
NVDA D STOCH:
The stochastic is already crashing down with plenty of room to move lower. The bearish signal on this indicator is many times stronger compared to October 2025.
You can sell everything or go short. There is no need to wait or hold because it will be a very strong correction. If you enjoy the stock, it is better to sell to buy back when prices are low.
» Sell the ones trading at resistance—like this one.
» Buy the ones trading at support—like Crypto (altcoins).
Namaste.
Cup and Handle: NVIDIA ($NVDA) vs the MAGS ETFNVDA & MAGS Market Context (February 2026)
The technical setup is forming against a backdrop of significant volatility and anticipation:
NVIDIA (NVDA): As the "AI bellwether," NVDA reports earnings on Wednesday, February 25, 2026. While it has been the sole Mag7 stock clinging to gains in early 2026 (+0.8% YTD), analysts have noted a dominant near-term downtrend that the Cup and Handle would need to overcome.
MAGS ETF: The ETF has faced a "brutal February," dropping 6.7% as investors rotated away from Big Tech. It is currently testing its 200-day moving average ($61.03); staying above this level is critical for any bullish pattern to hold.
This Cup and Handle breakout suggests NVIDA could "blow" the doors off this earnings call.

$ETH vs $NVDA: The "World Compute" 0.886 Reality Check📉📉📉
The "World Computer" narrative is meeting the 0.886 Fibonacci reset.
While Ethereum ( CRYPTOCAP:ETH ) struggles to clear its $2k ceiling.
The actual compute leader powering 80% of #AI
( NASDAQ:NVDA ) has crushed it in relative price performance.
Ironic since Ethereum used to be mined on NVDIA GPU's !!!
The Setup: We are tracking a deep 0.886 retracement in the ETH/NVDA ratio, a level traditionally seen as the "capitulation zone" for underperforming assets.
Analysis: The AI explosion "real-world compute" has drained liquidity from speculative crypto layers.
Target: Watching for a structural bottom at the 0.886 reset level to see if the "World Computer" can finally find a bid against the hardware king.
Going forward... once achieved
ETH may only do well to simply retest the Double top neckline.

Revenue Growth 7% - yet the stock pumps 20% ...ahem Here is the unvarnished analysis of Intel’s Q1 2026 financials, the macroeconomic hurdles they face, where the actual "wins" reside, and the necessary strategic pivot.
1. The Revenue Growth Reality Check: Price Increases Masking Volume Contraction
For a company carrying a $416 billion market cap in the midst of an AI supercycle, 7.2% top-line growth is anemic. But the quality of that revenue is what alarms me. The growth is entirely driven by price hikes (ASPs), not market share expansion or unit demand:
Data Center and AI (DCAI): Revenue grew 22% to $5.05 billion. However, this was driven by a 27% increase in server Average Selling Prices (ASPs). Actual unit volume declined by 5%.
Client Computing Group (CCG): Revenue was virtually flat at $7.72 billion (up just $98 million). ASPs increased 16%, but unit volume collapsed by 13%.
The Strategic Takeaway: Intel is relying on demand-based pricing actions and a mix of premium products to squeeze more revenue out of shrinking deliveries. Management blames "internal and external supply constraints," but in a highly competitive semiconductor market, a failure to ship units means AMD, NVIDIA, and ARM-based competitors are capturing the volumetric growth. Price up, volume down is not a secular growth story; it is a structural bottleneck.
2. The Cash Flow and Expense Disconnect
The cash flow statement does not support a $416 billion growth narrative.
Operating Cash Flow: Intel generated just $1.09 billion in operating cash flow in Q1 2026.
Operating Losses: The company reported a massive operating loss of $3.13 billion. While the headline number is skewed by a $3.9 billion non-cash goodwill impairment for Mobileye, even adjusting for this, the core Foundry business remains a financial sinkhole.
Intel Foundry: 2.43 billion operating loss** (a negative 45% margin). Worse, management noted that Q1 2026 saw an "increased mix of higher cost wafers manufactured on our Intel 18A process node," signaling that the transition to the 18A node is severely pressuring product profit margins.
Furthermore, Intel is engaging in defensive financial engineering. In April 2026, they bought back Apollo’s 49% stake in the Ireland SCIP (Fab 34) for $14.2 billion. To fund this, they drew down a $6.5 billion 364-day term loan at 4.79%. Borrowing at near 5% in a "higher-for-longer" interest rate environment to plug a fab financing gap is a defensive maneuver, not an offensive growth strategy.
3. Where Are the "Wins"?
Despite the grim broader picture, there are isolated pockets of strategic success:
DCAI Pricing Power: The ability to push through a 27% ASP increase in the Data Center segment without losing more than 5% volume shows that Intel still holds pricing power at the premium tier of enterprise servers.
Aggressive Opex Rationalization: R&D and MG&A expenses actually dropped 8% YoY (saving ~$400 million in the quarter). The 2024 and 2025 Restructuring Plans (headcount reductions) are flowing through to the bottom line, keeping gross margins afloat at 39.4% (up from 36.9% in Q1 2025).
Government Backing (The "Cannot Fail" Put): Intel is functioning as a quasi-state-sponsored entity. The 10-Q highlights the CHIPS Act Secure Enclave program and $629 million in Advanced Manufacturing Investment Credits (AMIC). The U.S. government effectively acts as a floor under Intel’s stock, issuing warrants and escrowed shares because Intel is the only domestic player capable of leading-edge logic R&D.
4. The 2026 Macroeconomic & Geopolitical Hurdles
Any strategy formulation must account for the brutal macro environment outlined in the 10-Q:
The Middle East Conflict: The explicit 10-Q disclosure regarding Iran targeting U.S. facilities is a massive, underpriced risk. Intel's Fab in Israel manufactures the Intel 7 node, which drives a significant portion of current revenues. A kinetic strike on or near this facility, coupled with the Qatar helium supply disruption (critical for fab operations), threatens immediate top-line devastation. Intel admits they are "self-insured for losses resulting from war."
Interest Rates and Capital Cost: Foundry models require relentless CapEx. With interest rates remaining elevated, Intel’s $43 billion long-term debt load is expensive. Their reliance on alternative financing (SCIPs with Brookfield and Apollo) is fraying, as evidenced by the $14.2B Apollo buyout.
Tariffs & Trade: Broader U.S.-China decoupling continues to pressure substrate and memory supply chains, which Intel explicitly cites as a cap on their ability to meet customer demand.
5. Strategy: Where Do They Go From Here?
If I were advising the Board or the CEO on justifying a $416B valuation and executing a true turnaround, the playbook must shift from "empire building" to "ruthless optimization."
Phase 1: Capitulate on Foundry Hubris (De-risk 14A)
Intel must abandon the pride of "doing it all." Management explicitly noted they may "pause or discontinue our pursuit of Intel 14A" if they cannot secure external design wins. They should trigger this pause now. They need to rely on external foundries (TSMC) for sub-18A nodes to save tens of billions in CapEx and focus purely on maintaining architectural superiority in CPU/AI design.
Phase 2: Radical Geographic De-risking
The reliance on the Israel fab is an existential threat in 2026. Intel must accelerate the migration of legacy and mid-tier node production to their Arizona, New Mexico, and Ohio facilities. The CHIPS act money must be aggressively front-loaded to shift supply chain dependencies out of kinetic conflict zones.
Phase 3: Spin-Off / Monetize Non-Core Assets
The Mobileye $3.9B impairment proves the distraction of peripheral bets. Intel should fully divest its remaining stakes in Mobileye and Altera (already 51% sold). They are sitting on non-marketable equity investments and need liquidity to fund their core dividend and debt obligations without tapping 5% term loans.
Phase 4: Pivot to Edge AI and Advanced Packaging
Intel missed the primary GPU boom to NVIDIA and the pure-play foundry boom to TSMC. Their unique remaining moat is in Advanced Packaging (where even TSMC is constrained) and Edge AI (AI PCs). CCG saw an ASP bump because of AI-enabled PCs. Intel must abandon the data center GPU war where it is hopelessly behind, and monopolize the AI PC and industrial robotics edge compute markets.
Conclusion
At $416 billion, the market is paying for a successful execution of a world-class foundry and an AI data center resurgence. The Q1 2026 financials show neither. Intel is surviving on price hikes, aggressive cost-cutting, and U.S. government subsidies, while bleeding volume and cash. Until volume growth returns to the Intel Products segment and the Foundry stems its multi-billion-dollar losses, this stock is trading on national security sentiment, not financial reality.

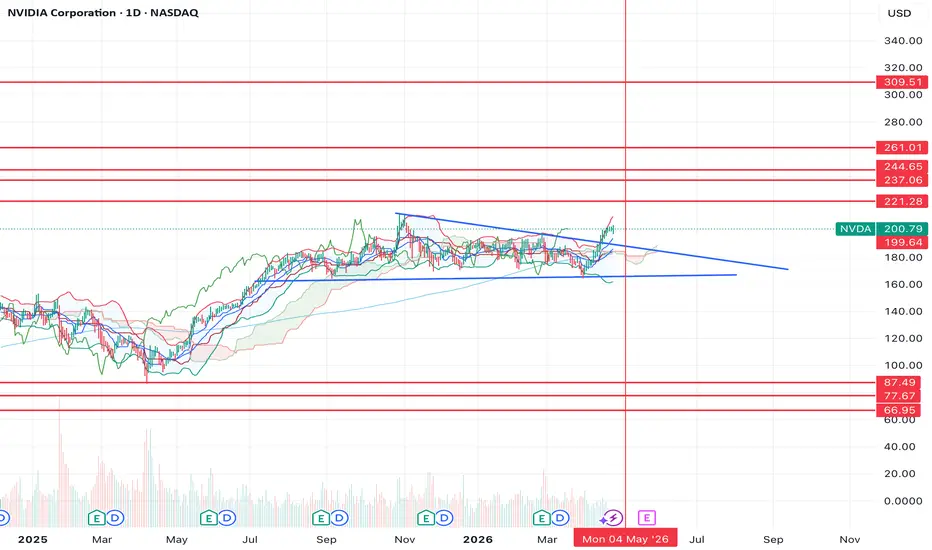
$NVDA final leg before lower?NVDA looks to be breaking higher here. If we can break the previous ATH at $209-211, then I think it's very likely that we see a fast move up to the resistances above.
Specifically the $237-245 area looks the most interesting to me.
After we finish the move higher, then I think we'll head down to one of the lower support levels as this would be the final leg in the trend.
Let's see how it plays out.
Nvidia - Initiating new all time highs!🧸Nvidia ( NASDAQ:NVDA ) is heading for new highs again:
🔎Analysis summary:
Nvidia still remains in a clear underlying bullrun. And while everyone was waiting for an all time high break and retest, Nvidia formed new structure. With the major horizontal level holding price, it seems like Nvidia is now just really rallying towards fresh all time highs.
📝Levels to watch:
$175
🙏🏻Trusting the Trading Gods

Nvidia —Resistance Turns Support Support Confirmed—ATH 260-194This week closes as a full green candle. A rising window or gap was left along the way. This is a bullish development.
The full green candle comes after a rounded bottom and double-bottom long-term. Coming from a resistance level turned strong long-term support.
Keeping it simple, NVDA has been rising and the chart shows potential for additional growth. There can be retraces and corrections; Any retraces and corrections are an opportunity to buy-up, rebuy and reload.
In the case of a strong correction, always, we will end up with a higher low compared to the 7-April weekly session. This session marks the bottom of the correction.
A higher low means the bullish structure remains intact. A bullish structure means a bullish trend. A bullish trend means rising prices which will end up with a new All-Time High in late 2025.
Two new All-Time Highs possible and highly probable in 2025. 194 (mid-term) & 260 (long-term).
Thank you for reading.
Support boost and follow.
Namaste.

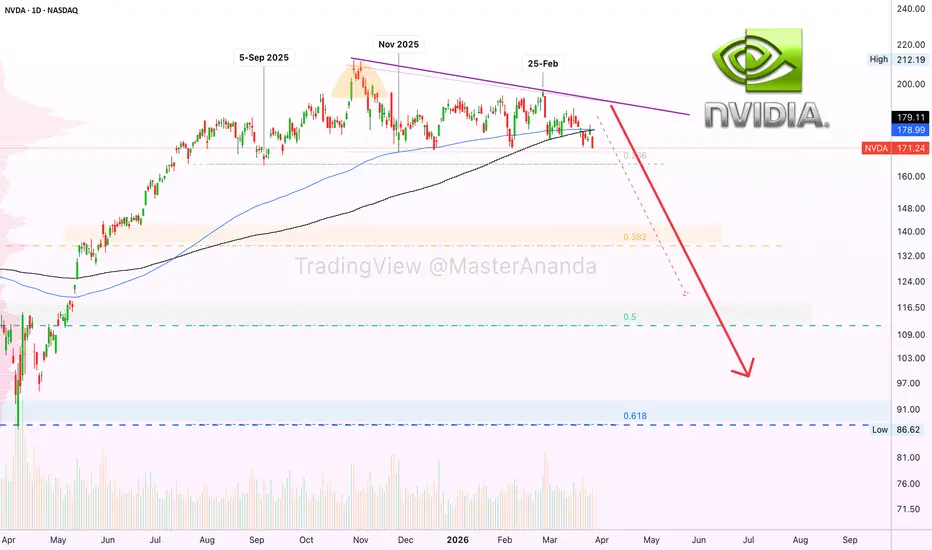
NVIDIA bearish & bullish · NVDA in bearish dominionNVIDIA has been moving sideways. It is a strong chart but has bearish potential. The price is very strong but...
Good evening my fellow trader, I hope you are having a wonderful day.
Here is the tricky situation with NVDA. Bearish or bullish?
The low from September 2025 remains unchallenged, which is bullish. The low from late November 2025 also remains unchallenged. When NVDA moved down that month it found support at EMA144 (blue line on the chart).
It has been sideways. There is a top with an inverted cup pattern (October). In late February, a month ago, we have a lower high.
Here we start to see the mixture of signals. The support levels that were activated remain unchallenged, but there are no new highs and even a lower high is now in place.
The lows from September and November are not tested but the chart continues to weaken. The market found support at EMA144 back then.
Yesterday, NVDA challenged EMA144 as resistance and there was a rejection. So the action is already below this level which was a support last year. And then comes MA200.
Yesterday NVDA lost two support levels at once, EMA144 and MA200, two long-term moving averages. This signal coupled with the lower high, has more meaning than the lack of new lows. It is mixed, but the bears are gaining ground.
It is possible to see a drop in the coming days.
It is not necessary to see a drop right away tomorrow because we are about to witness a major crash, the biggest in years. This move is being consolidated, the build-up process. So it can happen that the market continues to fluctuate. Going sideways, a little up, a little down. In this way, when sellers are fully positioned, the catalyst comes out; some sort of news related event, then we get the crash.
The crash can happen tomorrow just as it can happen next week or next month. The market tends to take as long as it needs, but NVIDIA isn't going up. This is a bearish chart. Bearish as in bearish potential.
135, 111 followed by 90. More or less.
These are the levels that will become relevant in the coming days.
Thank you for reading.
When a market grows for years then suddenly stops, it is time to run away.
There is still time to sell while the action happens close to resistance. There is no way that this market will start a new bull run with this chart structure. First comes a correction and then a new cycle can start. The market moves in waves.
The period of expansion being over, we will see a phase of contraction now, a major correction. Something the majority of holders do not expect. Holders not traders. Traders are ready and prepared. Somehow, they always know.
Namaste.
D-Wave 2026: Quantum Scale Amidst the NVIDIA HypeD-Wave Quantum Inc. reclaimed the financial spotlight in April 2026. A dramatic 46% stock surge followed NVIDIA’s latest quantum computing integration. However, beneath this "NVIDIA hype" lies a complex web of strategic challenges. This article analyzes the forces driving D-Wave’s current market volatility.
Geostrategy and the Quantum Race
Quantum supremacy has moved from laboratory theory to a matter of national security. The United States and its allies view quantum infrastructure as a critical defense pillar. D-Wave benefits from this geostrategy through government contracts and research grants.
Strategic sovereignty drives investments in domestic superconducting chip fabrication. Any disruption in global semiconductor supply chains poses a risk to D-Wave’s hardware timeline. Investors must watch international trade policies closely as quantum technology becomes a regulated export.
The NVIDIA Catalyst and Macroeconomics
NVIDIA’s recent "quantum bet" acted as a massive macroeconomic tailwind for D-Wave. The integration of quantum annealing with GPU-driven AI clusters has captivated Wall Street. This synergy suggests a new era of hybrid computing power.
Despite the surge, D-Wave faces broader economic pressures from high-interest environments. Capital-intensive tech firms require consistent growth to justify their valuations. While the "NVIDIA effect" provides momentum, long-term stability depends on sustainable commercial revenue.
Industry Trends and New Competition
New-to-market quantum firms are aggressively challenging D-Wave’s early lead. These rivals utilize diverse architectures, including trapped-ion and neutral-atom technologies. D-Wave’s focus on quantum annealing distinguishes it, but also limits its general-purpose applications.
The industry is shifting toward "Quantum-as-a-Service" (QaaS) business models. Companies now prioritize cloud-based accessibility over selling physical hardware. D-Wave must innovate its Leap™ cloud platform to maintain its competitive edge against agile newcomers.
Technology, Science, and Patent Analysis
D-Wave’s Advantage2™ system represents the pinnacle of current quantum annealing science. Patent analysis reveals a significant fortress of intellectual property surrounding superconducting qubits. These patents protect D-Wave from direct imitation by emerging hardware startups.
High-tech advancements in dilution refrigeration allow for more stable quantum operations. However, the science of error correction remains a primary hurdle for the entire sector. D-Wave’s ability to scale qubit counts while reducing noise will determine its future dominance.
Cybersecurity and the Quantum Threat
The rise of quantum computing creates an existential threat to current encryption standards. Cybersecurity firms are racing to develop post-quantum cryptography (PQC) to protect global data. D-Wave’s systems, while optimization-focused, contribute to the urgency of this transition.
Strategic leadership must position D-Wave as a partner in security, not just a disruptor. Protecting the integrity of quantum-classical data flows is now a technical priority. A single breach could undermine the trust required for enterprise-level adoption.
Management, Leadership, and Culture
CEO Alan Baratz has adopted an assertive stance regarding the company’s market position. He recently warned that while NVIDIA’s interest is validating, D-Wave must own its ecosystem. This leadership style prioritizes operational independence and aggressive commercialization.
Company culture at D-Wave emphasizes rapid iteration and high-performance engineering. Maintaining this innovation pace is difficult as the firm transitions from R&D to a commercial powerhouse. Effective management will be the deciding factor in navigating the 2026 quantum landscape.

NVIDIA: Sell signal flashing on Megaphone's Top.NVIDIA is almost overbought on its 1D technical outlook (RSI = 69.771, MACD = 3.340, ADX = 32.679) with the price about to test the HH top of the 4 month Megaphone. The current 2 week rally has averted a 1D Death Cross, which may still be formed if the price gets rejected on this top, which is highly likely. If that happens, the 1D Death Cross may enforce a bigger correction but technically within the structure of this Megaphone, the target is the 1.236 Fibonacci extension (TP = 156.00).
See how our prior idea has worked out:
## If you like our free content follow our profile to get more daily ideas. ##
## Comments and likes are greatly appreciated. ##

Nvidia Rebounds After A Correction, Bullish Momentum BuildsNVIDIA is recovering nicely, and a closer look suggests the market may have completed a counter-trend W-X-Y correction within the channel—especially after the rebound from the 160–153 support zone we highlighted earlier. This development increases the likelihood that the correction phase is already behind us. However, more cautious traders may still prefer to wait for a confirmed breakout above the channel resistance to validate that bulls are fully in control.
From a tactical perspective, any near-term pullbacks could present opportunities to rejoin the broader uptrend. If price reacts from the current channel resistance, the first support to monitor comes in around 177, while the key invalidation level stands at 164.
On the upside, the 198 level remains an important temporary resistance. A sustained break above this zone would open the path toward the November highs, signaling potential continuation of the larger bullish trend.
Momentum indicators are also aligning with this outlook. The RSI is recovering back above the 50 level, which supports the idea that bullish momentum may be returning to the market.
Highlights:
Correction may be complete, forming a W-X-Y structure
Support at 177 on pullbacks; invalidation level at 164
Resistance at 198; breakout could lead toward prior highs
RSI back above 50, signaling strengthening bullish momentum

Nvidia - Starting the final bearish drop!💩Nvidia ( NASDAQ:NVDA ) can drop a final -20%
🔎Analysis summary:
A couple of months ago, Nvidia perfectly retested the major channel resistance trendline. Thus we already witnessed a clear rejection of about -20%. And looking at the higher timeframe, Nvidia can still drop another -20% before it will retest a major support level.
📝Levels to watch:
$150
SwingTraderPhil
SwingTrading.Simplified. | Investing.Simplified. | #LONGTERMVISION

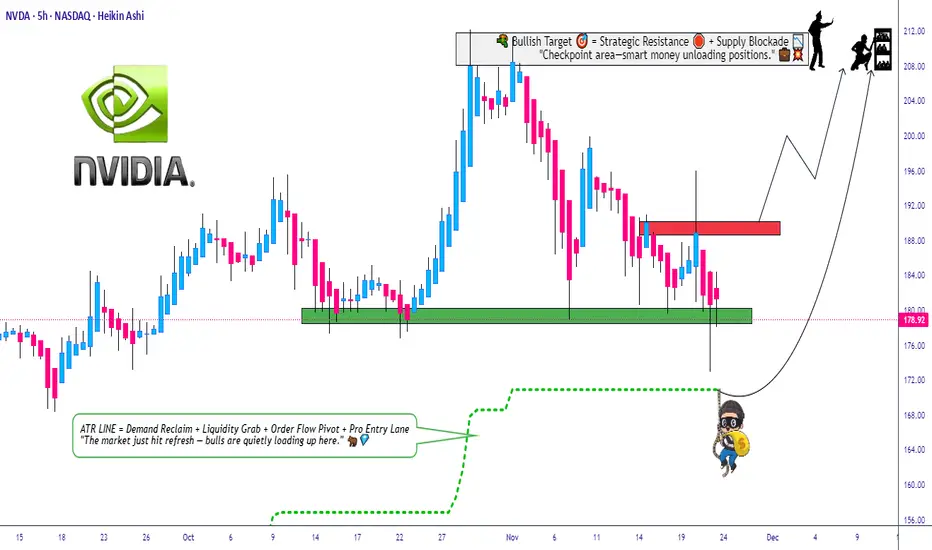
Can NVDA Hold the Pullback Zone and Extend the Uptrend?🔥 NVDA Bullish Pullback Playbook – Thief-Style Swing Setup 🚀🕵️♂️
Hey traders & my fellow Thief OG’s 😎🕶️ — here’s a clean, polished, TradingView-friendly version of my NVDA Swing Trade Playbook with a professional + funny touch. Let’s get to the setup 👇🔥
📌 Asset
NVDA – NVIDIA Corporation (NASDAQ)
Swing Trade | Momentum | Trend-Following Setup
📈 Plan: Bullish Pullback Strategy (Pending Orders Active)
The trend is strong, the buyers are steady, and NVDA is still delivering clean higher-lows. We're waiting for either a breakout continuation or a discounted pullback entry. 📊⚡
🎯 Entry Zones
1️⃣ Breakout Entry – Momentum Thief Mode 🥷⚡
Enter after clearing the nearest resistance at $191.00
• Clean breakout
• Volume confirmation
• Trend continuation strength
2️⃣ Pullback Entry – SuperTrend ATR Sniper Entry 🎯📉
Watch for a discounted pullback near $170.00 around the SuperTrend ATR zone.
• Trend support retest
• Lower-risk entry
• Ideal for swing traders who wait for “patience-pays entries” 😎
🛡️ Stop-Loss (Thief Style – Risk First)
Breakout Entry SL → $180.00
SuperTrend Pullback SL → $160.00
Note: Dear Ladies & Gentlemen (Thief OG’s) ❤️
I’m NOT recommending you use only my SL. Choose your own levels — you make the money, you protect the money. Trade at your own risk 🔐⚠️
🎯 Target (Take-Profit Zone)
Our target → $210.00
Why?
• Strong resistance zone
• Overbought region historically
• Buyer trap zone where police force 🚔👮♂️ usually waits — so escape with profits early 😂💨
Note: Dear Ladies & Gentlemen (Thief OG’s) 🙌
I’m NOT recommending you set my TP only. Choose your own TP — your money, your exit. Trade with responsibility 💼💰
🔍 Related Pairs to Watch (Correlation Insights + Key Notes)
NASDAQ:AMD
• High positive correlation with NVDA
• When AMD shows volume expansion, NVDA often follows
• Good for momentum confirmation 🔥
NASDAQ:SOXX (iShares Semiconductor ETF)
• NVDA is a major weighted component
• ETF direction confirms big-money flow 🧠💸
• Great for spotting sector-wide risk-on / risk-off shifts
NASDAQ:QQQ (NASDAQ 100 ETF)
• NVDA is one of the heaviest weights
• If QQQ trends strongly → NVDA often mirrors
• Macro sentiment index for tech strength 📊⚡
NASDAQ:SMH (VanEck Semiconductor ETF)
• Clean supply/demand signals
• NVDA mirrors SMH breakouts frequently
• Helps confirm breakout validity before taking the trade
All these help you avoid fakeouts and align with overall semiconductor market strength.
✨ “If you find value in my analysis, a 👍 and 🚀 boost is much appreciated — it helps me share more setups with the community!”
⚠️ This is a thief-style trading strategy created just for fun. Trade responsibly.
NVIDIA On the brink of a strong correction towards $110.NVIDIA Corporation (NVDA) hit last month its 1W MA50 (blue trend-line) but despite marginally breaking below it, the price managed to close the 1M candle above it, thus so far supporting the market.
This is a critical Support trend-line as every time NVIDIA broke and closed below it within its 11-year Channel Up, the price dropped further, touching the Higher Lows trend-line shown on the chart.
That has been particularly evident during Bear Cycles (technically the Bearish Legs of the Channel Up), which also hit and bottomed on the 1W MA200 (orange trend-line). The 2022 Bear Cycle even bottomed marginally below the 0.382 Fibonacci retracement level (blue) from the previous bottom, while the 2018 Bear Cycle just above it.
Notice that all Bear Cycles started after an aggressive 1M RSI Bearish Divergence was completed, which is what we have right now.
So a break below the 1W MA50 would practically confirm a new Bear Cycle and the minimum target would be the 1W MA200 and the Higher Lows trend-line around $110. This time the 0.382 Fib is considerably below it.
An additional powerful Buy Signal for the long-term, is the 1M RSI 42.00 Support. Both previous Bear Cycles bottomed exactly on it (September 2022 and December 2018 respectively).
---
** Please LIKE 👍, FOLLOW ✅, SHARE 🙌 and COMMENT ✍ if you enjoy this idea! Also share your ideas and charts in the comments section below! This is best way to keep it relevant, support us, keep the content here free and allow the idea to reach as many people as possible. **
---
💸💸💸💸💸💸
👇 👇 👇 👇 👇 👇

Nvidia: Correction CompleteNvidia recently showed a clear move to the upside, leading us to view the previous correction as complete and to prepare for further gains in the near term. Currently, we see NVDA in the final upward stage of a broader bullish cycle and are looking for further gains into our red Target Zone ($227.38–$260.60). The cycle top is expected to form within this range. In our alternative scenario, NVDA may have already completed the upward cycle with the peak at $212.16. If so, the stock would now be in a broader correction and could next fall below support at $145.50 (probability: 33%).

NVDA does not look goodLooks like a 2021 fractal to me. Maybe AI can over power this but it's looking really ugly. Most stocks have been hammered and often the bubble stocks are the last to pop. Just look at how horrendous almost every other tech stock looks (for months now). Paypal,snap, xyz, etc... look like memecoin that was rug pulled.

NVIDIA: Correction can resume towards 150-Strong supportNVIDIA is moving lower and is now breaking out of a corrective channel, which confirms that wave C is in progress. Keep in mind that wave C should unfold in five subwaves, and if we look at the drop from 197, it seems we are still in wave three, so there is likely more downside ahead before this move completes. Ideally, the market could find support around 152, which aligns with the January 2025 high and stands out as a key level that could stabilize the decline. Until then, the current structure suggests ongoing weakness.
If that support fails, then it raises a bigger concern for the broader tech space, as this could signal a deeper and more aggressive correction.
Highlights
. Wave C in progress with five-wave structure expected
. Current move likely still in wave three of C headed to ley support at 152
. Break below support increases risk of deeper tech sell-off

$NVDA bulls may not want to hear this, but the chart is flashingThis exact setup has appeared twice before on the long term chart, and both times it led to a brutal correction:
56% drawdown
66% drawdown
Now the same structure looks like it’s forming again.
I’m not saying NASDAQ:NVDA has to repeat that full move this time
the company is much larger now
but even a more conservative correction could still mean a drop toward $125.
That would be roughly a 40% pullback from the highs.
Am I too bearish here, or is the market ignoring the obvious?

NVDA Sell-Off Gaining Steam?Primary Scenario
At this stage, we see NVDA in the final phase of a broader intermediate correction. We expect the corresponding low to form above support at $145.50, and therefore also above our stop at $137, which protects our long position from April 8, 2025. Afterward, we’re looking for a move higher into our red Target Zone ($227.38–$260.60), where the current long-term uptrend should wrap up.
Alternative Scenario
In our alternative scenario, NVDA may have already completed its upward cycle with the peak at $212.16. If that’s the case, the stock would already be in a long-term correction and would next break below support at $145.50 (probability: 33%).
The corresponding targets for this then primary scenario will be discussed as soon as that potential scenario proves itself.
