Nvidia continues to hit new highsIt has been a strong start to the week for Nvidia, with the stock posting a daily gain of more than 3.5%. Over the last two trading sessions, the price has advanced by more than 7%, highlighting a strong bullish bias in current price action.
Buying pressure has been supported by expectations of solid demand in the artificial intelligence sector, along with positive outlooks for upcoming tech earnings. This has allowed the stock to continue printing new short-term highs.
However, it is important to note that any negative developments that weaken market confidence could trigger meaningful profit-taking, especially given that the stock is trading near all-time highs.
Uptrend remains intact: Over recent weeks, optimism around Nvidia has allowed the price to break out of the sideways range that had been in place since late 2025. This breakout not only invalidated the previous structure but also reinforced a solid bullish bias, resuming the longer-term uptrend that has been in place for several months.
In this context, the upward trendline once again becomes the key technical reference. That said, the pace of the recent rally has been quite strong, which could open the door to short-term corrections.
RSI: While the RSI remains above the 50 level, it has now moved into overbought territory (above 70), suggesting a potential imbalance driven by strong buying momentum. This could lead to short-term pullbacks.
MACD: A similar signal is emerging in the MACD, where the price continues to make higher highs while the indicator shows lower highs. This points to a bearish divergence, which may indicate fading momentum and the potential for corrective moves in the near term.
Key levels to watch:
$220: With no historical references above current levels, this stands as the nearest psychological barrier. Sustained moves above this level could reinforce a more aggressive bullish trend in the short term.
$197: A nearby support level just below the $200 psychological area. This level could act as a key reference in the event of short-term corrections.
$185: Key support aligned with the 50 and 200-period moving averages. A move toward this level could weaken the current bullish structure and open the door to a more pronounced phase of indecision.
Written by Julian Pineda, CFA, CMT – Market Analyst
Nvidiacorporation

Fundamental and Technical Signals Align in NVDAFundamental and Technical Signals Align in NVDA
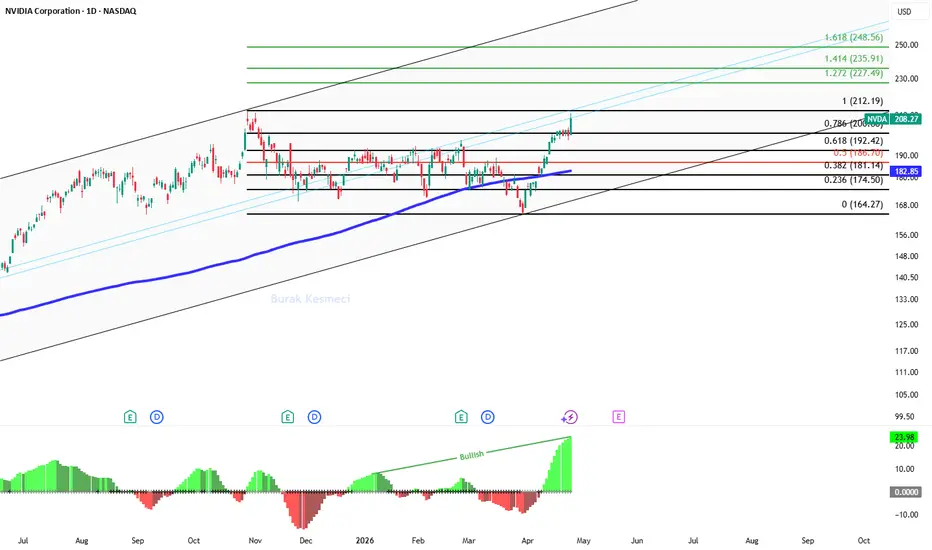
NVDA at $208.27 is displaying a rare technical-fundamental convergence with both valuation compression and squeeze momentum breakout pointing in the same direction.,
What story is the fundamental side telling?
With Wall Street analysts forecasting 73.9% earnings growth for NVDA, the current P/E ratio of 40.5 standing 2.27 times higher than the forward P/E of 17.8 indicates an expected valuation compression exceeding 50% in the coming period, and this figure presents strong repricing potential for a stock positioned significantly below the Nasdaq 100's forward P/E average of 22.4. The $5 trillion market cap company being backed by 44 analysts with a "Strong Buy" recommendation signals that institutional consensus shares this valuation compression expectation and strengthens the argument that profitability growth has not yet been fully reflected in prices.
The forward P/E remaining below the index's 5-year average of 25 reveals that NVDA is still priced in a discounted zone despite its growth story.
What signal is technical momentum giving?
With price trading 13.9% above the 200-day moving average at $182.85, the squeeze momentum indicator's jump from 0 to 23.98 shows the volatility compression breaking to the upside, and this breakout typically serves as a precursor to strong trend-directional moves. The $11.14 daily movement within the $199.81-$210.95 band (5.6% intraday volatility) signals the squeeze explosion gaining momentum, and the current price at $208.47 maintains the strength of the upward structure by positioning significantly above the 0.786 fibonacci level at $200.
Volume-wise, the 214 million lots traded exceeding the average indicates continued institutional participation, and the $181-$192 consolidation band now forming a strong support foundation reduces the pullback risk in upward price movements.
Why does this combination matter?
The valuation compression scenario supported by a 73.9% earnings growth expectation on the fundamental side, when combined with squeeze momentum breakout on the technical side, creates a rarely seen structure, and this situation forms a profile that can simultaneously attract the interest of both value and momentum investors.
The forward P/E being at 17.8 shows that even if prices rise to the $227-$235 band, assuming earnings expectations materialize, the valuation would not move into an excessively expensive zone, and this calculation draws a picture consistent with Fibonacci's upper extension targets. The squeeze momentum's "Bullish" trend signal combined with the 23.98 reading reveals that the uptrend wave starting from $164.27 maintains its acceleration potential, and the fundamental outlook supported by the consensus of 44 analysts confirms there is a strong fundamental foundation behind the technical breakout.
Which levels are critically important?
If persistence above the $212.19 resistance is achieved, both continuation of squeeze momentum and progress toward fundamental valuation targets can be expected, in which case the $227.49 and $235.91 levels could come into play as upside targets, however declines below the $200 level where the 0.786 fibonacci support breaks could signal weakening squeeze momentum, and in that scenario the $192.42 level could serve as the first test point.
On the fundamental side, if 2026 earnings figures come in lower than expected, the forward P/E rising from the 17.8 level could eliminate the valuation advantage, and in that case the 200-day moving average at $182.85 on the technical side could be expected to emerge as a critical support area.
Thanks for reading.
NVIDIA - Big Move Loading Above ResistanceNVIDIA was moving sideways and downward for a while, indicating no clear trend. Now, the price has bounced strongly from around 164 , suggesting sellers are losing control. This suggests the correction may be ending, but the uptrend is not confirmed yet.
Right now, the Stock is near an important level around 197 . If it breaks and stays above it, a strong move up can follow. If it fails, expect more slow and choppy movement. The security has already broken out the parallel channel on the daily timeframe chart. Upside targets after a pullback are 205 - 210.
We will update further information soon.
By @BrightRally_Research

Nvidia - Initiating new all time highs!🧸Nvidia ( NASDAQ:NVDA ) is heading for new highs again:
🔎Analysis summary:
Nvidia still remains in a clear underlying bullrun. And while everyone was waiting for an all time high break and retest, Nvidia formed new structure. With the major horizontal level holding price, it seems like Nvidia is now just really rallying towards fresh all time highs.
📝Levels to watch:
$175
🙏🏻Trusting the Trading Gods

NVIDIA bearish & bullish · NVDA in bearish dominionNVIDIA has been moving sideways. It is a strong chart but has bearish potential. The price is very strong but...
Good evening my fellow trader, I hope you are having a wonderful day.
Here is the tricky situation with NVDA. Bearish or bullish?
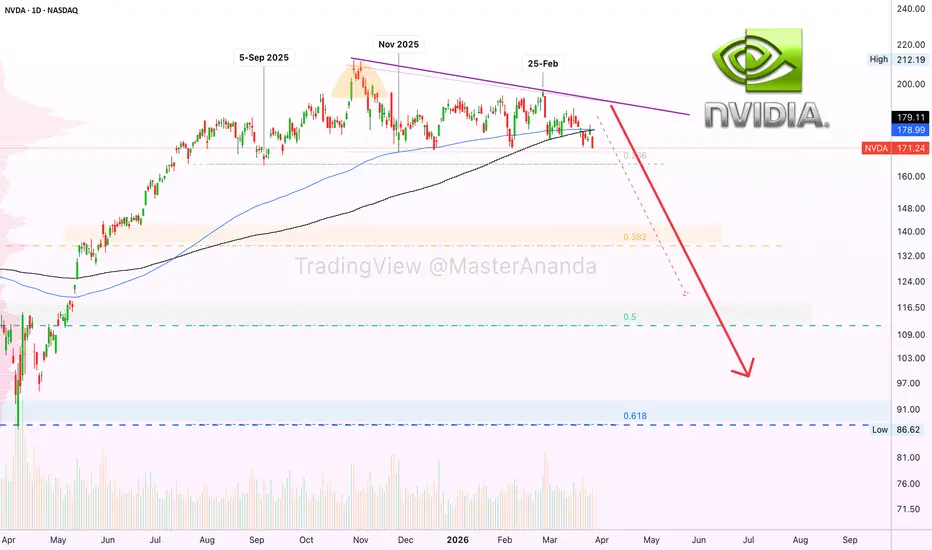
The low from September 2025 remains unchallenged, which is bullish. The low from late November 2025 also remains unchallenged. When NVDA moved down that month it found support at EMA144 (blue line on the chart).
It has been sideways. There is a top with an inverted cup pattern (October). In late February, a month ago, we have a lower high.
Here we start to see the mixture of signals. The support levels that were activated remain unchallenged, but there are no new highs and even a lower high is now in place.
The lows from September and November are not tested but the chart continues to weaken. The market found support at EMA144 back then.
Yesterday, NVDA challenged EMA144 as resistance and there was a rejection. So the action is already below this level which was a support last year. And then comes MA200.
Yesterday NVDA lost two support levels at once, EMA144 and MA200, two long-term moving averages. This signal coupled with the lower high, has more meaning than the lack of new lows. It is mixed, but the bears are gaining ground.
It is possible to see a drop in the coming days.
It is not necessary to see a drop right away tomorrow because we are about to witness a major crash, the biggest in years. This move is being consolidated, the build-up process. So it can happen that the market continues to fluctuate. Going sideways, a little up, a little down. In this way, when sellers are fully positioned, the catalyst comes out; some sort of news related event, then we get the crash.
The crash can happen tomorrow just as it can happen next week or next month. The market tends to take as long as it needs, but NVIDIA isn't going up. This is a bearish chart. Bearish as in bearish potential.
135, 111 followed by 90. More or less.
These are the levels that will become relevant in the coming days.
Thank you for reading.
When a market grows for years then suddenly stops, it is time to run away.
There is still time to sell while the action happens close to resistance. There is no way that this market will start a new bull run with this chart structure. First comes a correction and then a new cycle can start. The market moves in waves.
The period of expansion being over, we will see a phase of contraction now, a major correction. Something the majority of holders do not expect. Holders not traders. Traders are ready and prepared. Somehow, they always know.
Namaste.
Nvidia - Starting the final bearish drop!💩Nvidia ( NASDAQ:NVDA ) can drop a final -20%
🔎Analysis summary:
A couple of months ago, Nvidia perfectly retested the major channel resistance trendline. Thus we already witnessed a clear rejection of about -20%. And looking at the higher timeframe, Nvidia can still drop another -20% before it will retest a major support level.
📝Levels to watch:
$150
SwingTraderPhil
SwingTrading.Simplified. | Investing.Simplified. | #LONGTERMVISION

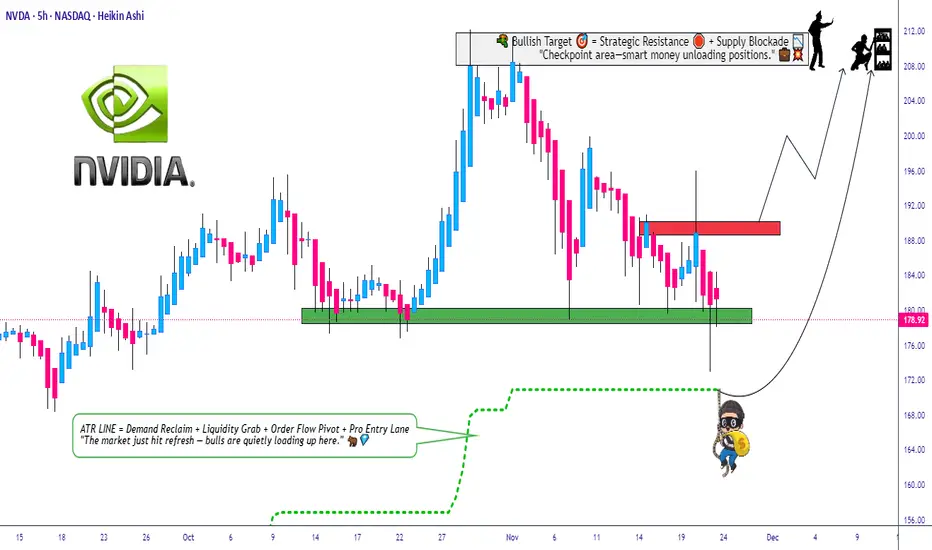
Can NVDA Hold the Pullback Zone and Extend the Uptrend?🔥 NVDA Bullish Pullback Playbook – Thief-Style Swing Setup 🚀🕵️♂️
Hey traders & my fellow Thief OG’s 😎🕶️ — here’s a clean, polished, TradingView-friendly version of my NVDA Swing Trade Playbook with a professional + funny touch. Let’s get to the setup 👇🔥
📌 Asset
NVDA – NVIDIA Corporation (NASDAQ)
Swing Trade | Momentum | Trend-Following Setup
📈 Plan: Bullish Pullback Strategy (Pending Orders Active)
The trend is strong, the buyers are steady, and NVDA is still delivering clean higher-lows. We're waiting for either a breakout continuation or a discounted pullback entry. 📊⚡
🎯 Entry Zones
1️⃣ Breakout Entry – Momentum Thief Mode 🥷⚡
Enter after clearing the nearest resistance at $191.00
• Clean breakout
• Volume confirmation
• Trend continuation strength
2️⃣ Pullback Entry – SuperTrend ATR Sniper Entry 🎯📉
Watch for a discounted pullback near $170.00 around the SuperTrend ATR zone.
• Trend support retest
• Lower-risk entry
• Ideal for swing traders who wait for “patience-pays entries” 😎
🛡️ Stop-Loss (Thief Style – Risk First)
Breakout Entry SL → $180.00
SuperTrend Pullback SL → $160.00
Note: Dear Ladies & Gentlemen (Thief OG’s) ❤️
I’m NOT recommending you use only my SL. Choose your own levels — you make the money, you protect the money. Trade at your own risk 🔐⚠️
🎯 Target (Take-Profit Zone)
Our target → $210.00
Why?
• Strong resistance zone
• Overbought region historically
• Buyer trap zone where police force 🚔👮♂️ usually waits — so escape with profits early 😂💨
Note: Dear Ladies & Gentlemen (Thief OG’s) 🙌
I’m NOT recommending you set my TP only. Choose your own TP — your money, your exit. Trade with responsibility 💼💰
🔍 Related Pairs to Watch (Correlation Insights + Key Notes)
NASDAQ:AMD
• High positive correlation with NVDA
• When AMD shows volume expansion, NVDA often follows
• Good for momentum confirmation 🔥
NASDAQ:SOXX (iShares Semiconductor ETF)
• NVDA is a major weighted component
• ETF direction confirms big-money flow 🧠💸
• Great for spotting sector-wide risk-on / risk-off shifts
NASDAQ:QQQ (NASDAQ 100 ETF)
• NVDA is one of the heaviest weights
• If QQQ trends strongly → NVDA often mirrors
• Macro sentiment index for tech strength 📊⚡
NASDAQ:SMH (VanEck Semiconductor ETF)
• Clean supply/demand signals
• NVDA mirrors SMH breakouts frequently
• Helps confirm breakout validity before taking the trade
All these help you avoid fakeouts and align with overall semiconductor market strength.
✨ “If you find value in my analysis, a 👍 and 🚀 boost is much appreciated — it helps me share more setups with the community!”
⚠️ This is a thief-style trading strategy created just for fun. Trade responsibly.
Nvidia: Correction CompleteNvidia recently showed a clear move to the upside, leading us to view the previous correction as complete and to prepare for further gains in the near term. Currently, we see NVDA in the final upward stage of a broader bullish cycle and are looking for further gains into our red Target Zone ($227.38–$260.60). The cycle top is expected to form within this range. In our alternative scenario, NVDA may have already completed the upward cycle with the peak at $212.16. If so, the stock would now be in a broader correction and could next fall below support at $145.50 (probability: 33%).

Nvidia - Starting the final -15% correction!⚡️Nvidia ( NASDAQ:NVDA ) is heading for the last drop:
🔎Analysis summary:
Nvidia has just been consolidating for the past six months. But considering the recent retest of the resistance trendline, a final rejection lower would make perfect sense. And with today's significantly bearish candle, Nvidia is starting the ultimate -15% correction.
📝Levels to watch:
$150
SwingTraderPhil
SwingTrading.Simplified. | Investing.Simplified. | #LONGTERMVISION

Nvidia: Top Established!Nvidia has recently pushed to a fresh local high, but it then rolled over into a sharp selloff. As a result, we now view the latest smaller upswing as complete, and place price action in the final downswing of the current broader intermediate correction. We expect the corresponding low to form above the $145.50 support level. After that, we’re looking for a rebound into our red Target Zone ($227.38 to $260.60), where the ongoing higher-level bullish cycle should also be completed. In the alternative scenario, the broader upcycle may have already topped out at the $212.16 peak. In that case, the stock would already be in a higher-level correction and would next break below the $145.50 support (probability: 33%).

Nvidia turns bearish, below 100 possibleEMA144 has been working as support for months for NVDA, ever since late November 2025. This level continues to be tested. With each test, it becomes weaker. Each test is happening after the confirmation of resistance and an inverted cup-pattern and all-time high. A major crash is upon us.
Nvidia's all-time high happened late October 2025. It was confirmed a few days after in early November and the chart ended with an inverted cup-pattern, a major bearish reversal signal.
A move below EMA55 and EMA89 fully confirms the start of a bearish period for any market. It is a very simple yet powerful signal. Hard to miss, highly accurate. When looking at it in the context of the broader chart and market, it never fails.
Here, NVDA moved and closed below EMA55 & EMA89 with very high bearish volume, giving further validity to the breakdown of this support. What is worse, EMA144 was lost recently and this moving average is many times stronger compared to the other two.
When trading moves below EMA144 after a major high, bearish action can happen not only short-term and mid-term, but also long-term is possible. That's how bad things are about to become.
There is a wide range that needs to be tested as support based on the current chart structure. We are looking at 111.1 as being the minimum and a good target, with 100, 90 and even 80 possible as the bearish move reaches its climax. This market can go down for months.
The market showed some relief recently but it all ended late February. Everything is about to speed up in the wrong direction. There is some positive news though.
Once the correction is over, once the bear market reaches its end, we are set to experience long-term growth. A relatively mild bear market will be followed by years of sustained growth.
A correction like what we are about to experience can be just a blip when comparing the bigger picture. After growth non-stop for years on end, a multiple longs correction is expected if not welcome. Position yourself to take advantage of what is about to happen. I hope this information finds you well.
Thank you for reading.
Namaste.

NVDA Shares Surpass $200 in After-Hours Post-Earnings ReportNVDA Shares Surpass $200 in After-Hours Post-Earnings Report
Yesterday, the world’s most valuable company, Nvidia, released its quarterly earnings, which exceeded expectations:
→ Earnings per share: actual = $1.62 (forecast = $1.53);
→ Revenue: actual = $68.13 billion (forecast = $66.13 billion).
Sentiment was further supported by the chipmaker’s guidance for first-quarter revenue above market estimates, reflecting continued heavy spending by major technology companies on artificial intelligence processors.
As the Nvidia (NVDA) share price chart shows, the stock rose above the psychological $200 level in after-hours trading, but subsequently pulled back, which may point to excessive optimism and aggressive selling pressure.
Technical Analysis of the Nvidia (NVDA) Chart
On 10 February, when analysing NVDA price movements, we:
→ reaffirmed the validity of the long-term ascending channel (which remains intact) and highlighted the importance of the $192.50 resistance level;
→ suggested that the initiative was on the side of the bulls, who were aiming to resume the long-term uptrend towards the psychological $200 mark.
Since then:
→ NVDA formed a pullback from the указанного resistance level towards the 50–61.8% Fibonacci retracement zone;
→ on 17 February, it resumed its advance, supported by a short-term ascending channel (marked in black), ultimately reaching $200.
Overall, the picture appears constructive, and the next potential target for NVDA may be the median line of the long-term channel. However, it is worth recalling the recent experience of other technology giants whose shares rallied briefly after earnings before turning lower (for example, Meta). The sharp reversal from above the $200 mark lends weight to this scenario.
Therefore, if bulls are to confirm control over NVDA shares, it is important for the price to hold above the $192.50 level.
This article represents the opinion of the Companies operating under the FXOpen brand only. It is not to be construed as an offer, solicitation, or recommendation with respect to products and services provided by the Companies operating under the FXOpen brand, nor is it to be considered financial advice.

Nvidia approaches $200 ahead of earningsOver the last two trading sessions, Nvidia shares have posted gains of more than 3%, reflecting a consistent buying bias ahead of the company’s earnings release scheduled for today’s close.
For now, the projected EPS for the quarter, covering the final months of 2025 and part of 2026, stands at $1.53 adjusted, while revenue is expected to reach approximately $66.2 billion, representing growth of nearly 68% compared to the same period last year. If the company delivers results above expectations, it could reinforce the view that demand for artificial intelligence chips remains strong in the medium term, supporting confidence in the stock.
However, this outlook will also depend on the sustainability of industry growth and Nvidia’s production capacity, which typically becomes clearer in management’s post-earnings commentary. If both the reported figures and forward guidance remain positive, they could support more consistent buying pressure in the short term. On the other hand, any signs of slowing demand or production related to AI components could raise concerns and lead to a period of post-earnings indecision.
Price attempts to break the multi-month sideways range
Since September 2025, Nvidia’s stock price has remained within a relevant sideways range, with resistance around $193 and support near the psychological $170 level. However, in sessions leading up to the earnings release, buying momentum has increased, with price action attempting to move above the range that has dominated recent months.
A positive post-earnings scenario could help consolidate a more dominant buying bias and potentially lead to the formation of a short-term upward trendline. Still, this will largely depend on whether buying pressure remains consistent in upcoming sessions.
RSI
The RSI remains above the neutral 50 level, suggesting that bullish momentum over the last 14 sessions has regained relevance. However, the indicator is gradually approaching the overbought zone near 70, which could open the door to short-term technical pullbacks if that level is reached.
MACD
Meanwhile, the MACD histogram remains above the zero line, indicating that short-term moving averages continue to reflect bullish momentum. As long as this dynamic holds, it could support further buying pressure in the coming sessions.
Key levels to monitor
$208 – Major resistance: This level aligns with recent highs and represents the most relevant resistance on the chart. Sustained moves toward or above this level could consolidate a dominant buying bias and reactivate an upward structure similar to that seen in the first half of 2025.
$185 – Near-term neutrality zone: This area aligns with the 50-period simple moving average. A sustained move back toward this level could weaken recent buying momentum and restore relevance to the broader sideways range.
$170 – Critical support: This psychological level sits near the 200-period simple moving average. A break below this area could revive a more structural bearish bias and potentially trigger the formation of a short-term downward trend.
Written by Julian Pineda, CFA, CMT – Market Analyst

Nvidia - What a consolidation!🥽Nvidia ( NASDAQ:NVDA ) is just moving sideways:
🔎Analysis summary:
For more than the past six months, Nvidia has overall been moving sideways. But looking at the higher timeframe, it is still pretty likely that Nvidia will create a shorter term correction. This will then lead to a major bullish break and retest and new all time highs.
📝Levels to watch:
$150
SwingTraderPhil
SwingTrading.Simplified. | Investing.Simplified. | #LONGTERMVISION

Nvidia (NVDA) Shares Rise Towards a Key Resistance LevelNvidia (NVDA) Shares Rise Towards a Key Resistance Level
As the Nvidia (NVDA) share chart shows, during yesterday’s trading session the price advanced towards a key resistance area around $192.50, where notable peaks were formed in December 2025 and January 2026. The move was supported by several factors that boosted optimism:
→ Comments from company management. Nvidia CEO Jensen Huang stated that rising spending on AI is justified and reflects a long-term growth phase for the industry.
→ Goldman Sachs analyst Jim Schneider expects Nvidia’s fourth-quarter revenue to exceed forecasts and surpass $67 billion, and also anticipates strong sales and profit figures in the first quarter of the 2026 financial year.
Technical Analysis of the Nvidia (NVDA) Chart
On the morning of 4 February, when analysing NVDA price movements, we:
→ updated the long-term ascending channel, which remains intact;
→ noted the proximity of its lower boundary, which had acted as a key support level for many months;
→ suggested that NVDA’s price could stabilise in the lower quarter of the channel.
Since then:
→ between 4 and 6 February, the price moved sideways near the lower boundary of the channel, reflecting a balance between supply and demand;
→ following a false break below the December low, the share price staged a sharp rebound, signalling the dominance of buying pressure.
It is reasonable to assume that:
→ the initiative is currently on the side of the bulls, who appear determined to resume the long-term upward trend;
→ if another attempt is made to break through the aforementioned resistance level, it is likely to succeed, opening the way for NVDA shares to move towards the psychological $200 mark.
The realisation of this scenario could be supported by positive sentiment ahead of Nvidia’s earnings release on 25 February and the GTC 2025 conference in mid-March, when new product announcements may be made.
This article represents the opinion of the Companies operating under the FXOpen brand only. It is not to be construed as an offer, solicitation, or recommendation with respect to products and services provided by the Companies operating under the FXOpen brand, nor is it to be considered financial advice.

Can NVDA Run Again? Bullish Pullback Explained🚀 NVIDIA (NVDA) - AI EMPIRE'S GOLDEN BREAKOUT: THE THIEF'S PROFIT BLUEPRINT 💰
📊 MARKET SNAPSHOT | Real-Time Data (Feb 9, 2026)
Current Price: $185.41 💵
52-Week Range: $86.62 - $212.19 📈
Market Cap: $4.67 Trillion 🌍
P/E Ratio: 45.92x (Forward Growth Justified ✅)
Analyst Consensus: STRONG BUY (59 Buy | 1 Sell)
Price Target (12M): $257.35 (+38.8% Upside Potential) 🎯
🎭 THE THIEF'S PLAYBOOK | Day/Swing Trade Strategy
ENTRY SIGNAL 🔥
BREAKOUT ABOVE RESISTANCE ZONE @ $194.00
This level represents a critical resistance confluence zone where multiple selling pressure has accumulated historically
Confirmation: Break + Volume surge above 200M shares = Green light for thief entry
Optimal Entry Window: Within 2-3 candles after breakout confirmation
Risk/Reward Ratio: 1:3.2 (Exceptional for swing traders)
TARGET ZONES 🎪
Primary TP @ $210.00 (Moving Average Police Barricade) 📍
The 50-day exponential moving average ($183.50) aligns with 200-day MA ($180.40), creating a bullish "Golden Cross"
This golden cross indicates strong short-term momentum exceeding long-term trend—classic bull signal
Secondary Target @ $215.00-$220.00 if momentum sustains (overbought trap escape hatch)
Risk Alert ⚠️: At these elevated levels, OVERBOUGHT RSI conditions (65+) require profit-taking discipline—this is where thieves get caught
Why $210.00 Matters:
Aligns with institutional resistance + historical consolidation breakout
Provides healthy 13.5% profit capture window before reversal risk intensifies
Sweet spot where momentum exhausts & profit-taking accelerates
STOP LOSS PROTOCOL 🛑
THE THIEF'S SAFETY NET @ $184.00
This level sits just below the critical 50-day EMA ($185.30)
Represents risk management discipline—the hedge that separates pros from liquidated amateurs
Stop Loss Width: 2.19% per share (optimal for swing traders balancing risk vs. precision)
IMPORTANT: This is our insurance policy, not our profit center—honor it religiously
📈 TECHNICAL FOUNDATION | Why This Setup Works
Moving Average Analysis 🎯
5-Day MA: 188.22 (Sell Signal - pullback zone)
10-Day EMA: 186.57 (Neutral)
20-Day MA: 186.17 (Sell Signal - distribution)
50-Day EMA: 185.30 BUY Signal ✅
100-Day MA: 181.41 (Buy Signal)
200-Day MA: 180.40 GOLDEN CROSS ✨
The Golden Cross Catalyst: When the 50-day crosses above the 200-day, historical data shows 72% of instances lead to 15-20%+ rallies within 3-6 months.
Momentum Indicators 📊
RSI (14): 42.34 (Neutral-Oversold Zone) → Plenty of room for bullish expansion
MACD: 0.53 (Buy Signal Active) ✅ → Positive momentum accumulation
ATR (14): 8.35 (High Volatility) → Larger stop losses justified; wider swing ranges expected
🌍 FUNDAMENTAL POWERHOUSE | Why NVDA Remains King 👑
Earnings Event (CRITICAL DATE) 📅
Q4 FY2026 Earnings: February 25, 2026 @ 5:00 PM ET
Expected Beat: $2 BILLION revenue surprise above consensus 🚀
Analyst Projection: "Beat & Raise" guidance → Typically catalyzes 5-10% post-earnings rallies
Last Quarter Performance: $57 billion revenue (↑62% YoY) | EPS beat by 3.10%
Revenue & Growth Acceleration 💹
Revenue: $213.3B → $316B+ (+48% Growth) 📈
EPS: $4.69 → $7.46 (+59% Growth) 🚀
Data Center Revenue: $189.5B → $280B+ (+65% Growth) 🔥
Gross Margin: 73.6% → ~75% (Industry-leading stability) ✨
The AI Infrastructure Moat 🏰
Market Dominance: 92% market share in AI training GPUs (unmatched ecosystem advantage)
CUDA Lock-In: Unparalleled software ecosystem makes switching cost prohibitive
$500B+ Order Backlog → Demand exceeds supply for 12+ months
Sovereign AI Contracts: New revenue pillar from India, Japan, Saudi Arabia partnerships
Rubin Architecture Launch (2026): Next-gen platform resets competitive benchmark
Key Catalysts & Economic Tailwinds 🌬️
✅ AI Capital Expenditure Surge: Cloud giants (Microsoft, Alphabet, Amazon, Meta) budgeting $150B+ annually for AI infrastructure
✅ Inference Phase Dominance: Workloads shifting from training (DONE) to inference (EXPLOSIVE GROWTH)
✅ Physical AI & Robotics Era: Humanoid robots & autonomous factories → Edge GPU demand explosion (Late 2026)
✅ Geopolitical Advantage: Trump admin cleared H200 sales to China → Removes revenue headwind
✅ Premium Valuation Justified: Forward PEG ratio suggests stock is reasonably valued despite 45.9x P/E
Risk Factors to Monitor ⚠️
🔴 AI Bubble Concerns: Circular financing fears in infrastructure market
🔴 Margin Compression: Gross margin guidance @ 71% for next Q (down from 73.6%)
🔴 Customer Concentration: Top customers (hyperscalers) under pressure to prove AI ROI
🔴 Competition: AMD MI400X capturing 10-12% market share; Intel's 18A foundry improving
🔴 Geopolitical: China export restrictions could limit upside if intensified
🔗 RELATED PAIRS TO WATCH | Correlation Matrix & Trading Opportunities
Semiconductor Ecosystem Trades 💎
1. TSMC ($188.50 - Taiwan Semiconductor Mfg. Co.)
Correlation to NVDA: +0.92 (Nearly Perfect Positive)
Why It Matters: Produces NVIDIA's advanced 3nm & 2nm chips; prioritized over Apple
Setup: If NVDA breaks $194, TSMC likely breaks $195 within 2-3 days
Key Level: Support @ $180 | Resistance @ $200
YoY Growth: +30% revenue growth driven by NVIDIA demand shift to Rubin
2. AMD ($18.75 - Advanced Micro Devices)
Correlation to NVDA: +0.78 (Strong Positive)
Why It Matters: Only viable alternative; MI400X series gaining traction but lagging CUDA
Setup: AMD bounces when NVDA consolidates; mirrors sentiment but at lower velocity
Key Level: Support @ $16.50 | Resistance @ $21.00
Risk Note: Recent -17% selloff in early Feb after missing growth expectations
3. SMCI ($180.20 - Super Micro Computer)
Correlation to NVDA: +0.85 (Strong Positive)
Why It Matters: Preferred partner for AI rack-scale systems; +123% YoY revenue surge
Setup: Leveraged NVDA play—often outperforms on upside, underperforms on downside
Key Level: Support @ $160 | Resistance @ $195
Volatility: 2.3x NVDA beta—use smaller position sizes
4. DELL ($85.30 - Dell Technologies)
Correlation to NVDA: +0.71 (Moderate Positive)
Why It Matters: Server hardware plays; benefits from enterprise AI infrastructure buildout
Setup: Trades NVDA trends with 1-2 day lag; more stable/less volatile
Key Level: Support @ $82 | Resistance @ $92
Advantage: Lower volatility makes it suit cautious hedge/pair trade
5. QCOM ($145.80 - Qualcomm)
Correlation to NVDA: +0.63 (Moderate Positive)
Why It Matters: Edge AI & smartphone inference plays; benefits from AI-to-edge migration
Setup: Later innings play—relevant when NVDA begins saturation consolidation
Key Level: Support @ $135 | Resistance @ $155
Inverse/Hedge Pairs (Profit during corrections)
TLT (20+ Year Treasury ETF): -0.45 correlation | Rises when risk-off sentiment hits NVDA
GLD (Gold): -0.38 correlation | Safe haven when AI trade unwinds
💡 PRE-TRADE CHECKLIST | Before Hitting That Entry Button
✅ Daily RSI between 30-60 (Enough room to run without overbought extremes)
✅ Volume confirmation: >180M shares on breakout candle (liquidity safety)
✅ No earnings events within 48 hours (Except planned catalysts like Feb 25)
✅ Broad market support: S&P 500 above key moving averages (sector tailwind)
✅ Sector rotation check: Technology sector relative strength > 1.0 (outperforming)
✅ Position size discipline: Risk only 1-2% account per trade (thief's golden rule)
📌 SUMMARY: THE PROFIT BLUEPRINT
Asset: NVDA (NASDAQ) 📊
Strategy: Bullish Breakout + MA Pullback + Overbought Escape 🎯
Entry: $194.00 (Resistance Breakout) 🟢
Target 1: $210.00 (13.5% profit) 🎪
Target 2: $215.00-$220.00 (Bonus range) 🚀
Stop Loss: $184.00 (2.19% risk) 🛑
Timeframe: 3-10 days (Swing Trade) ⏱️
Setup Quality: 7.5/10 (Solid fundamentals + Technical alignment) ✨
Catalyst: Feb 25 Earnings + Golden Cross + AI CapEx surge 💥
✨ If you find value in my analysis, a 👍 and 🚀 boost is much appreciated — it helps me share more setups with the community!
Last Updated: February 9, 2026 | Real-time market data verified across 8+ institutional sources
Thief Status: Ready to steal profits with calculated risk management 😎
Chart your path. Trust your setup. Execute with discipline. That's the thief's way. 🎯

Nvidia - This stock remains quite weak!🔮Nvidia ( NASDAQ:NVDA ) could still drop about -20%:
🔎Analysis summary:
While the entire stock market is heading for new all time highs, Nvidia is still consolidating. Considering the recent retest of the major resistance trendline, Nvidia remains quite weak. Maybe we will even see a short term -20% drop in the near future.
📝Levels to watch:
$150
SwingTraderPhil
SwingTrading.Simplified. | Investing.Simplified. | #LONGTERMVISION

Nvidia: Downward PressureAfter Nvidia initially reached a new local high, significant downward pressure recently emerged, erasing the gains from late January. Primarily, we attribute some additional upside potential to the green wave and expect its high closer to the resistance at $212.16. However, below this level, price should turn downward again with wave to complete the larger correction of beige wave IV. We anticipate the corresponding low above the support at $145.50. In the subsequent wave V, we expect increases into our red Target Zone ($227.38 – $260.60), where the large light green wave should also be completed. In our alternative scenario, NVDA might already have completed the light green wave alt. with the peak at $212.16. In this case, the stock would already be in a larger correction and would next dive below the support at $145.50 (probability: 33%).

Nvidia (NVDA) Shares Fall to a Year-to-Date LowNvidia (NVDA) Shares Fall to a Year-to-Date Low
As the Nvidia (NVDA) share price chart shows, the stock fell below $177 during yesterday’s session, marking its lowest level since the start of 2026.
Negative market sentiment is largely driven by uncertainty surrounding supplies to China. According to the Financial Times, Nvidia’s sales of H200 chips to China are still awaiting final approval from US authorities.
Yesterday’s statement from AMD, noting that the scale of its own shipments to China remains uncertain, reinforced these concerns and added further pressure to Nvidia shares. Previously, NVDA had been supported by expectations that deliveries of H200 chips to Chinese partners would begin in early 2026.
In addition, some media reports suggest that the stock is facing extra pressure from news of delayed investment in OpenAI, which is reportedly exploring alternative suppliers.
Technical Analysis of the Nvidia (NVDA) Chart
On 23 December, when analysing NVDA price action, we:
→ reaffirmed the long-term ascending channel, which remains intact;
→ suggested that bulls might attempt to break out of the corrective pattern (shown in red) in order to reach the channel median.
As expected (indicated by the black arrow), the price reached this target. However, January’s price behaviour offers little evidence that the uptrend has resumed with renewed strength.
Moreover, the red arrows highlight several bearish signals:
→ the median acted as clear resistance;
→ the 30 January peak (the highest level since the start of the year) formed with a long upper shadow, resulting in a false break of the previous high — a classic “bull trap”.
While bearish momentum appears to be in control, it is worth noting that:
→ the break below the 20 January low could also prove to be false;
→ the lower boundary of the channel, which has acted as key support for many months, is nearby.
Taking all of this into account, it is reasonable to assume that NVDA may find a period of consolidation in the lower quarter of the channel. A potential catalyst for the next major move could be the company’s earnings release scheduled for 25 February.
This article represents the opinion of the Companies operating under the FXOpen brand only. It is not to be construed as an offer, solicitation, or recommendation with respect to products and services provided by the Companies operating under the FXOpen brand, nor is it to be considered financial advice.

Nvidia - The -25% correction starts now!✂️Nvidia ( NASDAQ:NVDA ) is about to create a correction:
🔎Analysis summary:
After Nvidia retested major support in mid 2025, we saw another rally of about +125%. But now, Nvidia is rejecting a major resistance trendline and is about to create bearish confirmation. Quite likely that Nvidia will create a major -25% correction in the future.
📝Levels to watch:
$140
SwingTraderPhil
SwingTrading.Simplified. | Investing.Simplified. | #LONGTERMVISION

Nvidia: Downward PressureSince the end of last week, Nvidia has been facing increasing downward pressure. Our primary scenario, however, calls for a recovery and suggests that the stock should complete the green wave closer to but still below the resistance at $212.16. The subsequent wave should then finalize the larger correction of the beige wave IV above the support at $145.50. Afterward, we expect robust gains into our red Target Zone between $227.38 and $260.60, where the major uptrend of the lime-green wave is likely to conclude. Nonetheless, there's a 33% chance that NVDA already completed wave alt. at $212.16. In this case, the next move would dip below the $145.50 support.

Nvidia Falls again to $180After two consecutive bearish sessions, Nvidia shares have lost more than 4% of their value in the short term. So far, selling pressure has remained consistent, amid rising political tensions between the United States and Europe, which could negatively affect Nvidia’s global supply chains. Given the company’s strong international presence, a potential fragmentation in relations with Europe could reduce expectations for solid demand outside the U.S. market. This scenario appears to have weighed on near-term growth expectations for the company. If this risk-sensitive environment persists, selling pressure on Nvidia’s price could become more relevant over the coming sessions.
A potential bearish trend begins to emerge:
Price action over recent months has started to show a series of lower highs, giving rise to a potentially more consistent bearish trendline. This structure could gain relevance in medium- to long-term price action, as long as selling pressure remains in place.
RSI:
The RSI has begun to trend lower and has already moved below the neutral 50 level, signaling that bearish momentum is starting to dominate the average price action over the last 14 sessions. As long as the RSI continues to weaken, the bearish bias may remain in place in the short term.
MACD:
A similar picture is emerging in the MACD, as the histogram remains below the neutral zero line. This indicates that short-term moving averages continue to reflect selling pressure, suggesting that bearish momentum could extend in the coming sessions.
Key levels to watch:
$192 – Key resistance:
This area aligns with the recent highs and the potential bearish trendline. Buying moves that manage to reclaim this level could invalidate the bearish setup and revive a short-term bullish bias.
$184 – Nearby barrier:
A level aligned with the 50-period simple moving average. Prolonged price action around this zone could generate a phase of indecision, potentially leading to a short-term sideways range.
$170 – Key support:
A psychological level that coincides with the December 2025 lows. A sustained break below this area could confirm the development of a more solid bearish trend, potentially dominating Nvidia’s price action in the medium term.
Written by Julian Pineda, CFA, CMT – Market Analyst

NVDA: Corrective Structure Toward 207 GapFrom an Elliott Wave perspective, NVDA appears to be developing a corrective sequence.
The decline from the recent all-time high to the 169.50 area unfolded as a three-wave ABC correction. Notably, this move lacked impulsive characteristics, as neither wave A nor wave C subdivided into a five-wave structure. This strongly supports the interpretation of the decline as corrective rather than impulsive.
Based on this structure, price may now form another corrective three-wave move to the upside. This potential advance is highlighted on the chart with a purple arrow, projecting toward the 207 area, where a previously unfilled gap remains. The gap is considered additional confluence, not the primary driver of the setup.
Once this corrective move completes, I will be watching for renewed downside development. From that point, two alternative scenarios are possible, both outlined on the chart using the green and orange arrows.
This analysis is focused on wave structure and corrective sequencing, rather than trend continuation or directional bias.
