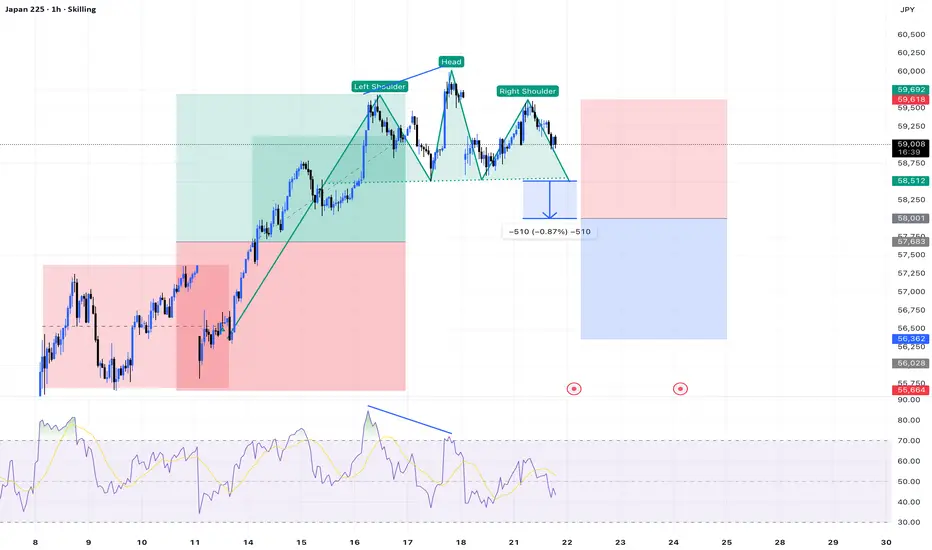
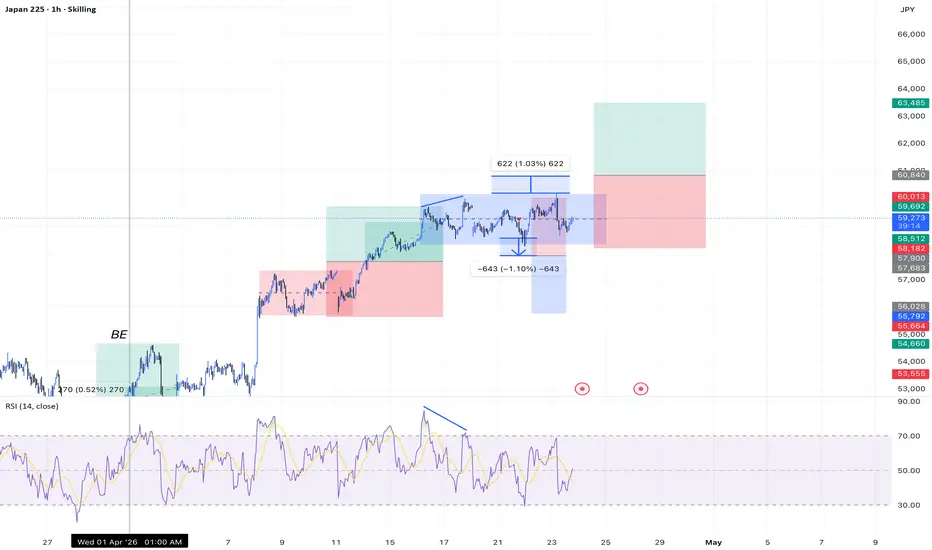
Head and Shoulders with RSI DivergenceThe price has formed a classic Head and Shoulders reversal pattern. This bearish setup is further confirmed by a clear RSI Divergence, indicating that the upward momentum has exhausted.
Pattern: Head and Shoulders
Confirmation: Bearish RSI Divergence
Execution: Entry on Neckline Break / Retest
R
Japan 225 Index
No trades
About Japan 225 Index
The Japan 225 is a popular financial derivative based on the leading and most-respected Japanese stocks. This price-weighted index, valued in yen, has been calculated daily by the Nihon Keizai Shimbun (Nikkei) newspaper since the Index's inception in 1950. It comprises Japan's top 225 blue-chip companies traded on the Tokyo Stock Exchange.
Related indices
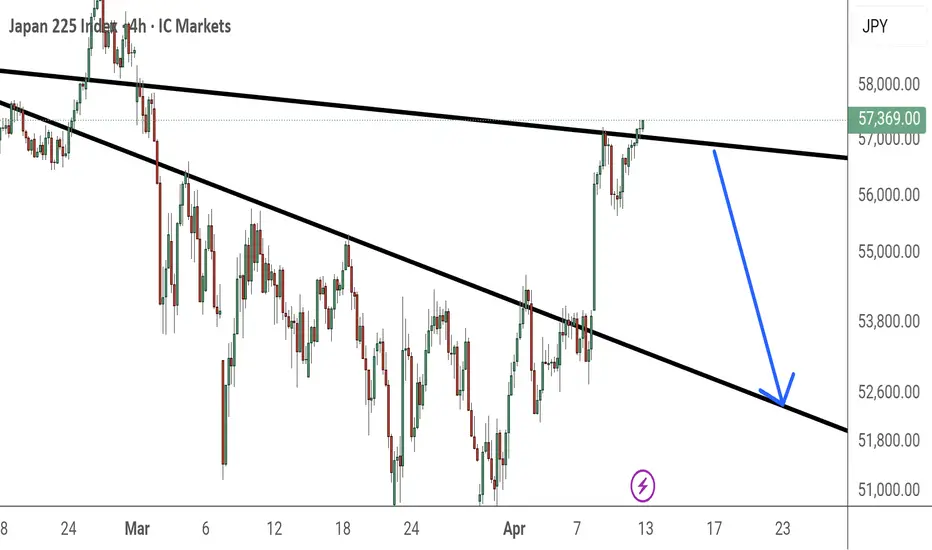
JPN225 Short• Head and Shoulders on H4
A clear head and shoulders structure is forming on the H4 timeframe, which is often a strong sign of exhaustion and a possible reversal after an extended move higher.
• Head and Shoulders Confluence on H1
This same bearish structure is also showing on H1, which adds furth
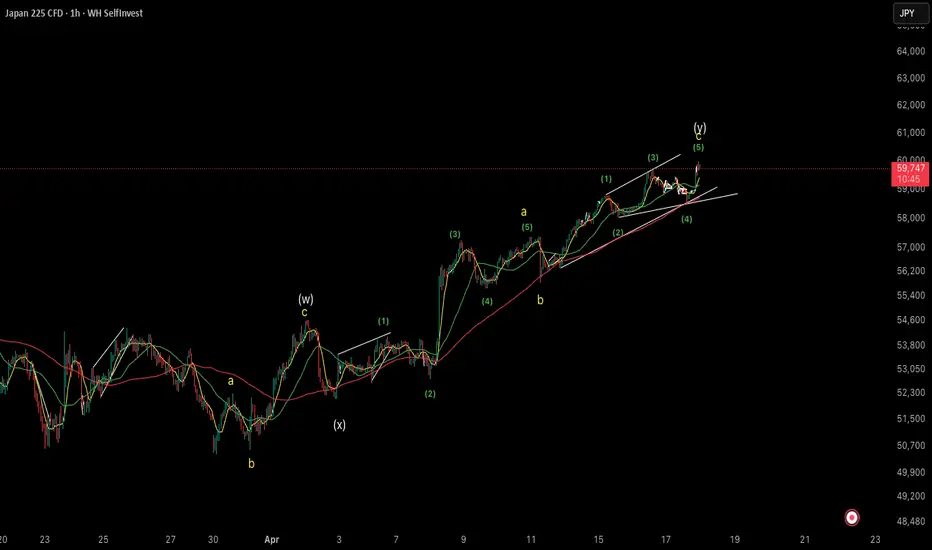
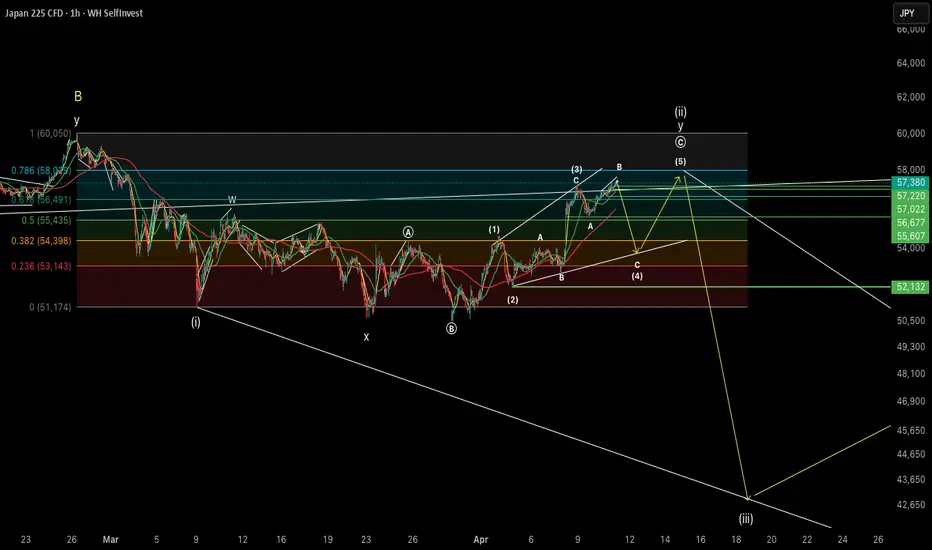
Nikkei 225: Double Zigzag from 3/30 (y)c Expanding Diagonal (5)Nikkei 225
Double Zigzag (w)-(x)-(y) in progress from the 3/30 low!
(y)c is an expanding diagonal currently in Wave (5)
We are now inside (y)c expanding diagonal Wave (5).
Today’s intraday dip was Wave (4), which touched the Wave (1) low.
Because this is an expanding diagonal, it needed to tag th
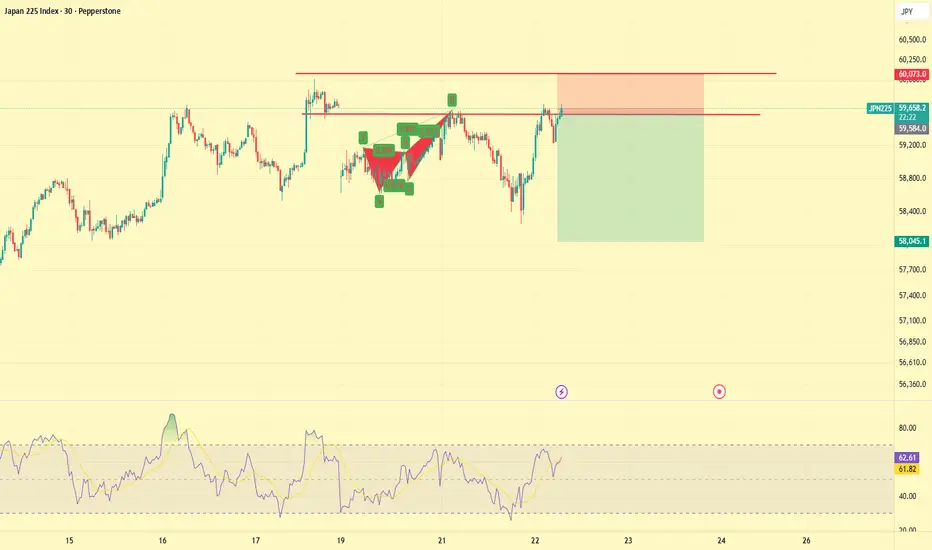
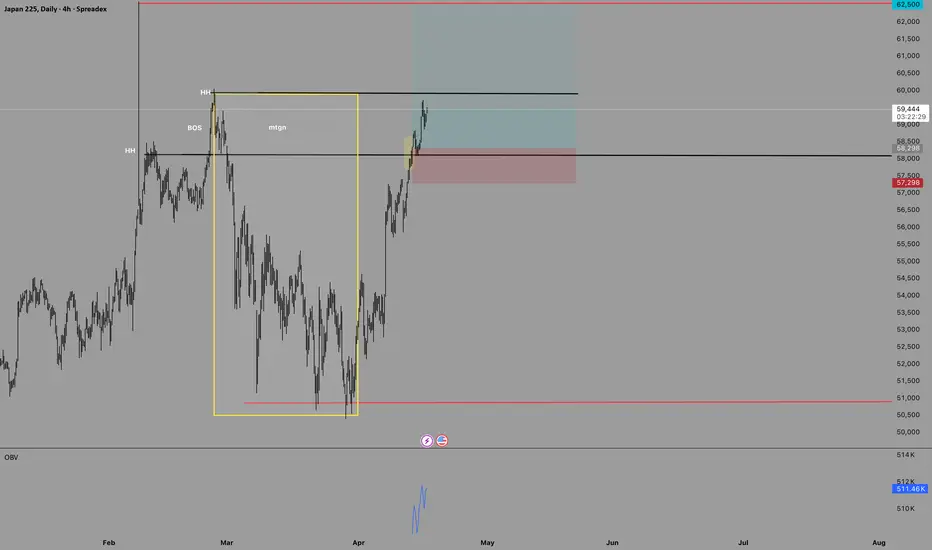
JAP225The price is currently forming a Rectangle Pattern. I am waiting for a clean Breakout of this range to enter the trade.
Trade Trigger: Breakout of the Rectangle
Risk Management: 0.75%
Risk/Reward (RR): 1:1
NIKKEI 225 LONG SPREADEX:NIKKEI
Decades of deflation during Japans's lost years were challenged deeply by a series of external economic shocks to the Japanese economy.
As best as monetary and fiscal policy can try to control the every day lives of a population, what a central bank or a government cannot do is to
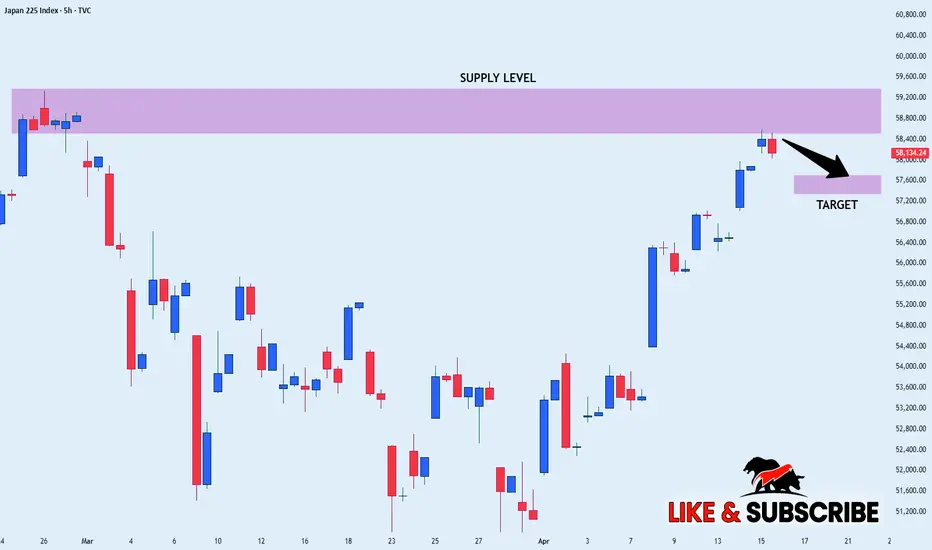
NIKKEI SHORT FROM SUPPLY LEVEL|
✅JP225 trades into a higher timeframe supply zone after a strong bullish expansion, approaching liquidity resting above recent highs. Reaction from this premium area is likely, favoring a bearish move toward lower inefficiencies. Time Frame 5H.
SHORT🔥
✅Like and subscribe to never miss a new ide
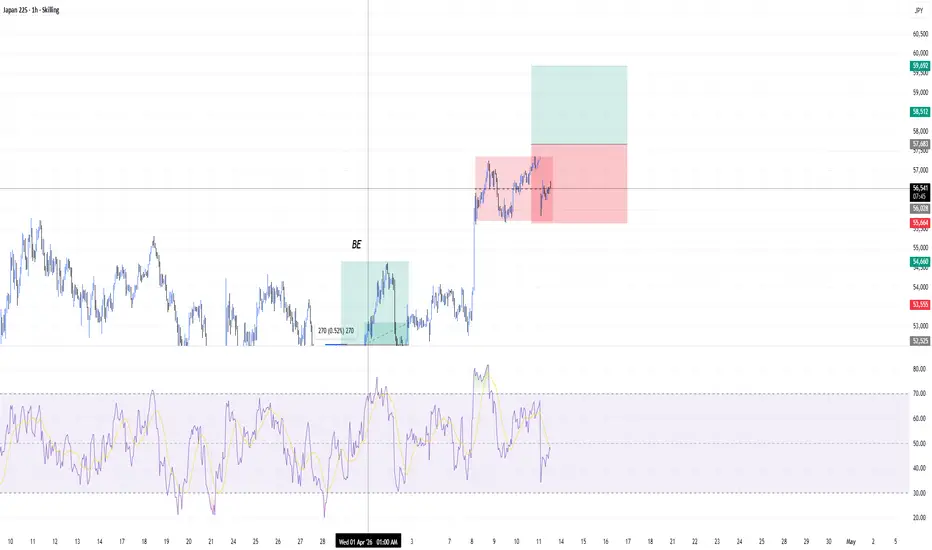
Rectangle Pattern SetupThe price is currently consolidating within a Rectangle Pattern. This sideways movement shows a balance between buyers and sellers, and I am waiting for a definitive Breakout to determine the next trend direction.
Trade Trigger: Breakout of the Rectangle boundary
Risk Management: 0.75% per trade
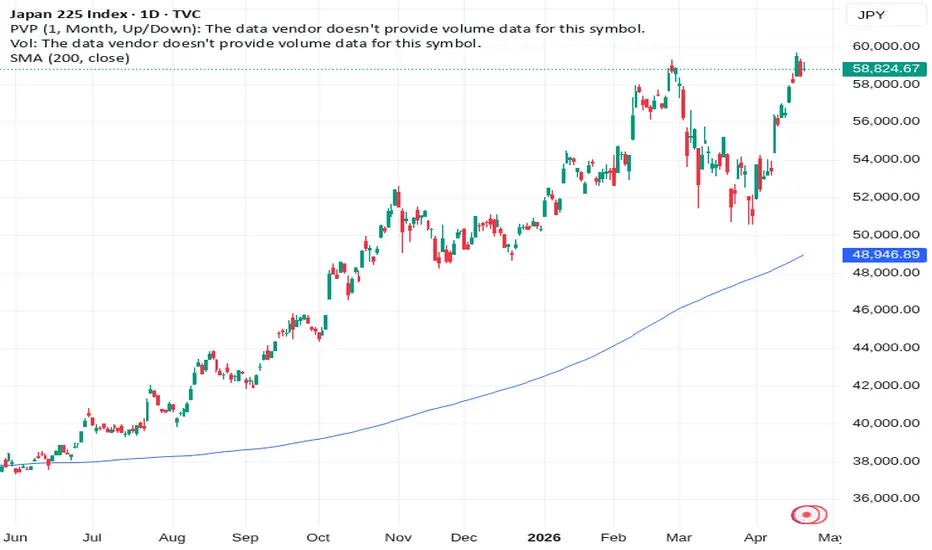
Nikkei 225 Holding Key Support – Setup for 59K Break:Current Price: 58475.9
Direction: LONG
Confidence level: 61%(Technical structure shows price holding above 20, 50, and 200 day averages with bullish momentum indicators and strong support at 58200. Lack of direct trader snippets lowers confidence slightly.)
Targets
Target 1: 59200
Target 2: 6050
Nikkei 225 1H: Ending Diagonal in Wave 4 (Short Setup)Nikkei 225 1-Hour Chart
Current structure: The final leg of the larger Wave 2 decline (Double Three w-x-y flat correction), where an Ending Diagonal is forming in Wave 4.
With the US-Iran ceasefire talks stalling, I expect next week’s decline to remain inside Wave 4. After that, a Wave 5 rally sho
JP225 is telling war in Hormuz Strait could be reigniting Just war in Persan Gulf and Hormuz Strait could cause massive crash for stock market and situation is horrifying as negotiations of Iran US could fail any moment
See all ideas
Summarizing what the indicators are suggesting.
Oscillators
Neutral
SellBuy
Strong sellStrong buy
Strong sellSellNeutralBuyStrong buy
Oscillators
Neutral
SellBuy
Strong sellStrong buy
Strong sellSellNeutralBuyStrong buy
Summary
Neutral
SellBuy
Strong sellStrong buy
Strong sellSellNeutralBuyStrong buy
Summary
Neutral
SellBuy
Strong sellStrong buy
Strong sellSellNeutralBuyStrong buy
Summary
Neutral
SellBuy
Strong sellStrong buy
Strong sellSellNeutralBuyStrong buy
Moving Averages
Neutral
SellBuy
Strong sellStrong buy
Strong sellSellNeutralBuyStrong buy
Moving Averages
Neutral
SellBuy
Strong sellStrong buy
Strong sellSellNeutralBuyStrong buy
Displays a symbol's value movements over previous years to identify recurring trends.
Frequently asked questions
The current value of Japan 225 Index is 60,537.14 JPY — it has risen by 1.63% in the past 24 hours. Track the index more closely on the Japan 225 Index chart.
Japan 225 Index reached its highest quote on Apr 23, 2026 — 60,013.98 JPY. See more data on the Japan 225 Index chart.
The lowest ever quote of Japan 225 Index is 85.25 JPY. It was reached on Jul 6, 1950. See more data on the Japan 225 Index chart.
Japan 225 Index value has increased by 3.18% in the past week, since last month it has shown a 14.00% increase, and over the year it's increased by 71.07%. Keep track of all changes on the Japan 225 Index chart.
The champion of Japan 225 Index is TSE:5706 — it's gained 921.58% over the year.
The weakest component of Japan 225 Index is TSE:3697 — it's lost −47.05% over the year.
Japan 225 Index is just a number that lets you track performance of the instruments comprising the index, so you can't invest in it directly. But you can buy Japan 225 Index futures or funds or invest in its components.
The Japan 225 Index is comprised of 223 instruments including TSE:7203, TSE:9984, TSE:8306 and others. See the full list of Japan 225 Index components to find more opportunities.