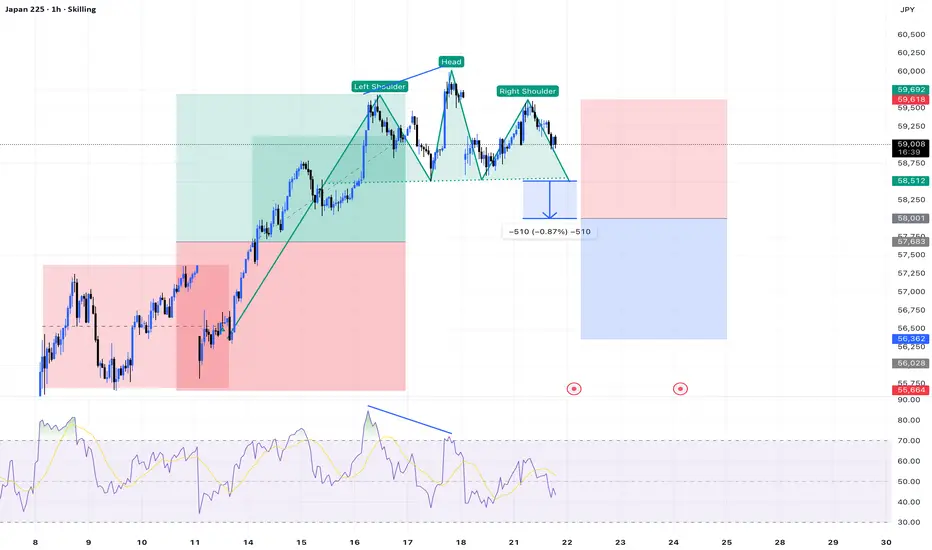
Head and Shoulders with RSI DivergenceThe price has formed a classic Head and Shoulders reversal pattern. This bearish setup is further confirmed by a clear RSI Divergence, indicating that the upward momentum has exhausted.
Pattern: Head and Shoulders
Confirmation: Bearish RSI Divergence
Execution: Entry on Neckline Break / Retest
Risk Management: 0.75%
Risk/Reward (RR): 1:1
Japan 225 Index
No trades
In-depth trading ideas
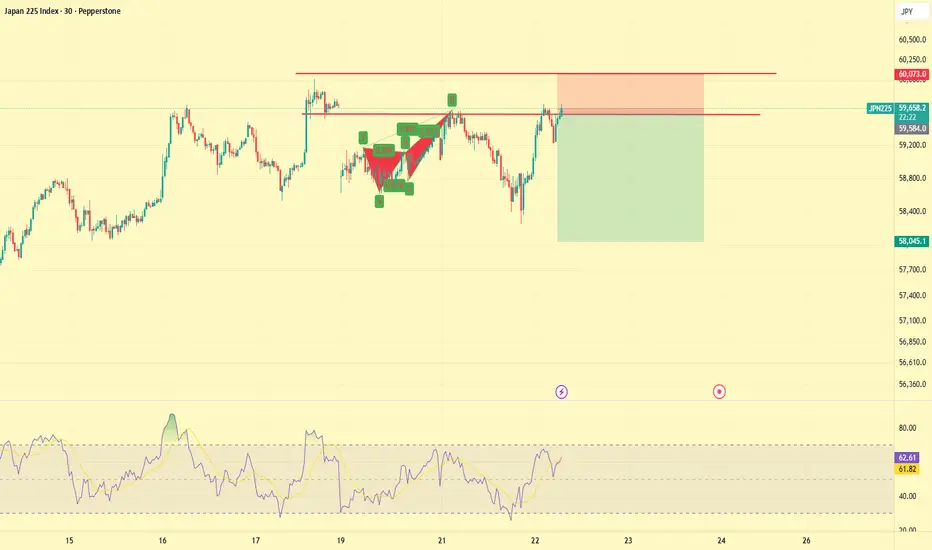
JPN225 Short• Head and Shoulders on H4
A clear head and shoulders structure is forming on the H4 timeframe, which is often a strong sign of exhaustion and a possible reversal after an extended move higher.
• Head and Shoulders Confluence on H1
This same bearish structure is also showing on H1, which adds further confirmation to the idea that the price may be losing strength and preparing for a downside move.
• Overbought Conditions on H1, M30, and M15
Momentum is stretched across the lower timeframes, with H1, M30, and M15 all showing overbought conditions. When several timeframes are extended at the same time, the chance of a pullback or reversal increases.
• Deep Crab Pattern on M30
There is also a Deep Crab harmonic pattern on M30. As a Type 2 pattern, this points to a potential reversal zone and adds another layer of confluence around the current price area.
• Trend Momentum Is Flattening
Although this trade is against the broader trend, the H1 trend has caught up and flattened out, showing that bullish momentum is no longer as strong as before. The H4 trend is also beginning to lose strength, which suggests the market may be shifting from trend continuation into distribution or reversal.
• Failure to Break Higher
Price is struggling to break and hold above this level. Repeated failure to continue higher often shows that buyers are losing control, especially when this happens near a major psychological level.
• Major Resistance Near 60000
This setup is happening just below the 60000 area, which is a major psychological level and effectively the all-time high zone. Markets often react strongly around these levels, and if the price cannot break through decisively, rejection becomes more likely.
• Exhaustion at a Premium Price Area
After such a strong move upward, the price is now trading in a premium area where chasing longs becomes less attractive. In these conditions, reversal setups tend to carry more weight when combined with structure and momentum weakness.
• Volatility-Driven Opportunity
This may initially develop as a short-term trade because of the increased volatility in the market following recent ceasefire-related news. However, if the price starts breaking lower with momentum, this could develop into a much larger reversal instead of only a short-term pullback.
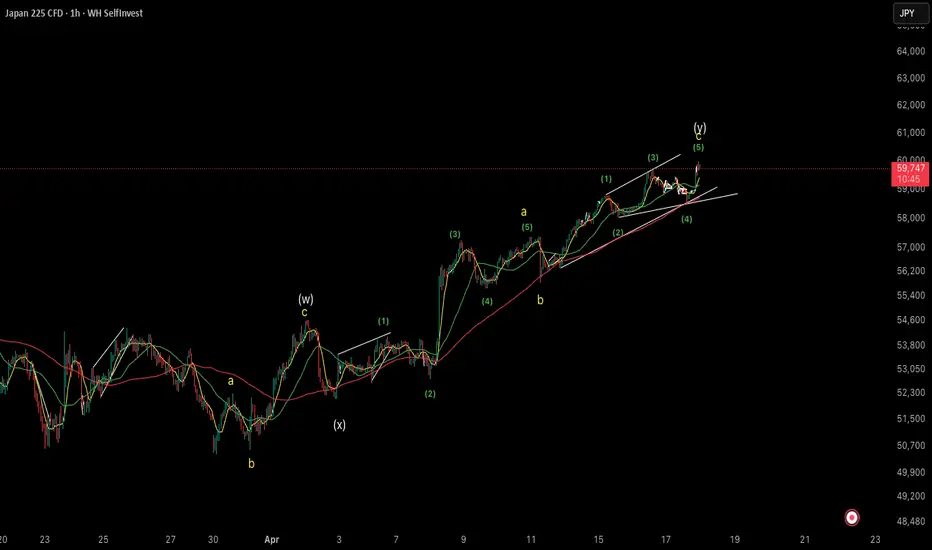
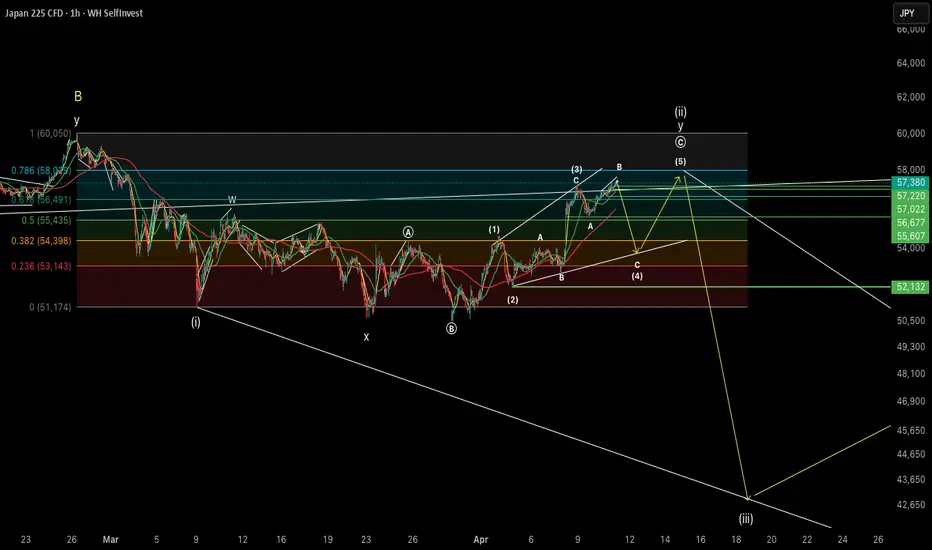
Nikkei 225: Double Zigzag from 3/30 (y)c Expanding Diagonal (5)Nikkei 225
Double Zigzag (w)-(x)-(y) in progress from the 3/30 low!
(y)c is an expanding diagonal currently in Wave (5)
We are now inside (y)c expanding diagonal Wave (5).
Today’s intraday dip was Wave (4), which touched the Wave (1) low.
Because this is an expanding diagonal, it needed to tag the end of Wave (3).
Tonight’s rally has cleanly done exactly that, completing the structure.
Once this Double Zigzag (w)-(x)-(y) finishes, the next key question is:
1. Will it turn into a simple corrective decline?
2. Or will it develop into a Triple Zigzag decline?
This is the major focus point going forward.
(1H chart – real-time update)
#Nikkei225 #ElliottWave #DoubleZigzag #WaveAnalysis
JAP225The price is currently forming a Rectangle Pattern. I am waiting for a clean Breakout of this range to enter the trade.
Trade Trigger: Breakout of the Rectangle
Risk Management: 0.75%
Risk/Reward (RR): 1:1
NIKKEI 225 LONG SPREADEX:NIKKEI
Decades of deflation during Japans's lost years were challenged deeply by a series of external economic shocks to the Japanese economy.
As best as monetary and fiscal policy can try to control the every day lives of a population, what a central bank or a government cannot do is to wrap themselves in cotton wool when we live in uncertain times. Covid. The Ukraine war. The trip tariffs and now the Iranian conflict has put Japan in a dilemma whereby inflation is creeping back into the economy and as a result, domestic businesses and investors are becoming increasingly incentivised to exit their carry trade positions overseas and invest into domestic equities.
As bond yields rise to decade long highs, the yen is devalued even further and thus if you take intro perspective the costs that larger Japanese investors absorb with the higher bond yields and the fx hedge costs, a Japanese investor today is clearly looking to sell their holdings overseas and invest into the Nikkei.
With a new political regime that has announced a generational fiscal stimulus package in order to support gdp and tackle Japans debt to income ratio, money shall surely move into the Japanese equity market.
The carry trade may be over. However, the fx carry trade is not.
All of this comes at a price and the road that the current prime minister has taken is one that sacrifices its currency in order to control inflation and support economic growth.
Yen devaluation shall continue for now.
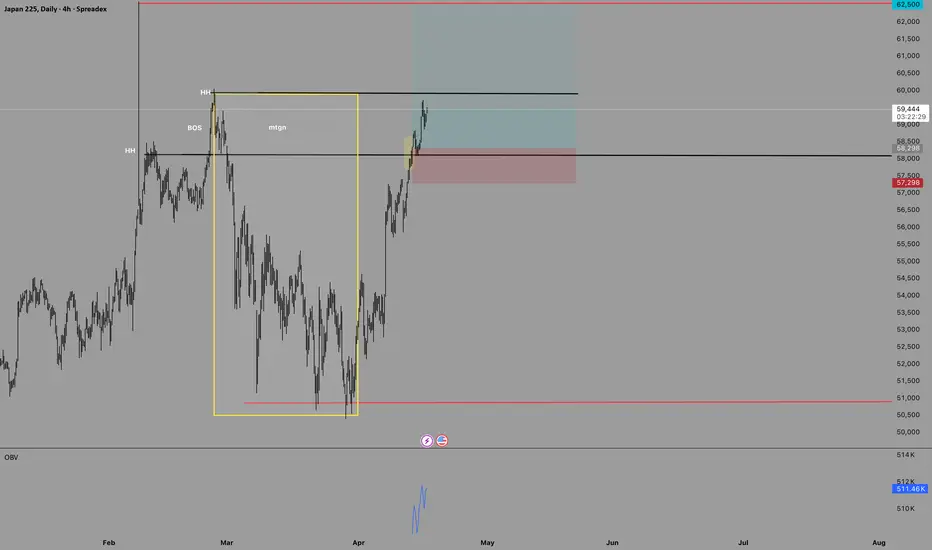
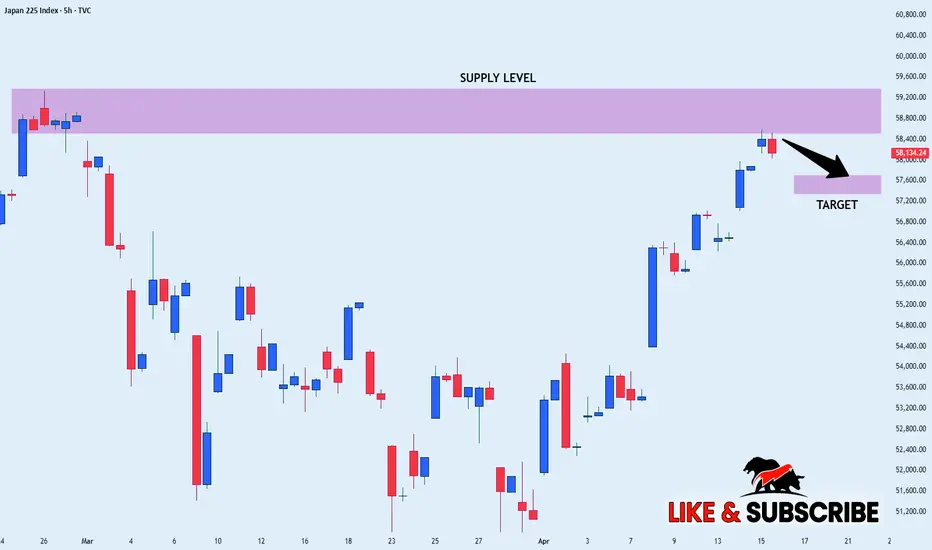
NIKKEI SHORT FROM SUPPLY LEVEL|
✅JP225 trades into a higher timeframe supply zone after a strong bullish expansion, approaching liquidity resting above recent highs. Reaction from this premium area is likely, favoring a bearish move toward lower inefficiencies. Time Frame 5H.
SHORT🔥
✅Like and subscribe to never miss a new idea!✅
Rectangle Pattern SetupThe price is currently consolidating within a Rectangle Pattern. This sideways movement shows a balance between buyers and sellers, and I am waiting for a definitive Breakout to determine the next trend direction.
Trade Trigger: Breakout of the Rectangle boundary
Risk Management: 0.75% per trade
Risk/Reward (RR): 1:1
Nikkei 225 Holding Key Support – Setup for 59K Break:Current Price: 58475.9
Direction: LONG
Confidence level: 61%(Technical structure shows price holding above 20, 50, and 200 day averages with bullish momentum indicators and strong support at 58200. Lack of direct trader snippets lowers confidence slightly.)
Targets
Target 1: 59200
Target 2: 60500
Stop Levels
Stop 1: 58200
Stop 2: 57800
Wisdom of Professional Traders:
This analysis synthesizes insights from thousands of professional traders and market experts, combining what traders are saying with real‑time macro developments to identify good setups. When several professional traders focus on the same support zones and momentum indicators, it often highlights where institutions are positioning in the Nikkei 225.
Key Insights:
Here’s what’s driving this setup. The Nikkei 225 is still trading above its 20‑day, 50‑day, and 200‑day moving averages. That’s an important signal because it means the broader trend remains upward even after the recent pullback. Traders usually treat pullbacks into the 20‑day average as buy‑the‑dip opportunities when the larger trend stays intact.
Another thing worth watching is the 58,200 zone. Several technical analyses highlight this level as a major support area tied to both previous lows and the 20‑day SMA. As long as the index stays above that area, momentum traders will likely keep targeting the psychological 59,000 region and potentially higher.
Momentum indicators also lean bullish. RSI around the low‑60s suggests strength without extreme overheating, while MACD still shows positive momentum. When these indicators align with a rising channel pattern, traders often look for continuation rather than breakdown.
Recent Performance:
The Nikkei 225 recently traded around 58,475 after pulling back roughly 1.7% from the session high near 59,300. Despite that drop, the index remains close to record territory and comfortably above long‑term trend levels. Over the last several weeks the index has been climbing within an ascending channel between roughly 57,800 and 59,200, which supports the idea of another attempt at resistance.
Expert Analysis:
Several professional traders are focusing on the same technical structure: an ascending channel with resistance around 59,000–59,500. When I look at this setup, the key takeaway is that the market hasn't broken trend support despite volatility from global macro headlines.
Multiple traders also pointed out that a clean break above the 59,000 zone could trigger momentum buying. That’s because psychological round numbers tend to attract algorithmic flows and breakout traders. If that level breaks, the next magnet quickly becomes the 60,000 area, which is why the second target is set slightly above that zone.
At the same time, traders are watching the 58,200 level carefully. If the index drops below it, short‑term momentum could flip quickly, which is why the stop structure sits just under that support band.
News Impact:
Geopolitical headlines and oil prices remain the biggest external drivers. Markets have been reacting to developments in US‑Iran negotiations and Middle East tensions. When risk sentiment improves, Japanese equities tend to rally quickly, especially export‑heavy components. On the other hand, spikes in oil prices can pressure the index because higher energy costs weigh on Japanese corporate margins.
Corporate earnings from large Japanese technology and retail companies are also providing underlying support, which helps explain why dips are getting bought quickly.
Trading Recommendation:
Putting it all together, this looks like a buy‑the‑dip setup while the index holds above 58,200. I’m taking a LONG position targeting 59,200 first and 60,500 if momentum kicks in this week. The trade thesis breaks if price loses the 58,200 support, so stops sit below that level to protect downside.
If the index pushes through 59,000 with strong volume, momentum traders could accelerate the move toward 60K quickly. That’s the scenario I’m positioning for this week.
Nikkei 225 1H: Ending Diagonal in Wave 4 (Short Setup)Nikkei 225 1-Hour Chart
Current structure: The final leg of the larger Wave 2 decline (Double Three w-x-y flat correction), where an Ending Diagonal is forming in Wave 4.
With the US-Iran ceasefire talks stalling, I expect next week’s decline to remain inside Wave 4. After that, a Wave 5 rally should complete the diagonal.
For the diagonal to be valid, a touch of 54,180 is required.
Short target: 54,180–53,800 zone.
Once the diagonal completes, expect a retest of the 54,248 high, followed by the start of the major Wave (iii) decline.
Significant volatility is likely next week — fast reactions will be key.
【Target】
54,180–53,800 area (Short)
【Invalidation】
① Strong break above 58,024 → Count change (bullish continuation)
② Strong break below 52,132 → Count change (accelerated decline)
#Nikkei225 #ElliottWave
JP225 is telling war in Hormuz Strait could be reigniting Just war in Persan Gulf and Hormuz Strait could cause massive crash for stock market and situation is horrifying as negotiations of Iran US could fail any moment
Nikkei 225 4H: Bearish Double Three Wave 2 in ProgressNikkei 225 4H Chart
After the downward impulse Wave 1 that started from the Feb 26 high,
Wave 2 = Double Three (Zigzag + Flat) is currently in progress.
We are now inside the Y wave of the Double Three = Flat (C).
Ending Diagonal
Wave 3 completed → Wave 4 in progress
Wave 4 target: around 52,800
(Expecting a rebound here unless it breaks clearly below 52,132)
Once the Wave 4 low is confirmed → Wave 5 up to complete (C) → entire Wave 2 completed
Thereafter, the main Wave (iii) decline begins.
Bias & Position
Bearish
Target (Wave 4): around 52,800
(Will confirm (C) completion with the subsequent Wave 5 rally)
Invalidation: Clear break below 52,132
→ Count change#Nikkei225 #ElliottWave

Nikkei 225 Short Update: Break of TrendlineOver in this video, I updated Nikkei wave counts and also talk about the targets for this down move.
Take note of the stop loss at 53,586 which is above the trendline.
Good luck!

JP225 CFD Price Action Favors the Bulls🎯 JP225 (JAPAN 225 Index CFD) | Bullish Momentum Play | Day/Swing Trade Setup 📈
🔥 TRADE OVERVIEW
Asset: JP225 (Japan 225 Index CFD - Nikkei 225)
Bias: 🟢 BULLISH (Confirmed via SMA Pullback Strategy)
Trade Type: Day Trade / Swing Trade
Risk Level: ⚠️ Medium-High (Manage Your Position Sizing!)
📊 TECHNICAL SETUP
✅ Entry Strategy:
FLEXIBLE ENTRY - You can enter at ANY CURRENT PRICE LEVEL as momentum confirms bullish structure
Simple Moving Average (SMA) pullback confirmed ✔️
Price action showing accumulation phase before continuation
🎯 Take Profit Target:
TP: 56,000 🎯
⚠️ Key Resistance Zone Alert! - Police force level acting as:
Strong historical resistance
Overbought territory on oscillators
Potential bull trap zone (correlation factors present)
RECOMMENDED: Secure profits near this level! Don't get greedy 💰
🛑 Stop Loss:
SL: 52,400 🚨
This is the "Thief OG's Stop" - invalidation level for bullish structure
⚡ IMPORTANT DISCLAIMER:
Dear Ladies & Gentlemen (Thief OG's) 👋
These TP/SL levels are REFERENCE POINTS ONLY. This is NOT financial advice! Trade at your own risk, manage your own capital, and adapt levels to YOUR risk tolerance. If you're in profit - TAKE IT! Don't let winners turn into losers! 🎲
🌐 CORRELATED PAIRS TO WATCH
💵 USD/JPY (Dollar-Yen):
Strong inverse correlation with JP225
If USD/JPY weakens → JPY strengthens → Can pressure JP225 (export-heavy index)
Current JPY strength could create headwinds ⚠️
💴 EUR/JPY & GBP/JPY:
Cross-yen pairs show risk sentiment
Rising = Risk-ON (bullish for JP225) ✅
Falling = Risk-OFF (bearish pressure) ❌
📉 US Indices (SPX500, NAS100, US30):
Positive correlation - Global risk appetite flows together
Watch overnight US session for Asia open direction 🌏
🏦 Japanese Bank Stocks (8306.T Mitsubishi UFJ, 8316.T Sumitomo Mitsui):
Banking sector health = Nikkei health
Monitor for sector rotation signals 🔄
📰 FUNDAMENTAL & ECONOMIC FACTORS
🇯🇵 Japan-Specific Catalysts:
✅ BULLISH DRIVERS:
Weak Yen Policy - BOJ maintaining ultra-loose monetary policy (supports export competitiveness)
Corporate Earnings Season - Watch for Q4 2024/Q1 2025 results from Toyota, Sony, SoftBank
Tourism Recovery - Continued post-pandemic inbound tourism boom 🛫
Warren Buffett's Japan Bets - Continued confidence in Japanese trading houses
⚠️ BEARISH RISKS:
BOJ Policy Shift Speculation - Any hawkish surprise could strengthen JPY and hurt exporters
Global Recession Fears - Japan's export-driven economy vulnerable to global slowdown
China Economic Weakness - Major trading partner struggles = Nikkei pressure
Energy Prices - Japan imports 90%+ of energy; rising oil/gas = margin compression
📅 KEY UPCOMING EVENTS TO WATCH:
🔔 High Impact News:
Bank of Japan (BOJ) Meeting - Watch for rate decision & forward guidance
Japan CPI (Inflation Data) - Higher inflation = potential BOJ policy shift pressure
US Federal Reserve Decisions - Affects global risk sentiment & USD/JPY
Japan GDP Reports - Economic growth trajectory
Tokyo Core CPI - Leading indicator for national inflation
Manufacturing PMI - Export sector health check
🌍 Global Market Drivers:
US-China Trade Relations - Affects regional stability
Semiconductor Sector News - Tokyo Electron, Advantest are index heavyweights
Oil Prices (WTI/Brent) - Input cost for Japanese manufacturers
🧠 TECHNICAL + FUNDAMENTAL SYNERGY:
Why This Setup Works:
✅ Technical pullback to SMA = clean entry structure
✅ Bullish momentum confirmed = trend alignment
✅ Weak JPY environment = fundamental tailwind for exporters
✅ Global risk-on sentiment = correlated strength in equities
What Could Go Wrong:
❌ Sudden BOJ hawkish pivot = JPY strength kills rally
❌ US market crash = contagion to Asian indices
❌ China data disappointment = export demand concerns
❌ Geopolitical escalation (Taiwan, North Korea) = safe-haven flows OUT of equities
🎓 TRADE MANAGEMENT TIPS:
💎 For Thief OG's (Smart Traders):
Scale In/Out - Don't go all-in at once! Build position on confirmations
Trail Your Stop - Lock in profits as price moves toward 56K
Watch Volume - Decreasing volume near resistance = trap warning 🪤
Time Your Exits - Asia session often sees momentum; consider US session volatility
Correlation Check - If USD/JPY spikes, reassess your JP225 long! 🔍
🚀 FINAL WORD:
This is a technically sound bullish setup with fundamental support from BOJ policy and export dynamics. BUT - trading is probability, not certainty! The 56K resistance is REAL, and correlation risks from FX pairs are REAL.
Manage risk. Respect the market. Take profits when they're there. 💰
📢 If you found this analysis helpful, smash that 👍 LIKE button and 💬 COMMENT your thoughts below! Let's build this trading community together! 🤝
Follow for more setups, and remember: The market doesn't care about your feelings - only your discipline! 🎯
#JP225 #Nikkei225 #JapanIndex #TradingIdeas #DayTrading #SwingTrading #TechnicalAnalysis #ForexCorrelation #USDJPY #BankOfJapan #IndexTrading #ThiefOGs #TradeSmart 🇯🇵📈💹

JP225 Bullish Continuation | Liquidity + Macro Tailwinds📊 JP225 (Japan 225 Index CFD) – Trade Opportunity Guide
Timeframe: Day Trade / Swing Trade
Market: Indices (CFD)
🧠 Market Bias
📈 Bullish Plan Active
The Japan 225 Index continues to benefit from macro support, capital inflows, and currency tailwinds, keeping upside momentum intact.
🎯 Entry Strategy
💡 Flexible Entry Approach
You may enter at any favorable price level based on your execution style.
However, Thief Trader methodology prefers layered limit entries to optimize risk and positioning:
🧱 Limit Entry Zones
53,000
53,300
53,600
53,900
📌 Layering allows participation without emotional chasing and improves average entry price.
🟢 Target Zone
🎯 Primary Target: 55,000
Why this zone matters:
Overbought conditions expected near highs
Strong institutional profit-booking zone
Psychological round-number resistance
Correlation-based exhaustion signals
⚠️ Reminder:
Dear Ladies & Gentlemen (OG Traders), this target is not a fixed rule.
Secure profits based on your own risk management and market conditions.
🔴 Stop Loss
🛑 Protective Stop: 52,700
⚠️ This is a reference risk level, not a mandatory stop.
Capital protection is your responsibility — manage risk like a professional.
🔗 Related Markets to Watch (Correlation Focus)
💱 USD/JPY
Weak JPY = Strong JP225
Yen depreciation boosts Japanese exporters and equity valuations
📈 US30 (Dow Jones Index)
Risk-on sentiment in US equities often fuels upside momentum in JP225
📊 SPX500
Global equity sentiment confirmation
Strong US indices support Asian index continuation
💵 DXY (US Dollar Index)
Rising DXY → pressure on JPY → bullish for Japan 225
🌍 Fundamental & Economic Factors (Trade Drivers)
📌 Key Supporting Factors
Continued loose monetary stance from Bank of Japan
Strong foreign institutional inflows into Japanese equities
Yen weakness enhancing exporter earnings
Stable inflation expectations relative to global peers
📅 Upcoming Factors to Monitor
Bank of Japan policy statements & outlook
Japan CPI & wage growth data
Global risk sentiment from US macro releases
US bond yields impacting JPY direction
💡 As long as JPY remains weak and global risk appetite stays positive, JP225 remains structurally supported.
🌐 THE MACRO DOJO (Fundamental Factors) 🏯
✅ BULLISH WINDS 🍃:
🇯🇵 "Takaichi-nomics": PM Takaichi is full-throttle on weak Yen policy & delaying rate hikes—rocket fuel for export-heavy Nikkei.
🏛️ Corporate Revolution: Tokyo Stock Exchange forcing better shareholder returns (buybacks & dividends)—global money is flowing in.
💰 Valuation Gap: Nikkei still trades at a ~21% DISCOUNT to S&P 500. The re-rating story is intact.
❌ BEARISH THREATS ⚠️:
**💴 **The Yen is the Nemesis****: A sharp, intervention-driven Yen surge can tank the index. Watch USD/JPY like a hawk! 🦅
🌍 Global Risk-Off: If U.S. tech (Nasdaq) sneezes, Nikkei can catch a cold. Monitor NQ100 Futures.
🕶️ Thief Trader Mindset
“Markets don’t reward emotions — they reward patience.”
“Layer smart, risk less, let price come to you.”
“Consistency beats aggression, every single time.”
🔥 Trade calm. Trade clean. Trade like a professional.

Nikkei225 Count Update: Expanding Triangle in FocusNikkei225 Count Update
No change to the double three count from the 3/9 low.
However, while I had been viewing the move from the 3/23 low as a flat formation,
the possibility of a triangle has increased again.
(This would be an expanding triangle.)
Currently, the triangle (C) wave is in progress,
followed by a (D) wave decline targeting 50,400–50,300.
I expect large up-and-down swings to continue for a while.
If price breaks below 53,735 and 53,590,
I will resume short positions.
Until then, I remain on the sidelines with no position.
#Nikkei225 #JAPAN225CFD #ElliottWave

JAPAN as a HERO? UP! GOKU Last Fight! JAPAN is the last one to join the party! The final fight for the #BlowoffTop.
Why is this so important? If you look at correlations with BTC, global liquidity, China, the Fed’s interest rates, and more, Japan plays a key role. After China, Japan is the next to wake up and give the final push to this Bull Market.
The last time the Nikkei dropped more than 25% was during the COVID crash. What happened next? It rallied 26% in the first 52 days and extended its Bull Market to over 88% from the bottom.
With the current Carry Trade crisis (still unresolved), the TVC:NI225 has dropped more than 25% again, and guess what? It’s up 26% in the first 52 days... History doesn’t repeat, but it often rhymes.
It’s feeling like 2017 all over again... What do you think? 🚀📈

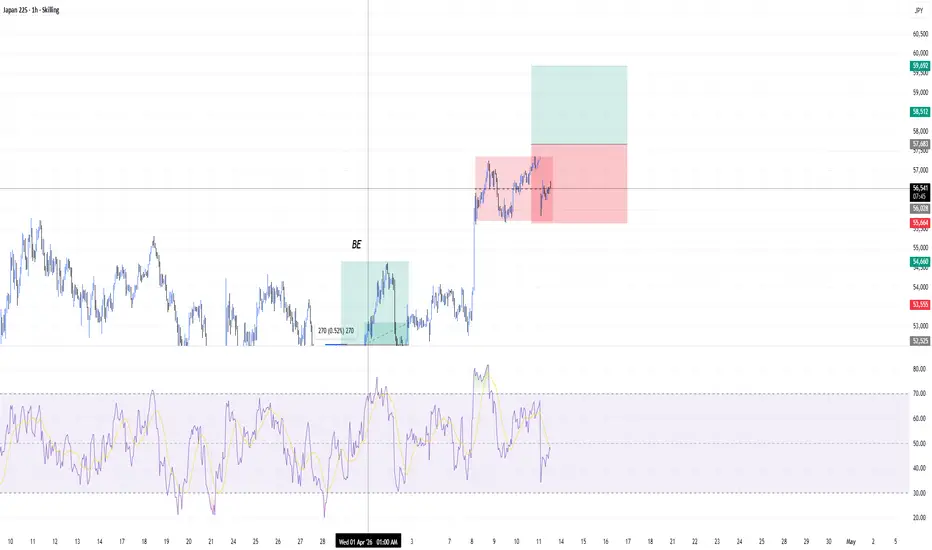
JP225 Market Structure Shift Signals Bullish Continuation🌏🏯 JP225 | JAPAN 225 INDEX CFD — THE THIEF'S BULLISH HEIST PLAN 🐉📈💹
⚔️ Day Trade & Swing Trade | Multi-Timeframe Setup | Tokyo Session Specialist
━━━━━━━━━━━━━━━━━━━━━━━━━━━━━━━━━━━━━━━━
🎯 TRADE OVERVIEW — THE HEIST BRIEF
━━━━━━━━━━━━━━━━━━━━━━━━━━━━━━━━━━━━━━━━
🏛️ Asset : JP225 — Japan 225 Index CFD (Nikkei 225 Proxy)
📍 Exchange : Tokyo Stock Exchange (TSE) | CFD Market
💰 Bias : 🟢 BULLISH | Recovery & Mean-Reversion Play
⏱️ Style : Day Trade / Swing Trade
━━━━━━━━━━━━━━━━━━━━━━━━━━━━━━━━━━━━━━━━
💣 ENTRY ZONE — SNEAK IN LIKE A THIEF
━━━━━━━━━━━━━━━━━━━━━━━━━━━━━━━━━━━━━━━━
🚪 Entry : ANY PRICE LEVEL — Scalp it, Swing it, DCA it!
🎲 Entry Style : Flexible Entry | Any pullback or breakout confirmation
⚡ Pro Tip : Look for bullish engulfing / hammer candles near demand zones
or a breakout above 52,500 for momentum confirmation.
━━━━━━━━━━━━━━━━━━━━━━━━━━━━━━━━━━━━━━━━
🏴☠️ TARGET — WHERE THE THIEF ESCAPES WITH THE LOOT
━━━━━━━━━━━━━━━━━━━━━━━━━━━━━━━━━━━━━━━━
🎯 Primary TP : 56,000 🔐 STRONG HISTORICAL RESISTANCE WALL
🔭 Why 56,000?
✅ Major Price Ceiling — Institutional Supply Zone Active
✅ Overbought Territory Warning (RSI + Stochastic Convergence)
✅ Correlation Alert — USD/JPY & SPX500 showing exhaustion signals
✅ Historical Resistance Cluster — Trap & Reverse Zone for retail traders
✅ Smart Money Exit Zone — Professionals book profits here
⚠️ Dear Ladies & Gentlemen — Thief OG's 🏴☠️:
"I am NOT recommending you to set ONLY my TP as your exit.
You are the BOSS of your own account.
Make your money 💵, then TAKE your money! Exit at your own discretion.
Partial profits at 53,500 → 55,000 → 56,000 is the Thief's Multi-Stage Escape Plan." 😎
━━━━━━━━━━━━━━━━━━━━━━━━━━━━━━━━━━━━━━━━
🛡️ STOP LOSS — THE THIEF'S ESCAPE HATCH
━━━━━━━━━━━━━━━━━━━━━━━━━━━━━━━━━━━━━━━━
🛑 Thief SL : 52,500 🔴 (Below Key Structural Support)
💡 SL Logic : Below this level, the bullish structure is invalidated.
Market likely flips to bearish trend continuation.
⚠️ Dear Ladies & Gentlemen — Thief OG's 🏴☠️:
"I am NOT recommending you to set ONLY my SL.
Use trailing stops, hedge positions, or reduce size.
Your capital — your rules. Protect the vault first. 🏦💎"
━━━━━━━━━━━━━━━━━━━━━━━━━━━━━━━━━━━━━━━━
📊 REAL-TIME MARKET PULSE — LIVE DATA (London Time 🇬🇧)
━━━━━━━━━━━━━━━━━━━━━━━━━━━━━━━━━━━━━━━━
📉 Current Nikkei 225 Price : ~51,063 JPY (as of Tokyo Close, 01 Apr 2026)
📅 March 2026 Performance : Nikkei dropped ~13.23% — Worst month since 2008 GFC
📌 52-Week Range : 30,792 — 60,051 JPY
🏔️ All-Time High (2026) : 60,051 JPY (Feb 25, 2026)
🔻 Current Phase : Corrective / Deep Discount Zone
🟡 Technical Signal : Strong Sell (Short-Term) | Potential Reversal Setup (Medium-Term)
━━━━━━━━━━━━━━━━━━━━━━━━━━━━━━━━━━━━━━━━
🌐 CORRELATED PAIRS TO WATCH 👁️ — THIEF'S INTEL BOARD
━━━━━━━━━━━━━━━━━━━━━━━━━━━━━━━━━━━━━━━━
Monitor these pairs alongside JP225 for confluence signals:
📌 USD/JPY (FX:USDJPY)
🔗 Correlation: POSITIVE (Weak Yen = Nikkei Up | Strong Yen = Nikkei Down)
💡 Watch: USD/JPY above 149–150 supports JP225 bulls via export earnings boost
⚠️ Risk: BOJ rate hike expectations strengthen JPY → headwind for Nikkei
📌 SPX500 / US500 (INDEX:SPX500USD)
🔗 Correlation: POSITIVE (Risk-On flows boost both Wall Street & Nikkei)
💡 Watch: S&P500 recovery above 5,200 signals risk appetite returning globally
⚠️ Risk: S&P500 selloff = JP225 selloff (synchronized risk-off)
📌 US30 / Wall Street (INDEX:US30USD)
🔗 Correlation: MODERATE POSITIVE (Dow Jones sentiment mirrors global indices)
💡 Watch: Dow above 44,000 adds bullish sentiment to JP225
📌 NAS100 (INDEX:NAS100USD)
🔗 Correlation: POSITIVE (Tech stocks dominate both indices — SoftBank, Kioxia, Lasertec)
💡 Watch: Nasdaq recovery drives tech-heavy JP225 components higher
📌 HK33 / Hang Seng (INDEX:HK33HKD)
🔗 Correlation: MODERATE POSITIVE (Asia-Pacific Risk Sentiment)
💡 Watch: Regional risk-on mood in Asia supports JP225
📌 XAUUSD — Gold (FOREXCOM:XAUUSD)
🔗 Correlation: INVERSE in risk-on mode (Gold up = Risk-Off = JP225 pressure)
💡 Watch: Gold pulling back from highs = potential JP225 bounce signal
📍 Gold currently ~$4,590 — elevated, reflecting ongoing geopolitical anxiety
📌 USOIL / WTI Crude (TVC:USOIL)
🔗 Correlation: INVERSE for Japan (Japan imports ~90% of oil — High Oil = Nikkei Pain)
💡 Watch: Any ceasefire/de-escalation in Middle East = Oil down = JP225 relief rally
⚠️ Risk: Iran-Strait of Hormuz escalation = Oil spike = JP225 selloff
━━━━━━━━━━━━━━━━━━━━━━━━━━━━━━━━━━━━━━━━
📰 FUNDAMENTAL & ECONOMIC FACTORS — THE THIEF'S INTELLIGENCE REPORT
━━━━━━━━━━━━━━━━━━━━━━━━━━━━━━━━━━━━━━━━
🔴 BEARISH HEADWINDS (Current Threats):
🕌 1. MIDDLE EAST CONFLICT (IRAN WAR) — MAJOR RISK
➤ Iran struck a Kuwaiti oil tanker near Dubai port — Strait of Hormuz shipping at risk
➤ Japan imports ~90% of energy — direct economic impact from elevated oil prices
➤ Nikkei dropped 13.23% in March 2026 — worst monthly loss since 2008 GFC
➤ Risk-off sentiment dominating Asia-Pacific equities
💴 2. BOJ MONETARY POLICY — WATCHING CLOSELY
➤ Bank of Japan rate hike speculation strengthening JPY
➤ Stronger Yen = Exporter earnings pressure (Toyota, Sony, SoftBank)
➤ JGB yield curve steepening (10Y/2Y at 13-year high) — dual-edged signal
📉 3. TECH SECTOR SELLOFF — NIKKEI HEAVY HITTER
➤ Kioxia Holdings (-5.8%), Lasertec (-5.5%), Advantest (-4.8%) leading declines
➤ SoftBank Group (-4.3%) weighing heavily on index performance
🟡 4. TOKYO CPI — COOLING INFLATION
➤ Tokyo CPI grew at slowest pace in 4 years in March 2026
➤ Government subsidies dampening headline inflation — mixed signal for BOJ path
🟢 BULLISH TAILWINDS (Recovery Catalysts):
✅ 5. DEEP VALUE ZONE
➤ Nikkei trading ~15% below Feb 2026 ATH of 60,051
➤ Institutional accumulation likely at these compressed levels
✅ 6. US-IRAN DE-ESCALATION POTENTIAL
➤ Trump signals willingness to halt US military campaign vs Iran
➤ Any peace signal = Oil prices drop = Major Nikkei relief rally
✅ 7. GLOBAL RISK-ON RECOVERY
➤ US Futures up: S&P +0.94%, Dow +1.04%, Nasdaq +0.86% (01 Apr 2026 pre-market)
➤ VIX at 29.22 (-4.55%) — fear cooling, appetite returning
✅ 8. FOREIGN INVESTOR FLOWS
➤ Weak Yen makes Japanese equities cheaper for foreign buyers
➤ Historic discount attracting long-term institutional interest
📅 UPCOMING KEY EVENTS TO MONITOR:
🗓️ BOJ Policy Meeting Minutes
🗓️ Japan Manufacturing PMI Data
🗓️ US Non-Farm Payrolls (NFP)
🗓️ Iran-US Peace Talks Developments
🗓️ OPEC+ Production Meeting Updates
━━━━━━━━━━━━━━━━━━━━━━━━━━━━━━━━━━━━━━━━
🏴☠️ THIEF TRADER STYLE — MINDSET, WISDOM & MOTIVATION
━━━━━━━━━━━━━━━━━━━━━━━━━━━━━━━━━━━━━━━━
💬 "The market is the greatest casino ever built —
but the Thief knows when to walk in, and when to walk out with the bag." 🎰💼
💬 "We don't predict. We prepare.
We don't hope. We execute.
We don't panic. We profit." 🧠⚡
💬 "The amateur waits for certainty.
The Thief trades in the fog and still finds the vault." 🌫️🏦
💬 "Don't marry your trade. Take the profits.
The market will always give you another opportunity —
but only if you still have capital to play." 💵🔁
💬 "Risk management is not optional — it IS the strategy." 🛡️📐
━━━━━━━━━━━━━━━━━━━━━━━━━━━━━━━━━━━━━━━━
⚠️ RISK DISCLAIMER — READ THIS OR GET WRECKED
━━━━━━━━━━━━━━━━━━━━━━━━━━━━━━━━━━━━━━━━
🚨 This is NOT financial advice.
🚨 Trading CFDs, Futures & Indices carries HIGH RISK of capital loss.
🚨 Past performance does NOT guarantee future results.
🚨 Always use proper position sizing & risk management.
🚨 Never risk money you cannot afford to lose.
🚨 This idea is for educational & informational purposes ONLY.
Trade smart. Trade safe. Trade like a Thief. 🏴☠️💎
━━━━━━━━━━━━━━━━━━━━━━━━━━━━━━━━━━━━━━━━
👍 If this idea adds value to your trading — LIKE, FOLLOW & BOOST! 🚀
💬 Drop your thoughts in the comments — let's discuss! 🗣️
🔔 Follow for daily Thief-style market heist setups across global markets!
━━━━━━━━━━━━━━━━━━━━━━━━━━━━━━━━━━━━━━━━

Financial Markets Short: A Multi-Instrument Short IdeaOver in this video, I go through the following instruments that are all short and explain that the scenario that is going to unfold is going to be a flight-to-safety, which is a flight to USD:
1. Bitcoin
2. Ethereum
3. USDJPY
4. EURUSD
5. Gold
6. S&P500
7. Nasdaq
8. Nikkei 225
For all, it is important to take note of the stop loss because as convinced as I personally am with my analysis, I CAN, and am OFTEN, WRONG!
So please manage your risk.
Good Luck!

Nikkei 225 Wave Analysis – 31 March 2026
- Nikkei 225 reversed from support zone
- Likely to rise to resistance level 54000.00
Nikkei 225 recently reversed from the support zone between the pivotal support level 51235.00 (which has been reversing the price from January), lower daily Bollinger Band and the 61.8% Fibonacci correction of the upward impulse from October.
The upward reversal from this support zone is currently forming the daily Japanese candlesticks reversal pattern Morning Star – strong buy signal for Nikkei 225.
Given the long-term daily uptrend, Nikkei 225 can be expected to rise to the next resistance level 54000.00 (which has been reversing the price from the middle of March).

NIKKEI can go as low as 40k seeking the 1W MA200Nikkei (NI225) has been trading within a 6-year Channel Up since the March 2020 COVID crash. The price hit the pattern's top last month and the last 30 days have been a strong correction.
Even though the 1W MA50 (blue trend-line) hasn't been broken yet, this is technically the start of the pattern's new Bearish Leg. All previous Bear Cycles reached at least the 0.236 Channel Fibonacci level before rebounding as well as testing the 1W MA200 (orange trend-line).
This gives us a 43000 - 40000 Target Zone before the index turns into a long-term buy opportunity again.
---
** Please LIKE 👍, FOLLOW ✅, SHARE 🙌 and COMMENT ✍ if you enjoy this idea! Also share your ideas and charts in the comments section below! This is best way to keep it relevant, support us, keep the content here free and allow the idea to reach as many people as possible. **
---
💸💸💸💸💸💸
👇 👇 👇 👇 👇 👇

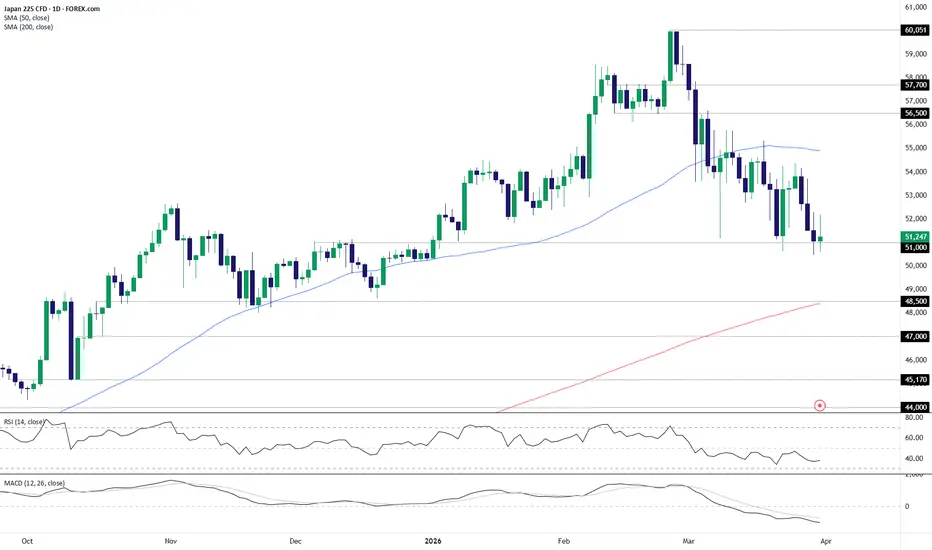
Nikkei: Heavy tape, 51000 under threat51000 is the line in the sand for Nikkei bulls. Defend it, or risk enticing more participants into the unwind already seen.
We’ve seen multiple bearish break attempts in March, all of which have failed. But the telling thing is the string of lower highs from bounces, sequentially failing around the 50DMA and, more recently, ahead of 54000. The index looks heavy.
RSI (14) is yet to set lower lows but remains below 50, indicating downside pressure remains in the ascendancy, a signal backed up by MACD which is motoring lower in negative territory.
Risks are therefore tilted to the downside, but they are unlikely to be acted upon until we see a definitive break, ideally accompanied by a close. Otherwise, it risks being just another failed break, potentially paving the way for a retest of sellers parked above 54000.
A sustained break of 51000 would allow for a stop to be placed above the level for protection, targeting the intersection of 48500 support and the 200DMA.
From a fundamental perspective, the longer the Iran war disrupts energy supply and keeps prices elevated, the greater the downside risk to Japanese corporate earnings, especially industrial names who derive a substantial share of revenues from offshore.
Good luck!
DS
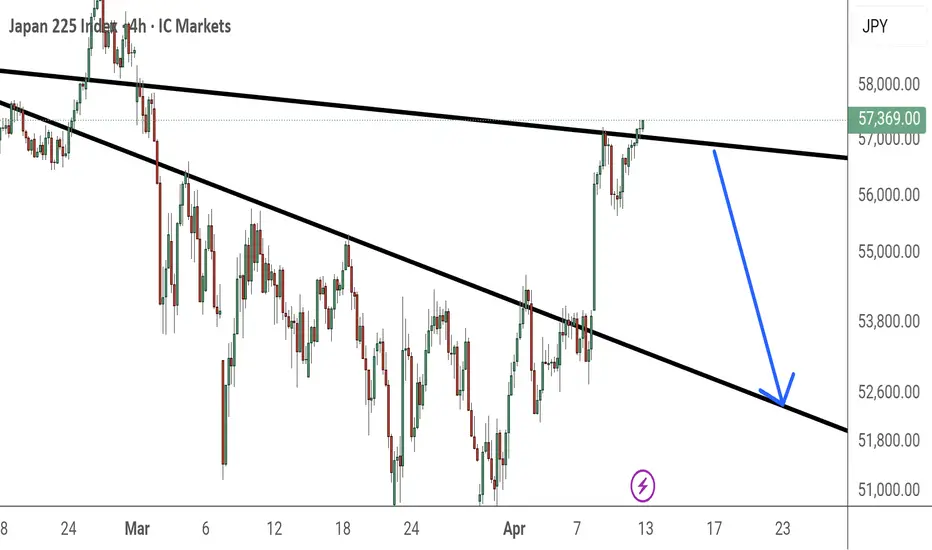
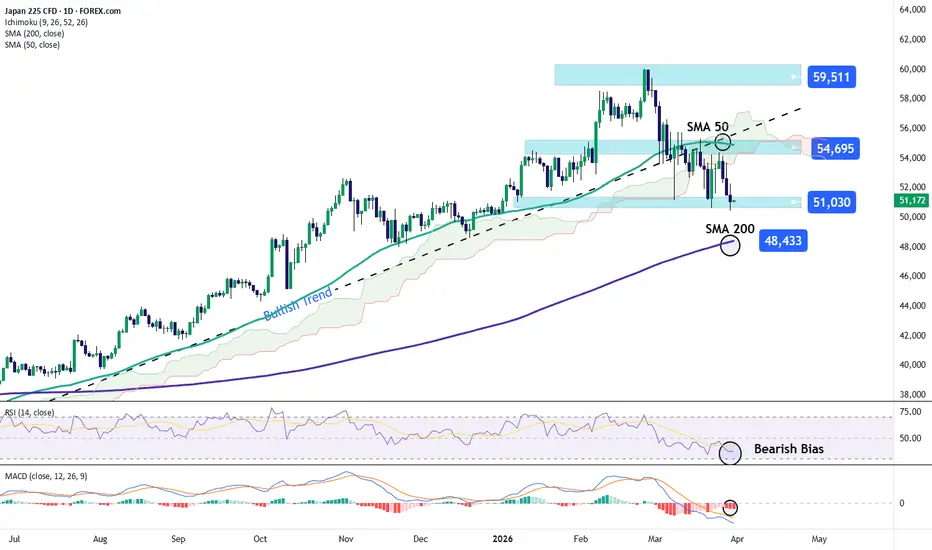
Nikkei continues to show weakness around the 51k levelThe Japanese index has started to show weakness over the last three trading sessions, posting a decline of more than 5% in the short term and reflecting a relevant bearish bias in the chart. For now, selling pressure appears to have re-established itself, partly due to the increase in risk sentiment across markets, which has reduced appetite for risk assets such as the Nikkei. Additionally, a neutral stance from the Bank of Japan limits expectations for rate cuts, strengthening the bond market and reducing the attractiveness of Japanese equities. If these factors persist, a more consistent selling pressure could continue to dominate in the short term.
Bearish move becomes more relevant: Over recent sessions, Nikkei price action has started to break below the long-term upward trendline that had been in place for several months. If the bearish bias continues to consolidate, this could lead to the formation of a new short-term downtrend, potentially dominating price action in the coming sessions. However, it is important to note that the price still faces a key resistance area, which could trigger short-term corrective moves.
RSI: The RSI remains below the 50 level, suggesting that selling momentum continues to dominate over the past 14 sessions. If this behavior persists, it could reinforce a consistent bearish pressure in the short term.
MACD: A similar scenario is observed in the MACD, with the histogram remaining below the zero line, indicating that short-term moving average momentum is still in bearish territory. This supports the view that selling pressure could remain dominant.
Key levels to watch:
54,695 – Key resistance level, aligned with the 50-period simple moving average. Moves toward this area could lead to a sideways scenario if no clear direction emerges.
51,030 – Near-term support, aligned with recent lows. A break below this level could reinforce a dominant bearish bias in the short term.
48,433 – Key support, aligned with the 200-period moving average. A sustained break below this level could trigger a more structured downtrend in the coming weeks.
Written by Julian Pineda, CFA, CMT – Market Analyst
JP225 Bullish Reversal at DemandMarket Outlook:
Despite the recent 4H bearishness, the Weekly and Daily charts remain firmly bullish. I am looking for a continuation of the primary trend as price tests a key structural demand zone.
The Strategy:
HTF Alignment: Using the Weekly/Daily bullish bias to filter for high-probability longs.
POI Identification: Price has retraced into a proven support area around the 51k handle.
Execution Trigger: A massive 4H Bullish Engulfing candle has formed, signaling that the "smart money" is likely defending this level.
Risk Management:
Maintaining a healthy risk-to-reward ratio by targeting the previous structural highs. The stop loss is tucked safely below the recent liquidity sweep to ensure we only stay in the trade if the bullish thesis remains valid.
Patience is key—let the higher timeframe bias do the heavy lifting.
