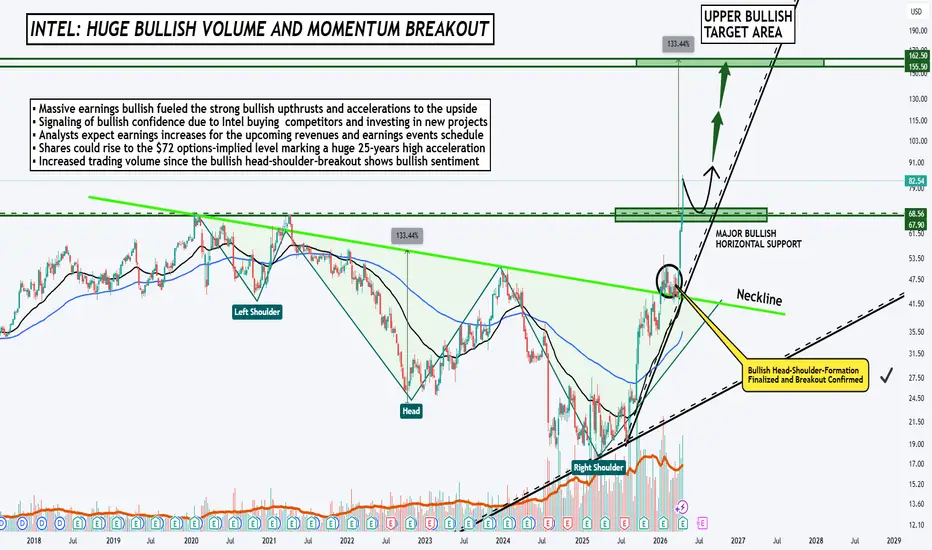
INTEL: Huge Bullish Earnings and Breakout Activated Targets!Hello There,
welcome to my new analysis about INTEL (INTC) on the weekly timeframe perspective. In the past month and weeks, the stock surged massively. The bullish volume and momentum increased heavily. Since the low at 18 in April 2025, exactly one year ago, the stock surged over 300% to the upside. Recently, the massive earnings boost originated in the pivotal bullish upthrust. In my analysis I detected further signs that are highly crucial right now.
As when looking at my chart, we can watch there how INTC, since breaking up above the all-time high region, printed another huge candle towards the upside. This all-time high region is now a major bullish horizontal support, as marked in my chart. Should INTC visit this area again, it will highly likely bounce there and set up the next bullish wave towards higher levels. Also, the 100-EMA marked in blue and the 35-EMA marked in black serve as strong support levels.
The completion of this gigantic and massively bullishly inverse head-and-shoulders formation has now activated the upper target areas, being within the 150 to 165 area. With INTC visiting those areas again, the stock would print another 100% towards the upside. With the options market and investor sentiment aligning with the bullish trend, the established bullish volume and momentum are likely to accelerate further. Once the targets have been reached, further assumptions about the continuation need to be made.
In this manner, thank you a lot for watching!
The support is highly appreciated.
VP
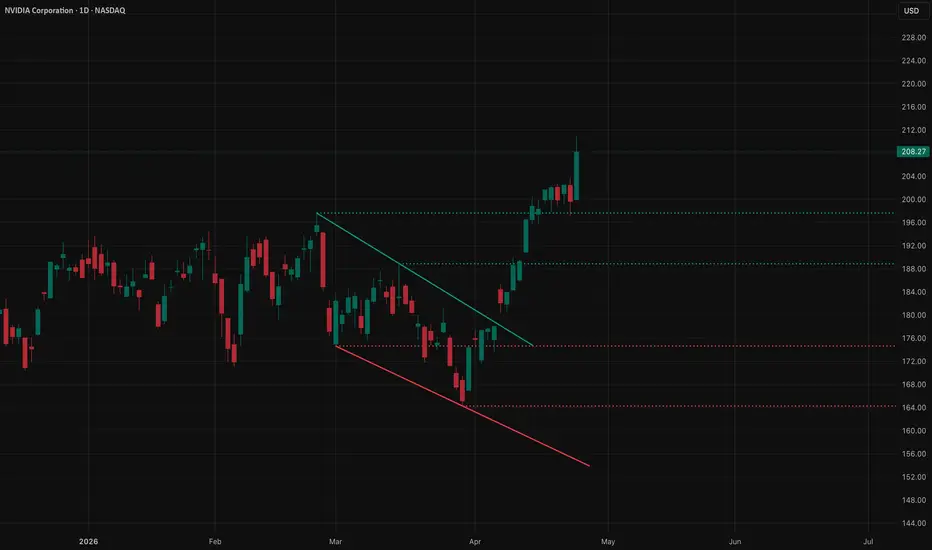
NVDA TA for This Week - April 27NVDA is trading at 208.10, sitting above every meaningful moving average on both the daily and weekly timeframes and pressing into open air above the recent pivot high at 188.88. There is no overhead resistance in the level pack — price has cleared the field. What happens next matters: either this move extends into a genuine continuation leg, or the tape stalls and we start watching the cluster of support structure below for clues on where the next base builds.
This is the kind of price action that looks easy until it isn't.
**1. Context — Bullish Structure, Confirmed**
The weekly structure is clean. NVDA is trading above the weekly 21 SMA at 184.63 and the weekly 50 SMA at 176.00, and the weekly 21 is above the weekly 50 — that's the condition that defines this as a bullish structure. Price is not fighting to reclaim a moving average; it's running above all of them. The daily stack is equally aligned: daily 21 at 187.57, daily 50 at 185.03, and daily 200 at 182.85 are all below current price and stacked in the right order. Every major trend reference is in the bulls' favor.
The weekly 200 SMA at 95.24 and weekly 300 SMA at 69.71 are so far below price they don't factor into near-term trade management. They're context for where the macro floor sits — nothing more right now.
**2. Setup — Extended Rally Into Open Space**
Price has broken through the recent pivot high at 188.88 and is now running without a clearly defined ceiling from this level pack. The move off the recent pivot low at 164.27 has been substantial, and NVDA is now trading roughly 27% above that low. The structure doesn't fit a clean, labeled pattern with conviction, so I'm not going to force one. What I will say is this: price has been trending higher through a stack of support levels that have flipped into a rising floor, and we're now in the upper extension of that move with momentum still pointing up but indicators beginning to flag overextension.
The ATR at 5.45 is the practical measure of daily noise. If you're sizing or placing stops, that's the number doing the work.
**3. Key Resistance — No Overhead Supply, Open Extension**
There are no defined resistance levels above 208.10 in this setup. Price has cleared the recent pivot high at 188.88 and traded through the volume profile's value area high at 191.89. The volume point of control at 188.00 is now below price, as is the VAH at 191.89. There is no pre-defined ceiling to lean against here. That's a double-edged condition — it means there's no resistance to stop a continuation, but it also means there's no price memory above to target precisely. The market is in price discovery above recent structure, and discipline on position sizing matters more in that environment, not less.
**4. Key Support — A Well-Defined Floor Below**
The support structure is layered and relatively close beneath current price.
The first meaningful level is 179.18, which aligns closely with the volume profile's value area low at 177.89 and sits just below the daily 200 SMA at 182.85. A pullback into this zone would be testing a confluence of multiple references — the kind of area where a healthy trend finds footing.
Below that, 174.64 is the next defined support, bracketed by the weekly 50 SMA at 176.00. If price were to reach this area on a pullback, I'd want to see that weekly SMA holding. It's the level the bias rests on: below 176.00 held weekly, the bullish structural argument gets complicated.
The deepest support in play is 164.27, which is also the recent pivot low. That's the swing level that, if broken, changes the character of this move from a healthy trend to something worth reassessing entirely.
The volume POC at 188.00 and VAH at 191.89 are the first zones price would revisit on any near-term pullback — both now acting as short-term support from below.
**5. Targets — Trend Extension**
With no overhead resistance to target precisely, the upside case is open-ended based on this setup. What I can say is that if the trend continues, 191.89 (the VAH) and 188.00 (POC) become the nearest reference points to watch on any dip — reclaiming those quickly on a pullback would signal the trend is intact. Trend extension beyond 208.10 has no defined ceiling here, which means the move lives and dies on momentum and how the indicators behave going forward.
**6. Indicator Confluence — Extended, Watch for Stall**
The daily RSI at 71.5 is overbought. Not catastrophically, but overbought. The weekly RSI at 65.11 is not yet in that territory, which is the mitigating factor — the weekly trend has room to run even while the daily is stretched. Critically, there is no bearish RSI divergence present. That matters. Divergence would be the early warning of trend exhaustion; its absence means the momentum signal is still aligned with the price move.
The daily Stochastic RSI is telling a different story. The K line is at 86.60 and D at 86.57 — they're essentially flat against each other at elevated levels, with the StochRSI itself at 99.36. The weekly StochRSI is at 100, with the K at 93.63 well above the D at 69.60. These are pinned-high readings. They don't predict a rollover, but they do tell you there is very little additional thrust available from momentum alone before a pause or pullback becomes probable. When both the daily and weekly StochRSI are pegged at or near 100, price can still grind higher, but the margin for error on new long entries shrinks.
**7. Levels at a Glance**
Resistance / Upside (above price):
* No defined resistance levels — price is in open extension above 208.10
Support / Downside (below price):
* 191.89 — Volume Area High (VAH), first reference on a pullback
* 188.00 — Volume Point of Control (POC), high-volume support node
* 188.88 — Recent pivot high, now structural reference from below
* 187.57 — Daily 21 SMA, short-term trend reference
* 185.03 — Daily 50 SMA, medium-term trend reference
* 184.63 — Weekly 21 SMA, weekly trend floor
* 182.85 — Daily 200 SMA, long-term daily support
* 179.18 — Defined support, near confluence with VAL and daily 200
* 177.89 — Volume Area Low (VAL), base of volume distribution
* 176.00 — Weekly 50 SMA, structural bias level
* 174.64 — Defined support, inside weekly 50 zone
* 164.27 — Recent pivot low, swing line in the sand
**Final Thoughts**
Bull case: The structural conditions remain intact. Price is above every major moving average, the weekly bias is bullish, and there is no bearish RSI divergence to warn of a reversal. If momentum continues and the daily RSI holds without rolling over sharply, this trend has room to extend into open space above 208.10. Any pullback that holds the 188.00 to 191.89 zone and then reclaims price above the VAH keeps the bull thesis clean.
Bear case: The daily RSI at 71.5 and daily StochRSI pinned near 100 with K and D converging are not bearish signals on their own, but they do flag that the move is stretched. A failure to continue higher, combined with a loss of the POC at 188.00 and then the weekly 50 SMA at 176.00, would start eroding the structural case. Below 176.00, the bullish argument requires reassessment.
**Bottom Line**
NVDA's structure is bullish and the levels confirm it — but price is extended against overbought daily momentum, running in open space with no overhead reference to manage against. Discipline on entries and respect for the support levels below are the job right now.
No hype. No bias. Just levels.
Trade safe. Plan ahead. Win together.
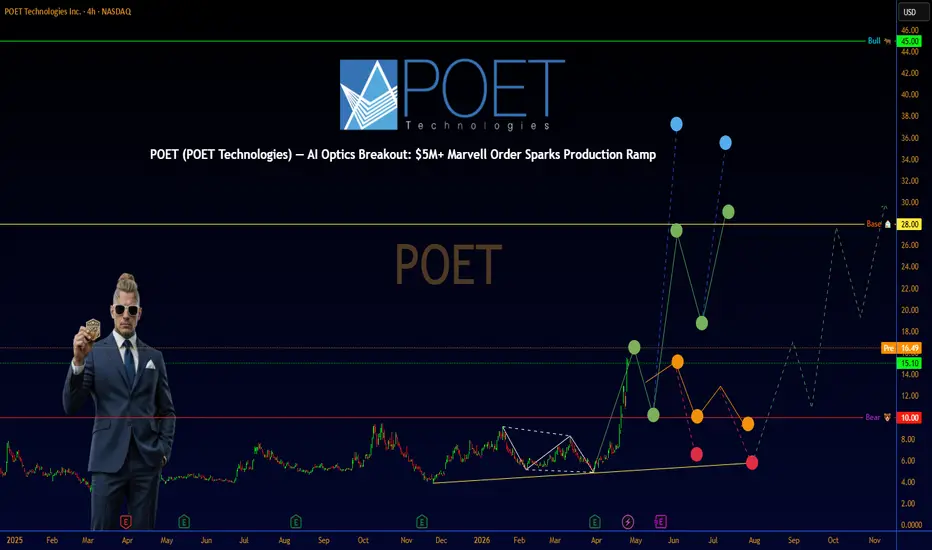
POET (POET Technologies) — AI Optics Breakout: $5M+ Marvell Ordr💡 POET (POET Technologies) — AI Optics Breakout: $5M+ Marvell Order Sparks Production Ramp
**SECTION 1 — Executive Summary** 💼
POET Technologies is at a pivotal commercialization inflection with its Optical Interposer platform solving critical power and bandwidth bottlenecks in AI data centers just as hyperscalers accelerate 800G/1.6T+ optical interconnect deployments. Recent confirmation of production orders exceeding $5 million from Marvell-linked customers plus massive capital raises position the company for its first meaningful revenue ramp in 2026. Overall rating: Buy. 12-month price target: $28 (blended DCF and peer comps methodology incorporating initial optical engine shipments plus TAM capture in AI photonics). The single biggest reason to own this stock right now is POET’s disruptive wafer-scale integration technology delivering lower cost/power optical engines at the exact moment AI infrastructure demand is exploding. The single biggest risk is execution slippage on volume production scaling against well-funded competitors.
**SECTION 2 — Business Overview** 🏢
POET Technologies develops and commercializes advanced photonic integrated circuits using its proprietary Optical Interposer platform that integrates lasers, modulators, detectors, and waveguides onto a single silicon chip for high-speed optical data transmission. Revenue breakdown (latest available): Primarily non-recurring engineering (NRE) and early product revenue from optical engines and light sources with 100 percent tied to AI/data center and telecom applications (no geographic split publicly detailed yet). Business model generates revenue through design wins, NRE fees, and high-margin optical engine/module sales with future recurring potential via licensing and volume shipments to hyperscalers and module makers. Competitive moat comes from patented passive alignment and wafer-scale semiconductor manufacturing that eliminates costly active alignment steps used by traditional photonics players delivering superior cost, power efficiency, and scalability for 800G/1.6T+ AI interconnects.
**SECTION 3 — Financial Deep Dive** 📈
Key metrics (most recent publicly available as of Q4 2025 ended Dec 31 2025; source: company filings Apr 1 2026):
Revenue: $341k (Q4 2025) vs $29k (Q4 2024); TTM ~$1.07M.
Net income: -$42.7M (Q4 2025).
EPS: -$0.32 (Q4 2025, non-GAAP context similar).
Gross margins: Not yet meaningful at commercial scale.
Free cash flow: Negative reflecting R&D and ramp investments.
YoY growth rates: Revenue +1,075 percent (Q4) but from tiny base; net loss improvement on per-share basis.
Balance sheet health: Cash and equivalents ~$430M post-2025/early-2026 financings; low debt; strong liquidity.
Cash flow quality: Operating cash flow negative but aligned with pre-revenue ramp phase (no red flags).
Capital allocation: Heavy focus on R&D, manufacturing partnerships, and production scale-up with recent equity raises funding AI optics acceleration.
**SECTION 4 — Growth Analysis** 🚀
Total addressable market (TAM): Global optical transceiver market projected to reach $27.6B by 2030 (CAGR 16.8 percent 2026-2030 per industry reports); AI-specific segment within silicon photonics/optical engines exceeding $20B+ opportunity by late 2020s. Current market share: Nascent but first production orders signal entry into high-growth AI segment. Key growth drivers for next 3-5 years: Initial shipments of POET Infinity optical engines (800G/1.6T), partnerships with module makers (Lessengers, LITEON), and hyperscaler adoption for AI clusters. Management guidance points to 2026 as inflection with 30k+ engine shipments targeted; analyst consensus more cautious near-term but aligned on long-term optics boom. Growth primarily organic via proprietary platform rather than acquisition-dependent.
**SECTION 5 — Valuation** 📊
DCF analysis: Base case assumes revenue ramp to hundreds of millions by 2028-2030 on optical engine adoption, 40 percent+ gross margins at scale, WACC 12 percent (reflecting early-stage risk), terminal growth 4 percent . Implied value supports $28 target. Comparable company analysis (peers as of April 2026): Broadcom, Marvell, Coherent (optics proxies) trade at 20-40x forward sales on AI growth; early-stage photonics names at premium to revenue. Historical valuation range (limited): Pre-commercial volatility with recent surge. Bull target $45 (accelerated 1.6T+ wins); Base $28; Bear $10 (delayed shipments). Current price ~$15 offers ~87 percent upside to base target.
**SECTION 6 — Risk Analysis** ⚠️
1. Production execution and yield ramp delays (high probability/impact): Triggered by manufacturing scale challenges; watch quarterly shipment updates and partner confirmations.
2. Intense competition from established photonics players (medium-high): Broadcom, Intel, Ayar Labs; monitor design win announcements.
3. Dilution from additional capital raises (medium): Though cash is now strong; track balance sheet updates.
4. Macro/AI capex slowdown (medium): Hyperscaler spend cuts; watch big-tech guidance.
5. Regulatory/PFIC tax or listing risks (low-medium): Recent U.S. redomicile plans mitigate; monitor shareholder vote.
Short interest elevated but declining post-rally per recent data. Insider activity shows confidence via retained holdings. No major accounting quality flags.
**SECTION 7 — Catalyst Calendar** 📅
Next earnings date: Mid-May 2026 (Q1 2026 results with likely production update). Upcoming events: First optical engine shipments targeted Q3 2026; potential additional design wins from Foxconn/Luxshare. Macro events: AI infrastructure capex announcements from NVIDIA/Meta/Google. 12-month timeline: Q2 earnings August, volume production milestones late 2026, potential U.S. listing progress.
Global optical transceiver market exploding on AI demand underpins massive TAM.
AI-specific optical engine packaging trends show clear shift toward co-packaged solutions where POET competes.
**SECTION 8 — Technical Analysis** 📈
Primary Chart: Daily timeframe, 1-year view shows explosive breakout in April 2026 from multi-month base around $5-7 to new 11-year highs near $15+ with massive volume. Price action well above both 50-day and 200-day moving averages confirming strong uptrend. RSI (14) elevated but not extreme (~70+ on surge days) with room before overbought; MACD bullish crossover with expanding histogram. Major support zone $10-12 (prior breakout), resistance $18-20. Visible chart patterns: Clear higher highs/lows since March lows plus volume climax on news. Technical implication: Bullish continuation into May earnings if momentum holds with potential for further extension on positive updates.
**SECTION 9 — The Verdict** 🏆
Bull case ($45 target, 35 percent probability): Multiple design wins and 2026 shipments exceed expectations driving re-rating to AI infrastructure leader.
Base case ($28 target, 45 percent probability): Steady order execution and cash burn management deliver first profitable trajectory.
Bear case ($10 target, 20 percent probability): Ramp delays or competitive losses lead to dilution and sentiment reset.
Expected value calculation: Probability-weighted price target = $28.50. Final recommendation: Buy with High conviction. The 30-second elevator pitch: POET is the rare early-stage photonics pure-play with proven tech, massive cash, and first commercial orders exactly as AI data centers demand cheaper/faster optical engines — positioning it for explosive growth in a $20B+ TAM.
**Sources**
POET Technologies Investor Relations (poet-technologies.com) Q4 2025 results and MD&A Apr 1 2026; Yahoo Finance/Seeking Alpha financial data and news Apr 2026; company press releases on Marvell/Celestial AI orders Apr 2026; industry reports on optical transceiver market (Business Research Company, LightCounting) 2026 forecasts; MarketBeat/TipRanks analyst commentary Apr 2026.
What are your thoughts on POET? Drop them below 👇
#POET #AIOptics #SiliconPhotonics #OpticalInterposer #DataCenterAI #MarvellOrder #PhotonicsStock #800G #1.6T #AIBoom
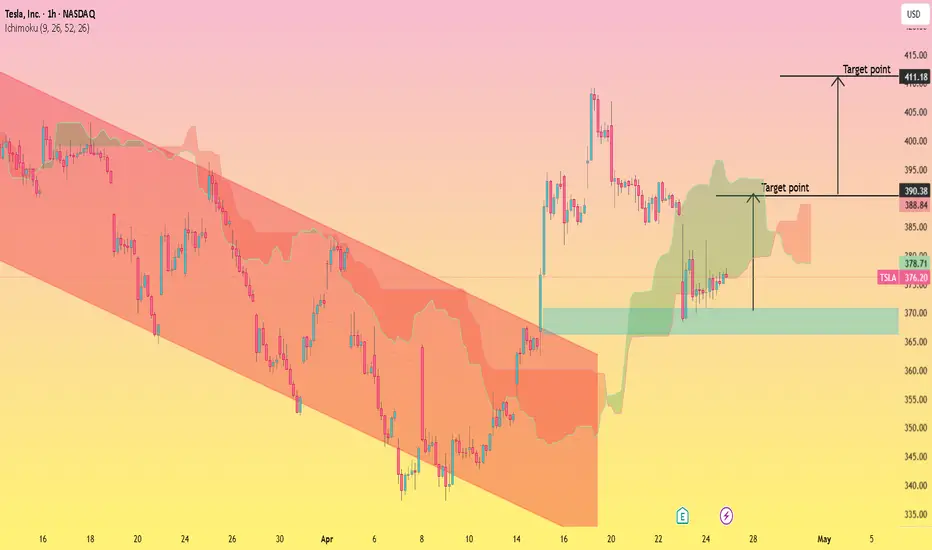
Tesla Breakout After Downtrend – Bullish TargetsThis chart of Tesla, Inc. (TSLA) shows a clear shift from a strong downtrend into a bullish recovery. Initially, the price was moving inside a descending channel (red zone), indicating consistent selling pressure. However, the price eventually broke out of this channel with a sharp upward move, signaling a potential trend reversal.
After the breakout, the price formed a consolidation range around the green support zone (near 370–372), showing stability and accumulation. The presence of the cloud (likely an Ichimoku indicator) suggests the market is trying to build bullish momentum above support.
Targets:
First Target: Around 390–395 (short-term resistance area marked on chart)
Second Target: Around 410–412 (major resistance / target point shown above)
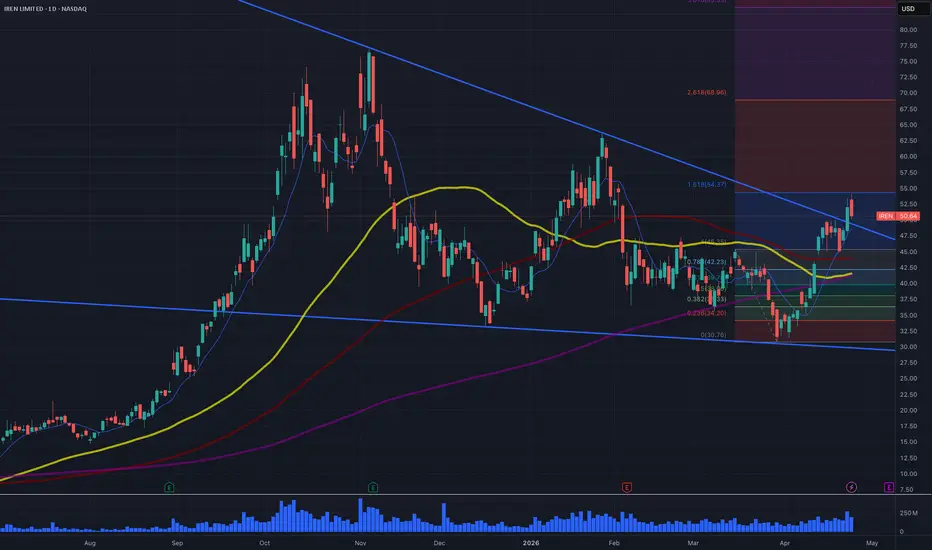
IREN: Critical Resistance Confluence – Make or Break MomentDescription:
IREN is currently testing a massive confluence of resistance, setting up a classic "make or break" scenario on the daily chart. While the underlying momentum is undeniably strong, the price action has just hit a brick wall, demanding patience before looking for a long entry.
The Resistance (The Ceiling)
The most critical feature right now is the immediate rejection we are seeing on the right edge of the chart. The price perfectly tapped a dual-layered resistance zone:
Macro Trendline : The descending trendline (blue) has successfully capped the price action since the peak late last year.
1.618 Fib Extension : Drawn from the recent base, the 1.618 extension sits precisely at $54.37.
After tagging this area, the recent daily price action shows a sharp rejection, pulling back to the $50.60s. This proves sellers are actively defending this confluence.
The Support Structure (The Floor)
Despite the rejection at the top, the structural setup that drove the price to this level is incredibly bullish:
Moving Average Bounce : The price established a rock-solid bottom around the $30.00 level, perfectly rejecting off the long-term moving average and the 0 Fib level ($30.76).
Bullish Momentum : The shorter-term moving averages have crossed bullishly and are sloping upward.
Fundamental Catalyst : Beyond the chart, the clean balance sheet coming out of the Q2 FY2026 reporting provides a strong fundamental floor to justify this high-volume rally.
The Trading Plan
Buying directly into a macro descending resistance line and a major Fibonacci extension offers a poor risk-to-reward ratio. I am watching two specific scenarios play out:
The Breakout : Waiting for a confirmed daily close above the blue trendline and the $54.37 level on high volume, turning that ceiling into a new floor.
The Pullback : Waiting to see if the price bases out and finds support at the 1 Fib level ($45.35) or the rising shorter-term moving averages before making another attempt at the trendline.
Trade Plan: OLEDTrade Plan: OLED
• Direction: Long
• Entry: 99.00
• Stop Loss:83.50
• TP1: 120.00
• TP2: 145.00
• TP3: 200.00
• TP4: 248.00
Take partial profits at each target, then trail stop to protect profits.
Not financial advice.

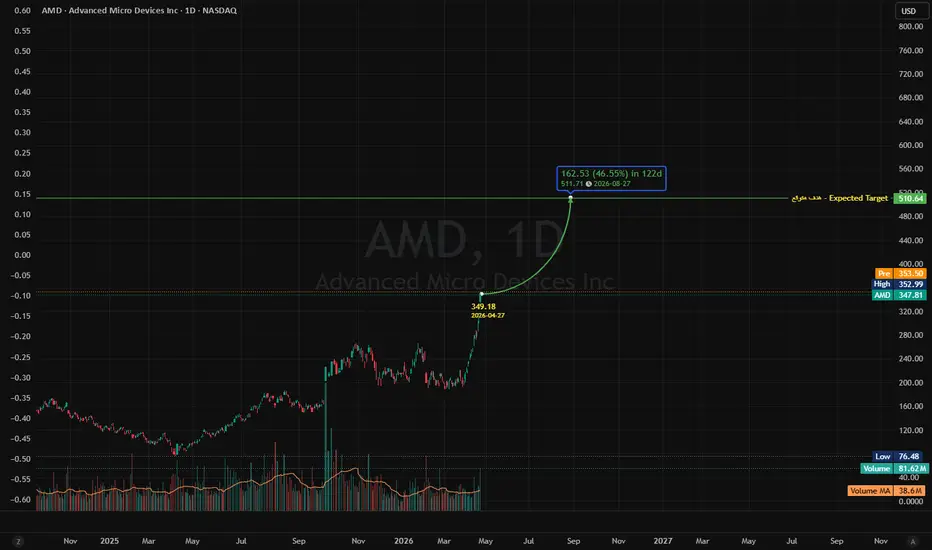
AMD - Advanced Micro Devices IncThe stock is expected to rise over the next 122 days,
Expected increase of 46%
Trade Plan: CDWTrade Plan: CDW
• Direction: Long
• Entry: 123.00
• Stop Loss:110.50
• TP1: 170.00
• TP2: 220.00
• TP3: 310.00
Take partial profits at each target, then trail stop to protect profits.
Not financial advice.

Trade Plan: DQTrade Plan: DQ
• Direction: Long
• Entry: 22.80
• Stop Loss:16.50
• TP1: 53.80
• TP2: 110.00
• TP3: 210.00
Take partial profits at each target, then trail stop to protect profits.
Not financial advice.

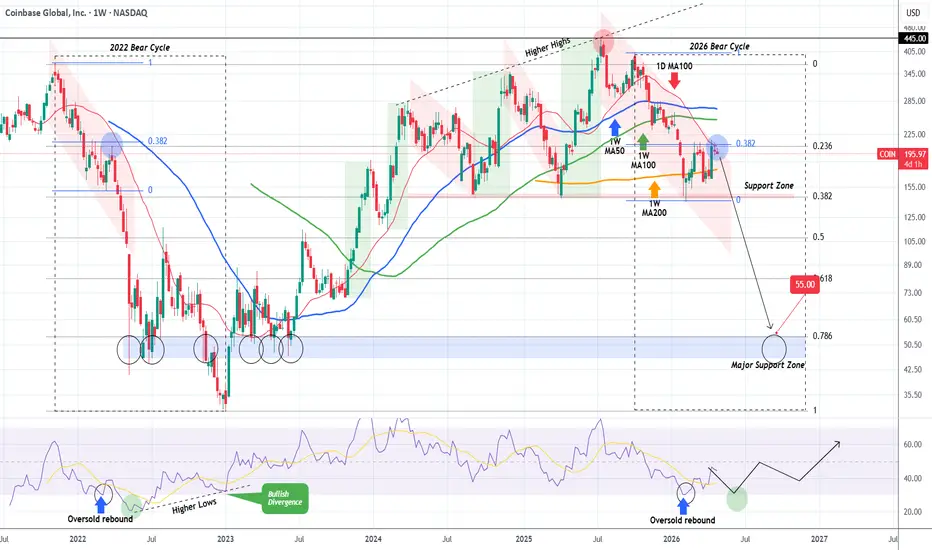
COINBASE failing on the 1D MA100 like in 2022. Huge crash next?Coinbase (COIN) continues to repeat the 2022 Bear Cycle and right now it is on the Resistance cluster that consists of the 0.382 Fibonacci retracement (blue) and the 1D MA100 (red trend-line)
That was where on March 28 2022 it got rejected and initiated Phase 2 of the Bear Cycle below the (red) Channel Down towards the major Support Zone below the 0.786 Fibonacci level.
Our long-term Target is located just above it at $55.00. Observe also the 1W RSI sequences among the 2026 and 2022 fractals. So far they've been quite similar and right now it suggests that the next leg down is where the RSI will get oversold.
---
** Please LIKE 👍, FOLLOW ✅, SHARE 🙌 and COMMENT ✍ if you enjoy this idea! Also share your ideas and charts in the comments section below! This is best way to keep it relevant, support us, keep the content here free and allow the idea to reach as many people as possible. **
---
💸💸💸💸💸💸
👇 👇 👇 👇 👇 👇
Coinbase - Price is following exactly as I predicted thus farWARNING - This will be my last post on Coinbase for some time. I will post on other various stocks, but as for Coinbase, this will be my last post for a while.
Looking at the price action carved out thus far, I still favor the white pattern over the yellow. Looking at the overnights, price is up a little over $2 which is moving exactly according to my white pattern. That being said, regardless on if the white or yellow is fulfilled, THEY BOTH POINT TO THE GRAY TARGET BOX. This is not because of some headline people look to in order to explain why the stock is moving. I have lost count the number of times I have said this. Price moves in cyclical patterns. Headlines are just the catalyst (if that) causing price to START or FINISH its current move. So y'all can sit and debate as to why price is moving the way it is. Or you can lie to yourself and anyone that is listening by trying to say the stock is "rigged". The bottom line is, price follows a specific pattern 99.999% of the time, not some headline.
P.S: We currently have positive divergence. I want it to stay that way all the way to the target box.
P.S.S: The turquoise pattern could be playing out pointing much lower than the gray target box. I also have an orange pattern that points to the $128 region. I do not think these are high likely probabilities...but they are still possible, nonetheless.

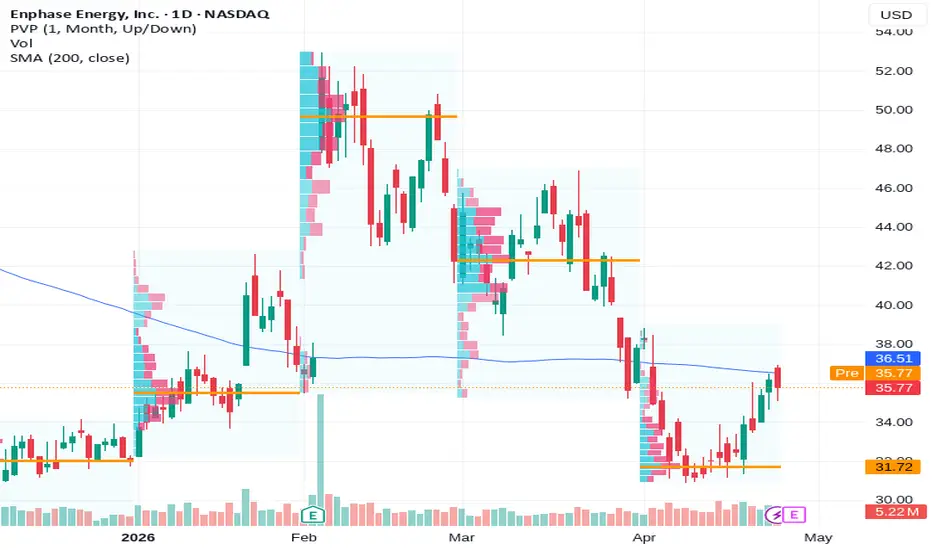
ENPH Breakout Watch: $36 Level Could Trigger Fast Upside:Current Price: 35.77
Direction: LONG
Confidence level: 58%(Trader commentary and sentiment lean bullish with repeated focus on a $36 breakout and $38+ upside target, but data volume is limited and lacks strong multi‑source confirmation.)
Targets
Target 1: 36.80
Target 2: 38.50
Stop Levels
Stop 1: 35.30
Stop 2: 34.80
Wisdom of Professional Traders:
This analysis synthesizes insights from thousands of professional traders and market experts, combining what traders are saying across platforms with real‑time sentiment. When many traders independently focus on the same price levels and catalysts, it often reveals where liquidity and momentum may appear next in Enphase Energy.
Key Insights:
Here's what's driving this setup. Several traders are focused on the $36 level, which has been acting as the immediate resistance zone. Multiple traders pointed out that a break above this level could open the door to a quick move toward the $37–$38 area. What's interesting is that sentiment around the recent earnings beat and European distribution partnership is pushing traders toward the bullish side.
At the same time, traders are clearly watching the $35 support area. The price dipped toward that zone recently but held, which suggests buyers are stepping in around that level. When price sits between well‑defined support and resistance like this, the next breakout tends to move quickly once liquidity builds.
The other thing catching attention is the broader solar sector interest. Several traders mentioned that if the sector catches momentum again, ENPH could be one of the faster movers because of its high beta.
Recent Performance:
ENPH has been bouncing around the mid‑$30 range recently after recovering from deeper lows earlier in the year. The stock traded as high as $36.94 intraday before pulling back to around $35.77. That price action tells me the market is testing resistance but hasn't fully committed yet. Volume around the earnings announcement also increased, which suggests institutions are paying attention again.
Expert Analysis:
Traders are mostly focused on a technical breakout scenario. Several traders highlighted the $36 resistance level and the $38–$38.5 upside target if momentum kicks in. That level comes up repeatedly because it lines up with previous price congestion and moving‑average resistance on the chart.
At the same time, some traders pointed to $34.5 as the downside level if support fails. That gives us a fairly clean risk‑reward setup: the market is compressing between $35 support and $36 resistance. When traders see that type of compression, they usually position for the breakout direction.
News Impact:
Recent news helped the bullish case. Enphase reported a Q1 2026 earnings beat with stronger‑than‑expected EPS and modest revenue growth guidance. On top of that, the new European utility partnership expands distribution for its micro‑inverter and storage products. There are still regulatory concerns in Europe that traders mentioned, but right now the market seems more focused on the earnings strength.
Trading Recommendation:
So where does this leave us? I'm leaning LONG because trader sentiment tilts bullish and price is holding just above the $35 support zone. The key trigger is a push above $36. If momentum follows through, the move toward $36.80 and then $38.50 this week looks achievable.
I'd treat this as a breakout trade rather than a long‑term position. Enter near the current range or on a confirmed move above $36, keep risk tight below $35.30, and watch volume closely. If buyers step in aggressively, ENPH could move quickly because short interest in the name is still elevated.
MSFT approaching key $434 resistance ahead of earnings – downsiCurrent Price: 424.62
Direction: SHORT
Confidence level: 62%(Several professional traders identified $434 as major resistance while noting MSFT remains below the 200‑day moving average. Multiple downside levels ($412 and $394) were discussed as potential pullback zones if earnings disappoint. X sentiment is bullish but trader technical analysis leans toward near‑term downside risk.)
Targets
Target 1: 412
Target 2: 394
Stop Levels
Stop 1: 434
Stop 2: 440
Wisdom of Professional Traders:
This analysis combines what professional traders are saying with real‑time social sentiment to identify actionable setups in Microsoft. When many traders independently point to the same levels—like the $434 resistance and $394 support—it helps filter noise and highlight the price zones that the market is actually watching.
Key Insights:
Here’s what’s driving the trade idea right now. Several professional traders highlighted that Microsoft is still trading below its 200‑day moving average, which suggests the broader trend hasn’t fully recovered. When a mega‑cap sits below that long‑term average, rallies often stall at nearby resistance levels.
The second big factor is timing. Microsoft reports earnings this week alongside other major tech giants. Many traders are treating the move into earnings as a “decision zone.” If price can’t break above the $434 Fibonacci resistance level that multiple traders identified, the path of least resistance could shift lower quickly.
At the same time, X sentiment shows plenty of optimism around Microsoft’s long‑term AI story. Posts referencing Azure growth, Copilot monetization, and institutional buying remain strong. But that optimism doesn’t necessarily protect the stock from short‑term pullbacks—especially heading into a volatile earnings catalyst.
Recent Performance:
Microsoft closed around $424.62 after a modest daily gain of about 2.1%. Over the past month the stock has climbed roughly 12%, but it’s still well below its 52‑week high near $553. That means the recent move looks more like a rebound inside a broader correction rather than a confirmed new uptrend.
You can see this clearly on the chart. Price is currently sitting in the middle of its yearly range and approaching a cluster of resistance levels around $430–$435.
Expert Analysis:
Several professional traders repeatedly mentioned the same technical levels. The most important one is $434, which lines up with a key Fibonacci retracement and recent resistance area. Multiple traders noted that a confirmed breakout above that level would shift the trend bullish again.
But until that breakout happens, traders are watching downside zones. A few traders highlighted $412 as a short‑term price action level, while the bigger support sits around the $394 50‑day moving average. If earnings disappoint or guidance comes in soft, those levels become realistic short‑term targets.
What caught my attention is how consistent those numbers were across different trader analyses. When multiple traders independently mention the same levels, they often become self‑fulfilling because so many participants are watching them.
News Impact:
Recent news flow adds another layer of uncertainty. Microsoft is offering voluntary buyouts to employees while ramping up AI infrastructure spending. That combination shows the company is aggressively reallocating resources toward AI and cloud growth.
Meanwhile analysts remain extremely bullish long‑term, with price targets from firms like Guggenheim and Citigroup in the $586–$600 range. But markets often separate long‑term optimism from short‑term earnings risk, especially when expectations are high.
Trading Recommendation:
Putting it all together, I’m leaning SHORT into the resistance zone. The setup is fairly straightforward: Microsoft is approaching a widely discussed resistance area near $434 while heading into a high‑volatility earnings event.
I’d look for weakness below $434 with downside targets at $412 first and $394 if momentum accelerates after earnings. Risk should be managed tightly with stops above $440 in case the stock breaks out and squeezes higher.
If Microsoft pushes decisively above $434 and holds it, that would invalidate the bearish setup quickly. But until that breakout happens, the trader consensus suggests the risk‑reward slightly favors the downside this week.

NVO: Quality Stock, Broken Trend — The Reversal MapNovo Nordisk is a clean example of why quality alone is not an entry.
Fundamentally, this is not a weak business.
But technically, the chart is still under pressure.
On the daily timeframe, NVO remains trapped inside a broad bearish channel after a major decline from its highs. The first bearish ABC target has already been reached, but the larger bearish sequence still leaves room for a deeper capitulation move if buyers fail to reclaim structure.
The key detail here is the rejected BC zone .
Price pushed into the upper BC area, tested it, and sellers defended it. That keeps the bearish lower-high structure alive. So I am not treating the current price as a confirmed reversal yet.
This is the map I’m watching:
Bearish case:
As long as price stays below the descending structure and fails to reclaim the BC zone, the larger bearish C target remains open. That lower pink target area could become the real panic zone where weak hands get forced out.
Bullish case:
If price drives lower into that target area, then starts showing real displacement, market structure shift, and strong reclaim behavior, NVO becomes very interesting. Not because it “looks cheap,” but because the downside sequence would be mature and buyers would finally be proving themselves.
For me, the clean reversal confirmation would be:
Price sweeps deeper liquidity or taps the larger bearish C target zone
Buyers step in with displacement, not weak sideways candles
Daily structure shifts bullish
Price reclaims the bearish channel
BC zone turns from resistance into support
Only then does the upside map open.
First major upside objective would be the rejected BC region around the mid-$60s.
After that, the old bearish target / supply area near the $80–$90 region becomes the next logical magnet.
My read:
NVO is a quality company inside a damaged chart.
That combination can create major opportunity, but only after structure confirms.
Buying just because the stock is down is emotional.
Waiting for capitulation, reclaim, and structure shift is disciplined.
The chart is not saying “buy now.”
It is saying: prepare, mark the levels, and wait for proof.
Not financial advice.

TSLA (Tesla Inc.) — Range Break or Rejection?Idea
TSLA is currently trading in a wide consolidation range after high volatility phases. The market is waiting for a catalyst (AI, autonomy, deliveries, margins).
This creates a classic breakout vs rejection setup.
📈 Technical Overview
- Range-bound structure
- Key resistance overhead
- Liquidity building on both sides
- Potential for expansion move
🟢 LONG Scenario (Breakout Play)
Entry: Break & hold above $200–210 resistance
Targets:
- TP1: $240
- TP2: $270+
Stop-loss: Below $190
👉 Logic: breakout + momentum ignition + retail/institutional flow
🔴 SHORT Scenario (Rejection Play)
Entry:
- Rejection from $200–210 zone
- Weak momentum / fake breakout
Targets:
- $170
- $150
Invalidation:
Clean breakout with strong volume
⚠️ Risks
- News-driven volatility (AI, FSD, earnings)
- Elon Musk headlines impacting sentiment
- Market-wide tech sector moves
🧩 Summary
- TSLA is in a decision zone.
📌 Strategy:
- Trade the breakout OR
- Fade the rejection
No middle ground - wait for confirmation.

Crcl in elliot untill top paralell 120-125Imo Crcl Circle we hit 96 now target 120-125 top of paralell

NOW: Massive Head-Shoulder-Formation, Bear Market Setups!Hello There,
welcome to my new analysis about the ServiceNow (NOW) stock on the weekly timeframe perspective. I am analyzing the log perspective chart, as this shows better relations between the low and high price levels. In the past, the stock has increased massive bearish selling pressures with declines never seen before in the stock's history.
In the past few weeks, the stock has dropped sharply, over -30%, penetrating the 80 level. On the broader timeframe perspective, there is just a much bigger formation forming. The neckline of this huge head-and-shoulders formation is now being tested by this massive bearish selling pressure towards the downside. This is marking the point of completion of the left shoulder and the head of the formation.
Considering the volume structure, the stock has accelerated heavy bearish volume increases. The options market also shows a major bearish sentiment, with implied volatility rising above 50 and put option placements rising above 250%. This is a dire situation, as the stock also faces competitor threats from large-cap operators. Considering this dynamic, the whole sentiment of the stock shows a highly bearish development.
From here on, the stock is likely to move on completing the right shoulder of this massive bearish formation. The whole formation will be completed with a final breakdown below the neckline, with the confirmational formation as shown in my chart. Once this breakdown emerges, the bearish target zones will be activated, setting the stock up for another -60% drop towards the bearish direction.
Once the target zone of 31.40 has been reached, further assumptions about the bearishness will be highly important for the further development.
What do you think about the stock? Are you currently considering trades on the short side?
Let us know in the comments!
VP

April 26, 2026 BTBT. The time to go long has come.- Exchange: Kraken
- Instrument: BTBTx/USD (xStocks)
- Timeframe: Weekly
- Trade type: Buy limit order
- Price: 1.74
- Take Profit: Open
- Stop Loss: 1.53 (-12.10 %)
Idea: Long on a breakout above last week's high — bullish momentum continuation.
Entry: Buy limit order above last week’s high.
Stop-loss: Below the low of the same candle. A pullback below this level invalidates the trade.
Take Profit: Trailing stop following the lows of new weekly candles.
This is not an individual investment recommendation.

Coinbase in Range – Break or Reject👋 Hello to all TradingView professionals and followers,
Hope you're doing great and your trades are profitable 🌱📈
Today, we’re taking a look at the valuable stock **Coinbase (COIN)**, one of the key players in the crypto industry within the U.S. stock market.
---
💼 **Long-Term Investment Perspective**
Coinbase, as one of the largest cryptocurrency exchanges in the world, directly benefits from the growth of the crypto market. In the long run, this stock shows a strong correlation with the overall crypto trend, especially Bitcoin 🪙
For patient investors, it can deliver significant returns during bullish market cycles.
---
📊 **Technical Analysis Based on the Chart**
🔺 Overall Trend:
After a strong bullish move, the stock has entered a **Broadening Range pattern**.
📌 Key Characteristics:
* Higher Highs 📈
* Relatively equal lows near the support zone 📉
* Increasing volatility ⚡
🟡 **Key Support Zone:**
A strong support area is clearly visible on the chart, which has prevented further downside multiple times 🛡️
⚪ **Critical Resistance Zone:**
The **$220 level** is acting as a major resistance on the daily timeframe 🚧
---
🚫 **No Trade Zone**
Currently, the price is moving between support and resistance, making this range a low-probability area for entries ❗
The best approach here is to wait for a confirmed breakout ⏳
---
🚀 **Possible Scenarios**
🟢 Bullish Scenario:
If price **breaks and holds above $220 on the daily timeframe**:
* احتمال ادامه حرکت صعودی
* Smart money inflow
* Higher targets become achievable 🎯
🔴 Bearish Scenario:
If the support zone is lost:
* Potential for further downside
* Deeper correction scenario activates 📉
---
💡 **Investment Idea**
For a lower-risk entry:
👉 Wait for a **confirmed breakout and consolidation above $220**
👉 Scaling in after confirmation can be a more reliable strategy
---
📊 **What do you think? (Poll)**
🟢 Bullish breakout above $220
🔴 Rejection and drop back to support
🟡 Continued range movement
Drop your thoughts below 👇
---
⚠️ **Disclaimer (Important)**
This analysis is for educational purposes only and should not be considered financial advice.
All investment decisions are your own responsibility. Always practice proper risk management and do your own research (DYOR) before entering any trade.
---
#Coinbase #COIN #TechnicalAnalysis #USStocks #Investing #Crypto #Bitcoin #PriceAction #TradingView #SwingTrading #LongTermInvesting

PLTR TA This Week Apr 27PLTR is sitting right on top of a critical short-term decision zone, trading at 142.40 with the daily 21 SMA directly overhead at 142.63 and the weekly moving averages a significant gap higher. This is the kind of area where a stock either coils and reclaims structure — or rolls over and confirms the bearish case that's been building for weeks.
The next move from here matters. A clean hold and reclaim of the daily moving averages would be constructive. A failure and rollover from this zone opens up a meaningful downside leg toward key volume support. There is no ambiguity in the setup — price is at the line.
**1. Context — Bearish Until the Weekly Level Is Reclaimed**
The bias here is bearish, and the weekly chart explains why. PLTR is trading below the weekly 21 SMA at 156.55 and the weekly 50 SMA at 157.99. Those two levels define the macro structure right now. Below them, this is a stock in a bearish trend regardless of how any individual daily candle looks. Reclaim and hold above 157.99 and we start having a different conversation. Until that happens, every rally is innocent until proven guilty — and the burden of proof sits with the bulls.
The daily 200 SMA at 164.43 reinforces the ceiling above. There is significant moving average resistance stacked between 142.63 and 164.43, and price has not been living above any of it.
**2. Structure — Compression Into Resistance**
Without forcing a textbook label on this, what PLTR has been doing is grinding from a recent pivot low of 122.68 back up toward the 140s — a recovery off a meaningful flush that has now run into the daily moving average stack. The daily 21 at 142.63 and daily 50 at 144.35 are directly above current price, and these are levels the stock needs to clear and hold, not just poke through on an intraday basis.
This is a recovery attempt testing the first real wall of resistance after a significant decline. That context matters. Until price reclaims those levels with conviction, this is compression into resistance, not a base-building breakout.
**3. Key Resistance — A Stack That Needs to Be Cleared Level by Level**
Starting right overhead: the daily 21 SMA at 142.63 and daily 50 SMA at 144.35 are the first two gatekeepers. These are not major macro levels, but failing to hold above them would be a clear short-term signal that buyers don't have control.
Beyond those, the next real resistance is 156.28 — the recent pivot high and a clear overhead supply zone. That is where sellers showed up last time, and it should be respected as such on any re-test.
Clustered just above that is 161.45 and then 162.40, both meaningful resistance levels in the same zone. And the weekly 21 SMA at 156.55 and weekly 50 SMA at 157.99 sit right in the middle of that cluster, making 156 to 163 a dense and well-defined resistance band. The VAH from the volume profile at 158.88 adds another layer of overhead supply in that same area. Getting through this zone would require sustained buying pressure and a real shift in character.
The daily 200 SMA at 164.43 sits just above — that is the macro ceiling on any extended recovery attempt.
**4. Key Support — Where the Volume Lives**
Below current price, the first meaningful level to watch is 136.30. That is the nearest support and the line I want to see hold on any pullback to keep the short-term recovery structure intact.
Below that, 129.67 is the VAL — the value area low from the volume profile — and 126.37 is the next support level. These two converge near the lower end of the range and represent the zone where volume-based demand has historically concentrated.
The POC at 133.48 sits between those two and is the single price level with the most volume traded in this range. That level tends to act as a magnet during pullbacks and a pivot on the way back up — worth watching closely if price starts to soften.
The recent pivot low of 122.68 is the last line of defense below everything else. A break and close below that level tells you the recovery is fully invalidated and the next leg lower has begun.
**5. Targets**
If price reclaims the daily moving averages and continues higher, the first meaningful target is 156.28 — the recent pivot high. A clean break of that level opens up the 161.45 to 162.40 zone, which also aligns with the weekly SMAs and VAH. That is where the real test of whether this is a genuine trend reversal or just a bounce would occur.
On the downside, a loss of 136.30 opens the path toward the POC at 133.48, then 129.67. A break below 126.37 puts the pivot low at 122.68 squarely in play.
**6. Indicator Confluence — Neither Side Has Conviction Yet**
The daily RSI at 48.59 is right in the middle of the range — not oversold, not overbought, not telling a strong story either way. The weekly RSI at 46.34 mirrors that reading and reinforces a lack of momentum in either direction. Neither number gives bulls or bears an edge here on its own.
The daily Stochastic RSI is where it gets a bit more interesting. The K line is at 72.07 and the D line is at 84.90, meaning K has crossed below D from elevated levels. That is a mild caution signal for short-term bulls — it suggests the near-term momentum push may be running out of steam. Not a full reversal signal on its own, but combined with price sitting directly under the daily SMA stack, it adds to the resistance case.
There is no bearish RSI divergence present on the daily timeframe, which means the downside case isn't being amplified by a technical divergence signal right now.
**7. Levels at a Glance**
Resistance / Upside (above price):
* 142.63 — Daily 21 SMA, immediate overhead level
* 144.35 — Daily 50 SMA, first daily resistance cluster
* 156.28 — Recent pivot high, first major upside target
* 156.55 — Weekly 21 SMA, macro resistance
* 157.99 — Weekly 50 SMA, the level that defines the bias
* 158.88 — VAH, volume-profile overhead supply
* 161.45 — Next resistance level in the upper band
* 162.40 — Upper resistance in the weekly SMA cluster
* 164.43 — Daily 200 SMA, macro ceiling
Support / Downside (below price):
* 136.30 — Nearest support, short-term structure pivot
* 133.48 — POC, high-volume level and magnet on pullbacks
* 129.67 — VAL, volume area low
* 126.37 — Next support level below the value area
* 122.68 — Recent pivot low, last structural defense
**Final Thoughts**
Bull case: PLTR reclaims and holds the daily 21 and 50 SMA — 142.63 and 144.35 — and builds from there. A sustained move through that zone puts 156.28 in sight, and if the stock can clear the weekly SMA cluster between 156.55 and 157.99, the bias shifts and a genuine recovery leg gets underway. That's the scenario bulls need to see unfold step by step.
Bear case: Price fails to hold the daily SMA stack and rolls over from this area. A loss of 136.30 puts the POC at 133.48 in play quickly, and a breakdown below the value area low at 129.67 reopens the move toward 122.68. The weekly bias remains bearish, the Stochastic RSI is showing early signs of fading momentum, and the resistance overhead is dense — that's the higher-probability narrative until price proves otherwise.
**Bottom Line**
PLTR is at a fork. The daily SMA stack just above current price is the first test — pass it with conviction or fail it, and the next move becomes clear. The weekly bias stays bearish until 157.99 is reclaimed and held.
No hype. No bias. Just levels.
Trade safe. Plan ahead. Win together.

Microsoft Corp. (MSFT): A Clear BreakoutAs of April 24, 2026, Microsoft (MSFT) stock is trading around $423-$424.62, showing a modest daily increase of over 2% despite recent volatility and a broader tech sector consolidation. the stock is recovering from a 52 week low of $356.28 set in March 2026, while analysts maintain a strong buy consensus with a significantly high long term fair value estimate.
Technical outlook:
The stock made an importance breakout around $420-$423 resistance levels, in respect of the structure. After a retest of breakout , price is slowly making a retracement upward. however we anticipate buy continuation.
Key points:
More bullish confirmation at this moment, activates buy position eyeing $470.08, as next potential bullish.
Thanks for reading.

GME(Update): When a meme meets a nine billion dollar cash pileGameStop is transforming from a video game king into a holding company led by Ryan Cohen, who runs the firm without a salary, without conference calls, and without outdated expectations. Everyone who has ever asked «What will Cohen do with 9 billion?» is now glued to the charts, because silence in the boardroom can only mean one thing – the calm before the loudest deal in retail history.
Fundamentals
The financial results have sealed GameStop's final metamorphosis. Quarterly revenue came in at 1.104 billion dollars - a 14 percent drop, but operating profit rose to 135.2 million, nearly double the year‑ago figure. For the full 2025 fiscal year, the company delivered 232.1 million in operating profit, completely reversing a 26.2 million loss from the previous year. This is no accident; it is the result of Cohen methodically closing unprofitable locations and cutting SG&A expenses to 910.2 million – almost 20 percent lower than last year. The crown jewel: 9.0 billion dollars in cash, equivalents and marketable securities – a massive leap from 4.8 billion a year ago.
Add the Bitcoin strategy. In May 2025, GameStop invested 500 million dollars into 4,710 BTC. Instead of letting the coins sit idle, Cohen moved 4,709 BTC to Coinbase Prime and sold covered call options with strikes between 105,000 and 110,000 dollars, turning digital gold into a yield‑generating asset. This is not just holding reserves – it is a bold move that transforms GameStop into a mini‑Strategy on steroids.
Risks: With this strategy, GameStop caps its upside from Bitcoin above 110,000 dollars. Shareholders face dilution risk because capital was raised through ATM offerings. The retail business continues to shrink.
Technicals
On the weekly chart, price has completed a full trend reversal. The descending trendline that had weighed on quotes for months has finally been broken, and the asset is entering the golden pocket – the zone where the fair value gap meets the 0.618–0.786 Fibonacci retracement, an ideal area for fresh accumulation. A golden cross of moving averages has already occurred, and the OTE zone is formed right now. Indicators confirm the bullish bias: ADX shows a developing trend, directional lines DI+ and DI– clearly signal buyer dominance, and MACD gives a clear buy signal. Weekly volumes remain steadily high, confirming the presence of large players.
Price closed Friday at 24.95 dollars. First target is 31.48, second is 34.70, third is 41.14, the key target is 53.53.
The market continues to value GameStop on a single metric: what Ryan Cohen will do with his nine billion dollar arsenal. The technical breakout is confirmed, the golden pocket is holding, and the targets are above.

NVDA - NVIDIA CorporationNVIDIA Corp engages in the design and manufacture of computer graphics processors, chipsets, and related multimedia software. It operates through the following segments: Graphics Processing Unit (GPU), Tegra Processor, and All Other. The GPU segment comprises of product brands, which aims specialized markets including GeForce for gamers; Quadro for designers; Tesla and DGX for AI data scientists and big data researchers; and GRID for cloud-based visual computing users. The Tegra Processor segment integrates an entire computer onto a single chip, and incorporates GPUs and multi-core CPUs to drive supercomputing for autonomous robots, drones, and cars, as well as for consoles and mobile gaming and entertainment devices. The All Other segment refers to the stock-based compensation expense, corporate infrastructure and support costs, acquisition-related costs, legal settlement costs, and other non-recurring charges. The company was founded by Jen Hsun Huang, Chris A. Malachowsky, and Curtis R. Priem in January 1993 and is headquartered in Santa Clara, CA.
