LINEAUSDT 12H#LINEA has been consolidating within a box on the 12-hour chart for several months and is currently testing the 12H SMA200. Keep an eye on it. In case of a breakout above the SMA200, the potential upside targets are:
🎯 $0.004328
🎯 $0.004775
🎯 $0.005222
🎯 $0.005858
🎯 $0.006669
⚠️ Always remember to use a tight stop-loss and maintain proper risk management.
Community ideas

Equal Highs Forming Distribution in BTCUSD in 2HI observed a transition from a bullish expansion into a ranging structure, where price initially pushed strongly upward and then began to move sideways, forming multiple equal highs and rejections near the same level. This behavior indicates the presence of supply, as buyers are unable to push price higher despite repeated attempts. The structure shows a loss of momentum after the bullish move, with price failing to create new highs and instead forming a distribution-like phase.
Within this range, price recently created a rejection from the upper boundary and started to rotate downward. The move down appears impulsive compared to the previous sideways action, suggesting that sellers are beginning to gain short-term control. The highlighted zone below represents a demand area that previously acted as a base for the upward move, making it a key level for potential reaction.
Currently, price is moving toward this demand zone after rejecting from the supply area, indicating a shift from range highs toward range lows.
Speculative Outlook:
Price is now approaching a key demand zone, which acts as a critical decision area. If this zone holds, the market may react upward, potentially continuing the range or forming a higher low.
There is also a possibility of a liquidity sweep below the demand zone, where price briefly dips lower, takes out stops, and then reverses upward.
However, if price breaks below this demand zone with strong bearish momentum, it would confirm a shift from range to bearish expansion and open the path for further downside. This makes the current area a key decision point between a bounce or continuation lower.

BTC: Waiting For The Price To Exceed 79420BTC: Waiting For The Price To Exceed 79420
BTC has been moving in a clear uptrend for about 1 month since it reached 65K.
The price tested 65K on March 29, 2026 and since then BTC has been slowly rising showing clear bullish accumulations.
For the price to rise further, BTC needs to move above the new pattern or above 79420.
Only if it moves above 79420 will the new impulse wave start again.
Main Targets:
82600
86000
You can find more details on the chart.
Thank you and good luck! 🍀
⚠️PS: Do your own analysis and use your own strategy to join the trade.
❤️ If this analysis helps your trading day, please support it with a like or comment ❤️

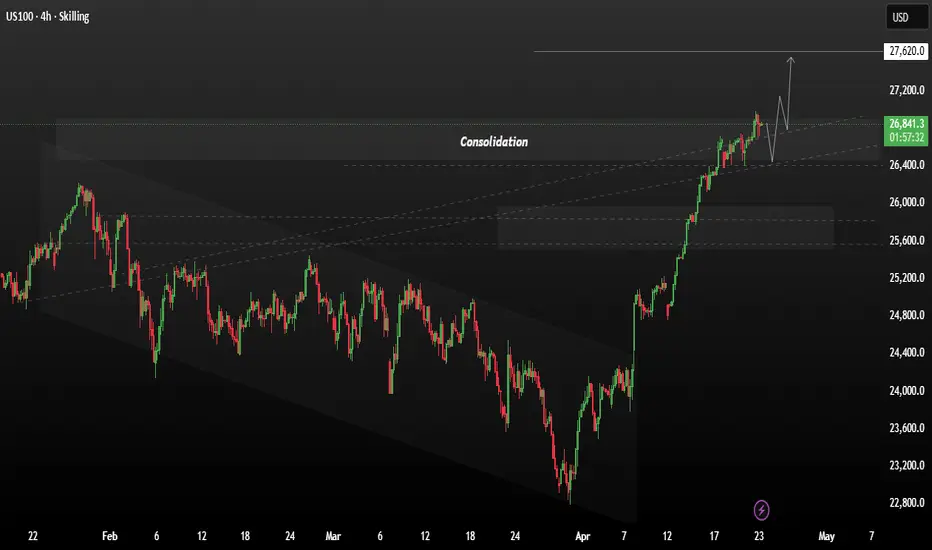
US100 Balanced Structure: Next Move Depends on BreakUS100 is currently showing a strong bullish trend, backed by both technical structure and fundamental strength.
Furthermore, improving geopolitical conditions and reduced global uncertainty are creating a risk-on environment, encouraging investors to move into equities. Institutional buying and consistent capital inflows are also adding strength to the trend, while seasonal momentum during this period is supporting continued upside pressure.
At the same time, the bullish movement is strongly supported by key market drivers. The Nasdaq continues to benefit from strong corporate earnings, especially from major tech companies, which is increasing investor confidence. In addition, the ongoing AI-driven growth is pushing tech stocks higher, making US100 one of the strongest-performing indices.
Tecnically the market has successfully broken out of a prolonged bearish channel, confirming a clear shift in momentum. After the breakout, price delivered a strong impulsive move upward, forming higher highs and higher lows a classic bullish structure at the moment, price is consolidating between 26,400 – 26,900, which indicates a healthy pause after the rally. This consolidation is acting as an accumulation phase, suggesting the market is preparing for the next move higher rather than reversing.
You may find more details in the chart,
Trade wisely best of luck buddies.
Ps; Support with like and comments for better analysis Thanks for Supporting.
Gold 30Min Engaged ( Bullish & Bearish Reversal Detected )HANZO MARKET LIQUIDITY REPORT
Gold
Timeframe: 30min (Volume Basis)
Scale: Higher Timeframe Context / Deep Volume analysis
━━━━━━━━━━━━━━━━━━━━━━
Market Observation
This analysis is focusing on structural behavior, liquidity zones, Volume analysis
and key areas of interest within the current range.
━━━━━━━━━━━━━━━━━━━━━━
Market Bias
Full liquidity Map
━━━━━━━━━━━━━━━━━━━━━━
🔥Bullish Reversal
Key Volume Zone : 4680 Area
🔥Bullish Reversal
Key Volume Zone : 4700
🔥Bearish Reversal
Key Volume Zone : 4725 Area
━━━━━━━━━━━━━━━━━━━━━━
5 reasons / For Bullish Reversal
Discount location: 4680 is positioned as a “buy-the-dip” area relative to current 4704, aligning with 1D bullish compression (accumulation-type behavior).
Liquidity logic: A push lower into 4680 is consistent with a sellside liquidity sweep before a rebound (common during compression).
alignment: 1H reversal supports the idea of a short-term turn after a dip; we’re waiting for price to come to the level.
Mean-reversion target: TP 4720 targets a return to the upper dealing area without requiring a full breakout (higher hit-rate in ranges).
━━━━━━━━━━━━━━━━━━━━━━
5 reasons / For Bearish Reversal
Premium location: 4725 is a “sell-the-pop” area above current price, fitting the 4H bearish reversal (supply overhead).
Buyside liquidity magnet: Moves into the 4720–4725 area often tag stops above recent highs before rotating (buyside liquidity grab).
alignment: With 4H reversal, rallies are more likely to be sold until 4H structure flips back bullish.
Rotation target: TP 4690 aims for a pullback into the range/acceptance zone, consistent with compression behavior.
━━━━━━━━━━━━━━━━━━━━━━
Structure Factors:
• Higher timeframe Volume reaction level
• High-volume / Hidden
• Range Defend structure
• Volume Stacking
• Quarter Volume
• Fibo Defend Volume

Godwin Emamuzo Mark Higher high and lower high, lower high and lower low, break of structure, change of character, QML, session highs and lows.

BullishAfter the liquidity sweep there was a mss meaning a change in direction then a break of structure to confirm Bullish sentiment. It's going to pull back past the inducement level to buy for a long time

EURUSD TRADE SETUPWait for retest the entry level and bullish momentum then take a trade for Buy otherwise skip this setup

EUR/USD: Both ECB and Fed will talk, markets will listenThe previous week started with Retail Sales figures in the US. In March this indicator was increased by 1,7% m/m, above market estimates of 1,1%. On a yearly basis, retail sales increased by 4%, highly above estimated 2,4% y/y. The S&P Global Composite PMI flash for April was standing at 52,0, modestly above forecasted 49,9. Friday brought the University of Michigan Consumer Sentiment final for April of 49,8, just a bit above expected 47,6. The five year inflation expectations were modestly increased to 3,5% from previous 3,2%.
The Producers Price Index in Germany in March was increased by 2,5% for the month, but still holding a negative territory for the year of -0,2%. Figures were above market forecasts of 0,8% m/m and -0,2% y/y. The ZEW Economic Sentiment Index in the Euro Zone in April was standing at -20,4, while in Germany it reached -17,2. Both indicators were lower from market estimates. The S&P Global Manufacturing PMI flash for April in Germany was at the level of 51,2, and in line with market expectations. The same indicator for the Euro Zone reached 52,2. The Ifo Business Climate in April in Germany was at the level of 84,4 just a bit lower from estimated 85,4.
The previous week was a relatively calm one on the currency side. The EUR/USD currency pair was moving in a relatively shorter range, where EU currency continued to be modestly pressured. On the opposite side, the US currency was under a short relief related to expected positive developments in the Strait of Hormuz and dropping prices of oil. The week started with a rejection of the 1,18 resistance line, and moved toward the lowest weekly level at 1,1670 which was also rejected on Friday. Weekly closing price was 1,1722. The RSI modestly dropped to the 51, however, closed the week at the level of 53. Investors are still perceiving the overbought market side, rather than the opposite one. The MA50 crossed the MA200 and continued to move below it, indicating a potential trend change in the coming period.
The previous week was a relatively calmer one, but the week ahead promises to bring increased volatility. A lot of important macro data will be released for both US and EU, and most importantly, both ECB and Fed will decide on interest rates. Wednesday and Thursday will be extremely sensitive days, where central bankers will talk and the market will listen and adjust their positions according to expectations on future macro developments. Current charts are pointing to an equal probability for moves toward both sides. A move toward the upside will push eur/usd to test 1,18, the next resistance level. On the opposite side, in case that 1,1670 is broken down, then levels to watch will be 1,1640 down to 1,16 support line.
Important news to watch during the week ahead are:
EUR: GfK Consumer Confidence for May in Germany, Economic Sentiment in April in the Euro Zone, preliminary inflation rate in Germany in April, Retail Sales in March in Germany, Unemployment rate in April in Germany, GDP Growth rate flash for Q1 in Germany and the Euro Zone, Inflation rate in the Euro Zone flash for April, Unemployment rate in the Euro Zone in March, ECB meeting and interest rate decision for euro will be held on Thursday, April 30th.,
USD: Building Permits preliminary in March, Durable Goods Orders in March, Housing Starts in March, FOMC meeting and interest rate decision will be held on Wednesday, April 29th, PCE Price Index in March, Personal Income and Personal Spending in March, ISM Manufacturing PMI in April.

Gold (1H) chart...Gold (1H) chart:
Clear descending trendline → bearish structure
Price around 4708
Lower highs forming → selling pressure still active
🎯 Targets
Target 1 (near support): 4680
Target 2 (strong level): 4650
Target 3 (extended move): 4600 – 4580
🔴 Resistance (important)
4725 – 4750 (trendline area)
If price breaks and holds above 4750, my sell idea becomes weak
My view
My marked deep target (very low level on image) is too far for now. Gold usually moves step-by-step, so expect reactions at 4680 and 4650 first before any bigger drop.

Bitcoin Market Structure Shift – From Bearish to BullishBitcoin is transitioning from a bearish trend into a bullish structure after breaking key resistance.
Holding above current levels strengthens the bullish case.
A sustained move could push BTC toward 100K psychological level, then extend toward 115K–126K.
Key Levels:
Support: 70K – 72K
Mid Target: 97,466
Major Targets: 115,926 → 126,241
Not Financial Advice

BTCUSD - Adaptive Regression ViewThis chart is built with two tools: Adaptive Trend Channel and Adaptive Projection.
The goal is to avoid subjective trendlines and let regression channels identify the most relevant trend structure across multiple horizons.
Current BTC structure:
- Very long-term: still upward, but price remains below the channel.
- Long-term: still downward, with price testing the upper side.
- Short-term: strongly bullish, showing a clear recovery impulse.
The interesting part is the conflict between timeframes. BTC has a bullish short-term push, but it still needs to break the larger declining structure to confirm a stronger recovery.
The Adaptive Projection blends these regimes and currently projects a constructive path with +15.4% annualized line return.
To me, this looks like a transition phase: bullish locally, not fully confirmed structurally.

THE KOG REPORT - UpdateEnd of day update from us here at KOG:
Not a bad start to the week. We had the indication of the gap down in Camelot which completed on the open. Price played the hot spots, rejected and came down into the defence level which is where we are being held at the moment.
For now, we'll stick with the plan, but there is a support level right here where an undercut low can give us a bounce during the session to come. 4655 support, needs to hold for a push upside, while 4690 is resistance on the flip.
As always, trade safe.
KOG

Liquidity Grab Below Support Could Trigger Massive Bull RunGold is approaching a strong support zone near 4285, where a potential liquidity sweep may occur.
A short-term dip into this area could trap sellers before a strong bullish reversal.
If price holds, the next upside targets remain 4989, followed by 5596 and 5844.
Key Levels:
Support: 4285
Targets: 4989 → 5596 → 5844
Not Financial Advice

Why I Stopped Building Indicators and Started Building AgentsMost automated trading systems are built like single-purpose machines: one strategy, one set of rules, one set of conditions to meet. They work until the regime they were built for ends, and then they don't.
The interesting question isn't how to make a single strategy more robust. It's whether robustness is the right goal at all — or whether it's better to build systems where individual components can stay narrow, and the coordination between them is where the durability lives.
That reframing changes a lot of things.
It changes how you think about risk. A risk layer that's tangled up with strategy logic has to be reasoned about every time the strategy changes. A risk layer that's a peer to the strategy — making decisions about whether any strategy gets to fire — is a different kind of system. Cleaner to maintain. Harder to bypass accidentally.
It changes how you think about context. Market context — regime, news, calendar, session phase — isn't a feature you bolt onto a strategy. It's its own concern, with its own logic, that informs strategies without being inside them. When context lives in its own layer, every strategy gets it for free, and you can update how context is generated without touching trade execution.
It changes how you think about review. When the parts of a system are loosely coupled and each part's reasoning is logged separately, you stop debugging a black box and start having something closer to a conversation with your own automation. That's a different relationship to the work.
None of this requires the most expensive AI tooling, or the latest model, or any particular framework. It requires being willing to slow down and define what each part of the system is responsible for — and then resisting the temptation to let the parts bleed into each other.
The hardest part hasn't been the trading logic. It's been the architecture: deciding which decisions belong to which layer, and what happens when they disagree.
More on this as the work matures.
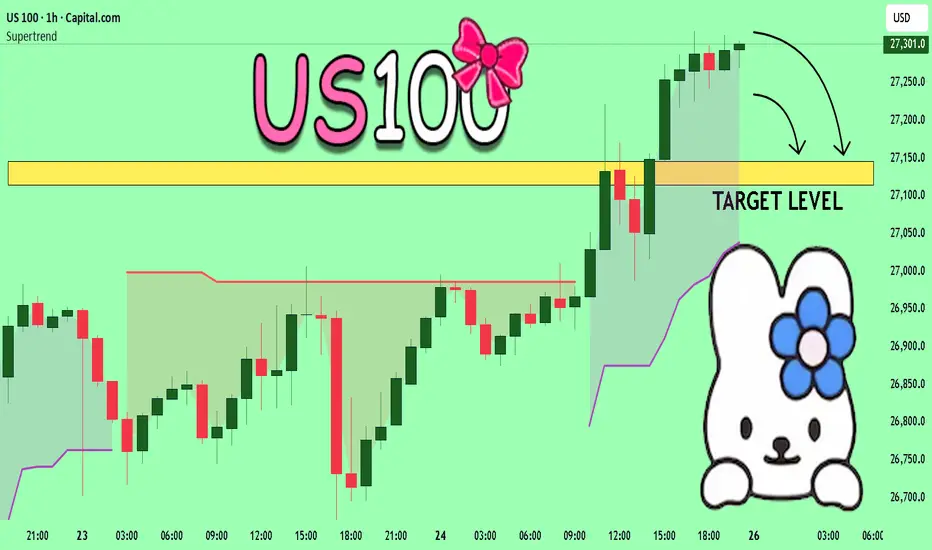
US100 Massive Short! SELL!
My dear friends,
My technical analysis for US100 is below:
The market is trading on 27301 pivot level.
Bias - Bearish
Technical Indicators: Both Super Trend & Pivot HL indicate a highly probable Bearish continuation.
Target - 27145
About Used Indicators:
A pivot point is a technical analysis indicator, or calculations, used to determine the overall trend of the market over different time frames.
Disclosure: I am part of Trade Nation's Influencer program and receive a monthly fee for using their TradingView charts in my analysis.
———————————
WISH YOU ALL LUCK
(Silver 1H) Target...(Silver 1H) Target.
Price is respecting a descending trendline (bearish structure)
Lower highs + weak bounces → sellers in control
Current price ~ 75.65
Key Targets 👇
🎯 Target 1 (near support): 74.00
🎯 Target 2 (strong support zone): 72.00
🎯 Target 3 (my marked level): 63.50 – 64.00
Important Levels
Resistance: 76.80 – 77.50 (trendline area)
Break above 77.50 = bearish idea weak
My View
Short bias is valid only if price stays below trendline.
My 63.5 target is possible, but that’s a swing target, not immediate — price will likely pause at 74 and 72 first.

Liquidity Sweep Potential at Range Lows in XAUUSDI observed a clear range structure where price has been moving between well-defined highs and lows, showing repeated rejections from both ends of the range. Within this structure, the market failed to break above the upper boundary and instead formed a series of lower highs, indicating weakening bullish momentum. This shift suggests that sellers have gradually taken control after the inability to continue upward.
As price moved away from the range high, it formed a steady bearish leg with controlled movement, rather than a sharp impulsive drop. This indicates a structured move lower, targeting liquidity below the range. The recent price action shows continuation toward the lower boundary, where a key demand zone is positioned.
Currently, price is approaching this demand zone after completing a move from the range high, indicating a typical range rotation from supply to demand.
Speculative Outlook:
Price is now nearing a key demand zone, which acts as a critical reaction area. If this zone holds, the market may bounce back upward, continuing the range behavior.
There is also a possibility of a liquidity sweep below the demand zone, where price briefly dips lower, takes out stops, and then reverses upward.
However, if price breaks below this zone with strong bearish momentum, it would signal a range breakdown and open the path for further downside. This makes the current area a key decision point between a potential bounce or continuation of the bearish move.

Still Buying Gold? 4,780 Might Wipe You OutThat move into the highs wasn’t strength, it was a setup. The market ran liquidity into the top, printed a clean distribution, then flipped structure with a sharp CHoCH. Since then, price hasn’t looked bullish at all… just controlled selling inside a descending range.
What stands out is how every push up gets capped. No real continuation, just slow grinding moves that keep trapping late buyers. That’s usually not accumulation, that’s distribution playing out on a lower timeframe.
The zone I’m watching is 4,760–4,780. That’s where the last supply sits and also the top of the current range. If price pushes back into that area, sweeps some buy-side liquidity, and fails to hold, I’m looking for shorts. Ideally, I want to see a rejection or some form of trap before entry, not chasing in the middle.
Below, the liquidity is obvious. Range low around 4,660 is the first target, but realistically, once that gets hit, sell-side liquidity under it is likely getting cleared too.
Only thing that breaks this idea is if price starts accepting above 4,780 with strong H1 closes. If that happens, the whole structure shifts again and I step aside.
Right now it just looks like a classic trap at the highs before continuation down.
You fading the highs here or waiting for confirmation?

HBAR more gain expected 20% toward 0.11$HI
after huge correction to the downside now some green candlesticks for continuing the process or reverse is logical i can see at least 20% gain toward 0.11$ for HBAR

FRAXUSDT Forming Bullish MomentumFRAXUSDT is currently forming a clear bullish momentum pattern, a classic wave structure that often signals an upcoming breakout. The price has been consolidating within a narrowing range, indicating that selling pressure is gradually weakening while buyers are beginning to regain control. With consistent volume supporting accumulation at lower levels, the setup suggests a strong possibility of a bullish breakout in the near term.
If the price breaks above the wedge resistance, the projected move could be highly significant, with a potential gain of around 190% to 200%. This type of bullish momentum pattern is typically seen at the end of downtrends or corrective phases, signaling a potential shift in market sentiment from bearish to bullish.
Traders closely monitoring FRAXUSDT are observing strengthening momentum as it approaches a key breakout zone. The presence of solid trading volume adds confidence to this setup, indicating that market participants may already be positioning themselves ahead of a possible reversal.
Growing investor interest in FRAXUSDT reflects increasing confidence in its technical structure and broader potential. If the breakout is confirmed with strong and sustained volume, it could mark the beginning of a powerful bullish leg. This setup may present an attractive opportunity for medium-term traders as momentum builds and the pattern completes.
✅ Show your support by hitting the like button
✅ Leave a comment below (What is your opinion about this coin?)
Your feedback and engagement keep me motivated to share more insightful market analysis with you!

gold bullgold bull gold 18 month to 36 month gold up tohttps://www.thestreet.com/investing/j-p-morgan-drops-blunt-reality-check-on-gold-price-surge www.globalbankingandfinance.com She reiterated a long-term target of $6,000/oz by 2028, stressing that gold should be viewed on a multi-year horizon.
NeoWaveMaster
www.mmtcpamp.com
NeoWaveMaster
www.gold.org and Turkey. Some sell gold, but not much bigger. If Russia sold around 10-9% 8-9% and other countries less than 2% to sell gold, not much higher amount for gold sell for central bank to sell gold January 30. After that, golds are *Data to 30 January 2026, where available. www.gold.org www.mining.com 6335

SHIB/USDT: Day-Swing Setup | Entry, TP & SL Mapped🐕🦺🔥 SHIB/USDT — "SHIBA INU vs. TETHER" 💵
🎯 CRYPTO MARKET PROFIT PATHWAY SETUP | Day Trade / Swing Trade
"The Thief never enters the market blindly — we stalk the setup, then strike with precision." 🦅
🗺️ THE THIEF'S MASTER PLAN — BULLISH PATHWAY 📈
Direction: 🟢 BULLISH (Conditional — Awaiting Resistance Breakout)
⏳ Waiting For Resistance Breakout @ 0.0000064
The Thief's intelligence team has identified a critical breakout level at 0.0000064 USDT. Price must close convincingly above this zone on meaningful volume before any entry is considered valid. No breakout = no entry. We are disciplined operators, not gamblers. 🎯
🚀 ENTRY STRATEGY
🔰 Entry Trigger: Any price level after a confirmed, clean breakout above 0.0000064 USDT
🔰 Entry Method: Wait for candle close above resistance → confirm volume surge → enter on the retest or breakout momentum
🔰 No pre-entry. No FOMO. Patience is the sharpest weapon in the Thief's arsenal. 🗡️
🎯 PROFIT TARGETS — THE ESCAPE ROUTE
📍 Target 1 (T1): 0.0000072 USDT
📍 Target 2 (T2): 0.0000080 USDT
⚠️ Police Force Zone Warning: The price area above T1 acts as a strong resistance cluster — historically loaded with overbought conditions, institutional traps, and sharp reversal triggers. This is where the market police set their ambush. Smart Thieves book profits here and don't get greedy. 👮♂️🚨
💬 "Dear Ladies & Gentlemen — Thief OG's — I am NOT recommending you fix only my TP levels. Your profit strategy is your own choice. Make money, then TAKE money. That is the Thief's Golden Rule. Trade at your own risk, always." 🤝
🛑 STOP LOSS — THE THIEF'S ESCAPE HATCH
🔴 Thief SL: 0.0000058 USDT
Positioned below the key multi-year accumulation floor to protect capital against false breakouts and sudden market-maker sweeps. A stop loss is not weakness — it is the Thief's armour. 🛡️
💬 "Dear Ladies & Gentlemen — Thief OG's — I am NOT recommending you use only my SL level. Capital management is a personal discipline. Make money, then protect money. Your risk, your rules." 💼
🔗 RELATED PAIRS TO WATCH — CORRELATION DASHBOARD 🌐
Keep your eyes on these correlated and momentum-driven pairs to gauge broader market direction:
🔸 DOGE/USDT — The original meme coin godfather. When DOGE pumps, retail FOMO floods SHIB hard. High direct positive correlation. DOGE longs are currently sitting at 70% on Binance futures Spoted Crypto, signalling retail bullish bias in the meme sector.
🔸 PEPE/USDT — The newer meme rival. In April 2026, PEPE has dropped more than 80% from its peak while SHIB has fallen below key support levels Gate.com — both are consolidating simultaneously. A PEPE recovery often ignites a SHIB sympathy rally.
🔸 ETH/USDT — The mother chain. SHIB is an ERC-20 token — Ethereum gas costs, network congestion, and ETH price sentiment directly impact SHIB on-chain activity and ShibaSwap volume. ETH recovery = SHIB tailwind.
🔸 BTC/USDT — The macro king. BTC dominance sits at 58.1% with global crypto market cap holding at $2.68 trillion Spoted Crypto. When BTC breaks above $80,000 decisively, altcoin and meme coin liquidity rotates aggressively. Watch BTC closely.
🔸 BONE/USDT — The Shiba ecosystem governance token. BONE is SHIB's ecosystem partner powering ShibaSwap and Shibarium transaction fees. Strength in BONE = on-chain ecosystem activity = supportive for SHIB.
🔸 LEASH/USDT — The scarcity token within the Shiba ecosystem. Works as a market sentiment signal for the broader SHIB army community confidence.
📰 REAL-TIME FUNDAMENTALS & ECONOMICS FACTORS 🌍💹
The following reflects what the actual market data and verified recent developments are showing — presented neutrally, not biased toward this trade setup.
🔥 SHIB BURN MECHANICS — SUPPLY CONTRACTION
The SHIB burn rate surged 237% on April 13, retiring millions of tokens in a single session, while Shibarium Layer-2 crossed 1 billion total transactions and 175 million unique wallet addresses.
As of recent data, the project has systematically removed 410 trillion SHIB tokens from circulation — representing 41% of its original one-quadrillion-token supply — through over 20,000 individual burn transactions. BTCC However, burns are a positive long-term narrative but mathematically insignificant at current rates — it would take decades to materially impact the multi-trillion supply.
🏛️ SHIBARIUM LAYER-2 — TECHNOLOGY CATALYST
The core development team is preparing a major upgrade to the Shibarium Layer-2 network, scheduled for Q2 2026, integrating Fully Homomorphic Encryption (FHE) in collaboration with cryptography firm Zama. This upgrade aims to transform Shibarium into a privacy-focused network targeting enhanced utility for gaming, DeFi, and token burn mechanisms.
🗾 RAKUTEN & JAPAN LISTING — REGULATORY CREDIBILITY
Rakuten Wallet listed SHIB in Japan on April 7, 2026, with the Japanese fintech giant's integration providing new liquidity and regulatory credibility.
Additionally, Japan's JVCEA added SHIB to its Green List alongside Bitcoin and Ethereum, easing domestic exchange listings, and the SEC and CFTC joint framework in March 2026 classified SHIB as a digital commodity.
🐋 WHALE ACCUMULATION vs. SELL PRESSURE — MIXED SIGNALS
A massive $505 billion SHIB left exchanges on April 21, 2026 — one of the largest outflow events this month — signalling possible whale accumulation.
However, declining open interest and a sustained pattern of lower highs suggest that selling pressure has not yet fully dissipated.
🏛️ US GOVERNMENT SHIB HOLDINGS — INSTITUTIONAL SPOTLIGHT
The U.S. Marshals Service now holds 54 billion SHIB, underscoring its growing presence in the institutional digital asset sphere.
📉 MACRO CRYPTO SENTIMENT — FEAR ENVIRONMENT
The broader crypto Fear & Greed Index reads 29 (Fear) as of late April 2026, with SHIB up 4% over the past seven days — modest but positive in this cautious climate. Bitcoin ETF inflows hit $2 billion over 8 days ending April 24, 2026, with U.S. spot Bitcoin ETFs recording $223.21 million in net inflows on April 23 alone — marking eight consecutive days of positive flows.
📊 BITCOIN MACRO SETUP — THE BIG BROTHER FACTOR
BTC broke above $77,000 on April 17, 2026 for the first time since February, with a single-session short liquidation event flushing over $209 million in bearish positions, adding structural buying pressure.
The broader macro crypto picture remains cautiously constructive. The uptick is primarily driven by regulatory optimism and institutional momentum, with the Fear & Greed Index starting to recover from recent lows, though negative funding rates indicate many traders remain cautious.
⚖️ COMPETITION RISK — MEME COIN FRAGMENTATION
SHIB faces intensifying competition from a growing field of rival meme coins, and adoption metrics remain modest relative to the token's market capitalisation.
The meme coin space is crowded — narrative rotation is fast and ruthless.
🌐 ETF INCLUSION PIPELINE — UPCOMING CATALYST
Inclusion in proposed institutional ETF filings is among the most closely watched upcoming catalysts for SHIB in 2026. If confirmed, this would represent a structural shift from retail-only participation to institutional market access.
⚙️ TECHNICAL CONTEXT — WHAT THE CHART IS SAYING
🔸 SHIB reached its lowest price of 0.00000508 USD on February 6, 2026 establishing a major cycle support floor.
🔸 Analysts are closely watching for a clean breakout above $0.00000612 resistance to confirm a shift, while on-chain data shows whales may be accumulating at these lower levels. Watch for a sustained increase in trading volume to validate any breakout attempt.
🔸 The technical picture does not support a breakout today — but the $0.0000087 resistance level is the line to watch. A daily close above it, backed by volume, changes the near-term narrative.
🔸 RSI and momentum indicators remain in neutral-to-cautious territory — no clean directional bias confirmed yet.
🧠 THIEF TRADING COMMANDMENTS
🔑 Never enter before the breakout is confirmed
🔑 Volume must support the move — no volume = no validity
🔑 Always manage your own risk — this is YOUR money
🔑 Partial exits at T1 secure profits while leaving runners for T2
🔑 Never average down into a losing meme coin trade
🔑 The market is a battlefield — only the disciplined survive
⚠️ RISK DISCLOSURE
This idea is for educational and analytical purposes only. Meme coin markets are extremely volatile and sentiment-driven. Always conduct your own research (DYOR). Past setups do not guarantee future results. Trade responsibly. 💼
🐾 Stay sharp. Stay patient. The Thief always waits for the perfect moment.
💜 Boost 🚀 | Follow 👁️ | Comment 💬 — Help the Thief Army grow!
