Gold Remain Range-Bound Amid Inflation and Policy UncertaintyOn Monday morning in Asia, gold prices fell under pressure, dropping to a low of around $4672 before rebounding. Four consecutive positive days have now been recorded, suggesting a potential bottoming out and rebound. Recently, despite continued tensions in the Middle East, gold has failed to find significant support and has instead fallen under the influence of macroeconomic factors, indicating that the current market pricing logic has shifted from simple safe-haven demand to a rebalancing of interest rates and inflation expectations.
From a news perspective, the US has suspended related diplomatic visits, while Iran has clearly stated that it will not negotiate under pressure or blockade, indicating that the situation is unlikely to ease in the short term. Meanwhile, Israel has intensified its military operations in Lebanon, further escalating regional tensions. These events have driven volatility in the energy market, with crude oil prices remaining high, reinforcing market concerns about a rebound in inflation.
Logically, rising oil prices often push up overall inflation levels through energy cost transmission, and rising inflation expectations directly affect the path of monetary policy. The market widely expects the Federal Reserve to keep interest rates unchanged at this week's policy meeting. This expectation of persistently high interest rates significantly weakens gold's appeal as a non-interest-bearing asset. In a high-interest-rate environment, funds tend to flow into assets with yield-generating properties, thus putting downward pressure on gold.
Meanwhile, although gold possesses safe-haven attributes, at this stage, the market's focus is significantly higher on the duration of high interest rates than on geopolitical risks themselves. This means that even with heightened tensions, gold's upside potential remains limited. Investors are more focused on the statements made by Fed officials at the post-meeting press conference, especially how they assess the impact of rising energy prices on the inflation path and whether they will adjust future policy expectations.
Market sentiment is currently somewhat divided. On the one hand, geopolitical risks provide a floor for gold; on the other hand, rising interest rate expectations create upward pressure, keeping gold prices in a generally weak and volatile pattern. Funds are repeatedly switching between these two logics, leading to increased price volatility but an unclear trend.
From a technical perspective, on the daily chart, gold prices have entered a correction phase after breaking below the short-term upward trend line, currently trading within a consolidation range. Key support lies around $4650-60; a break below this level could lead to a further test of the $4600 mark. Resistance is concentrated in the $4720-$4750 area. Momentum-wise, bearish forces are gradually strengthening, limiting the potential for short-term rebounds. The 4-hour chart shows a downward-trending structure with short-term moving averages diverging downwards, indicating a predominantly bearish sentiment. However, a sudden risk event could trigger a rapid short-term rebound.
In summary, the core contradiction in the current gold market lies in the interplay between "safe-haven demand" and the "high-interest-rate environment." While the Middle East situation provides some support for gold, rising inflation expectations and persistently high interest rates significantly weaken its appeal, putting overall pressure on gold prices. In the short term, the Federal Reserve's policy signals will be the dominant factor. A hawkish stance could lead to further weakness in gold; conversely, a more moderate stance on inflation risks could present a short-term rebound opportunity. The medium-term trend still needs to focus on the inflation path and the inflection point of interest rates.
Community ideas

New Week Opening GapIn theory, the new week opening gap is a very high probability confluence and has a big impact on sunday asia open; in my current trade' i'll test this

Scalping XAU - Selling pressure below 4700📈 1. Trend : Structure
Looking at the chart:
After the previous decline, price has started forming higher lows, signaling a short-term recovery.
However, the upside remains capped by a strong horizontal resistance + EMA, keeping price contained.
Current structure:
→ Tight range / sideways, with a slight bearish bias
👉 Key observation:
Price is trading between:
An ascending trendline below (dynamic support)
A horizontal resistance zone above (~4,710 – 4,720)
→ This reflects a range + mild compression setup, often preceding a breakout.
📰 2. News Impact
Gold (XAU/USD) is struggling to extend its modest intraday gains but is holding above the $4,700 level during the European session.
Reports suggest Iran has proposed reopening the Strait of Hormuz and easing tensions with the US
Nuclear negotiations are postponed, but peace expectations are improving
👉 Market implication:
Improved geopolitical outlook can reduce safe-haven demand
However, it may also weigh on the USD, indirectly supporting gold
→ Overall: Mixed fundamental backdrop, but slightly supportive for gold in the short term
📊 3. Key Levels
🔴 Resistance: 4,710 – 4,725
👉 Strategy:
→ If price revisits this zone and shows weakness
→ Look for short-term SELL opportunities
🔵 Support: 4,680 – 4,660
4. signal
🔴 SELL GOLD zone : 4709 - 4712
sl: 4717
TP: 4682 - 4660 - 4630

XAUUSD NEXT MOVE (READ CAPTION)Hi trader's what do you think about gold
Gold is currently trading in a bullish market structure, supported by consistent buying pressure at key demand zones. The trend remains upward, and short-term pullbacks are being treated as opportunities to enter in the direction of the trend.
🟢 Support Zone: 4,676 – 4,662
This zone is acting as a strong bullish demand area. As long as price holds above this range, the bullish momentum remains intact and buyers are likely to stay in control.
🔴 Resistance Zone: 4,730
The 4,730 level is the nearest resistance where price may face temporary rejection or consolidation before the next move.
🔴 Supply Zone: 4,766
The 4,766 level is a major supply and distribution zone. This area could act as the primary upside target if bullish momentum continues, where selling pressure may appear.
📈 Market Bias
Above 4,676 – 4,662 → Bullish continuation likely
Pullbacks toward support → Buy-on-dips opportunity
Break above 4,730 → Opens path toward 4,766 supply zone
Break below 4,662 → Bullish setup invalidated
Overall, Gold favors a buy-on-dips strategy while price remains above key support zones
please like comment and follow thank you

Gold Recovers on Geopolitical Signals, Awaiting a Breakout📊 Market Developments:
Global gold prices are seeing a slight recovery (+0.16%) following reports regarding Iran's proposal, which helped ease previous sell-off pressure. Market sentiment is currently Neutral as investors await new economic data to determine a clearer trend.
📉 Technical Analysis:
- Key Resistance: 4,760 USD and 4,785 USD.
- Nearest Support: 4,700 USD and 4,647 USD.
- EMA: Price is hovering around 4,717 USD, right at the EMA 09 (4,717.9). This indicates a sideways short-term trend; a clear candle close above or below this line is needed for confirmation.
Candlestick/Volume/Momentum: RSI 14 is at 53.79, showing a balance between buying and selling. The chart indicates price accumulation in a narrow range after a correction.
📌 Outlook:
Gold may continue to recover toward 4,760 USD in the short term if the 4,700 USD psychological support holds and geopolitical reports remain positive.
💡 Trading Strategy:
🔻 SELL XAU/USD: 4,758 – 4,762
🎯 TP: 40/80/200/300 pips
❌ SL: 4,765 USD
🔺 BUY XAU/USD: 4,700 – 4,705
🎯 TP: 40/80/200/300 pips
❌ SL: 4,697 USD

ATOMUSDT: WCL Retest Before The Next Bullish Expansion?OKX:ATOMUSDT is showing an interesting continuation structure on the 4H chart.
After building a bullish ABC sequence from the April low, price expanded strongly into the blue ABC target zone and swept the external liquidity sitting above the previous high. That move was not random. It completed the first bullish objective and forced late buyers into the market near the top of the local expansion.
Now the important part is the reaction after the target.
Price is currently pulling back from the blue C area, and the cleanest bullish scenario would be a deeper retracement into the blue WCL zone. This area also lines up with internal liquidity, which makes it a logical reload zone if buyers are still in control.
The setup is simple:
Price already reached the first bullish target.
External liquidity has been taken.
Now price may need to rebalance lower into internal liquidity.
If the WCL holds, the next logical expansion target becomes the higher green ABC target around the 2.10–2.19 area.
I am not interested in chasing price in the middle of the range. The better trade location is lower, inside the WCL, where risk can be defined cleaner and buyers have a reason to step back in.
The key confirmation for me would be a bullish reaction from the WCL, ideally with a liquidity sweep, displacement, and a 4H or lower-timeframe market structure shift. Without confirmation, the zone is just a zone.
Invalidation would come if price accepts below the WCL with bearish displacement, because that would weaken the bullish continuation idea and suggest the market is not ready for the higher C target yet.
For now, ATOM is in a “pullback before continuation” structure — not a blind buy, not a prediction, just a mapped sequence with clear liquidity logic.
Main idea:
Let price come back into value. Let the WCL prove itself. Then look for continuation toward the higher C target.
Not financial advice. This is only my personal market analysis and trading framework.

XAUUSD Rejection From Major Resistance – Rising Support Under PrGold is currently reacting from a well-defined horizontal resistance zone that has already produced multiple rejections. Price tapped this area again and sellers stepped in, forming another lower high. At the same time, the market is holding above a rising trendline support, creating a tightening structure between resistance and ascending support.
This type of compression often leads to a decisive move. As long as price remains below the highlighted resistance zone, downside pressure may continue toward the trendline support. A clean break below the rising support could open the path for further bearish continuation. On the other hand, a strong breakout and acceptance above resistance would invalidate the bearish bias and shift momentum upward.
Key Levels
Resistance Zone: 4,860 – 4,900
Intraday Supply: 4,770 area
Rising Support: Trendline below current price
Bearish Trigger: Break and close below trendline
Bullish Trigger: Strong breakout above resistance
Scenario
Rejection from resistance → continuation lower
Range compression → volatility expansion soon
Liquidity resting below recent lows
Note:
This analysis is for educational purposes only and reflects price structure, not financial advice. Always wait for confirmation and manage risk properly.

XAUUSD weekly (27.04-01.05)Market Formation:
After the cessation of the "hot" phase in the Middle East, gold entered a wide consolidation range of 4670–4800. Within this range, the asset has already tested the 4670 level three times, thereby forming a descending triangle pattern.
Forecasted Scenario:
Following the narrowing of the 4670–4720 trading range, a new uptrend will likely begin, driven by accumulated liquidity, towards the 4800 level. The intermediate target is at the 4600 level.
News Background:
The situation in the Middle East remains in a state of uncertainty, and any escalation of the conflict could once again drive gold into a downward movement due to the outflow of capital into oil and gas assets.
Economic Calendar:
Monday, April 27: No significant macro data. Technical trading is expected.
Tuesday, April 28: Conference Board Consumer Confidence Index.
Wednesday, April 29: US Fed Interest Rate Decision and J. Powell's press conference. The main risk event of the first half of the week.
Thursday, April 30: US Initial Jobless Claims.
Friday, May 1: Non-Farm Payrolls (NFP), Unemployment Rate, and ISM Manufacturing PMI. Extreme volatility is expected.

Bearish EURUSDNoticed a shift in structure once price closed below 1.1762, Now currently looking
to take a sell position from 1.17510 to about 1.16314. Short-term Bearish market structure forming. Let me know your thoughts!

Gold is range-bound, awaiting a breakout.The gold price has currently entered a high-level consolidation phase with muted intraday fluctuations. Bullish and bearish forces are largely balanced, and overall market sentiment remains cautious. The market traded in a choppy range throughout the day, with prices fluctuating repeatedly around the $4,700 mark.
The core driver lies in the continuous delay of market expectations for Federal Reserve interest rate cuts. Sustained high interest rates act as a drag on gold’s upside. Without the boost of monetary easing expectations, gold struggles to stage a sustained bullish trend. Meanwhile, the U.S. dollar and Treasury yields remain resilient, reducing institutional demand for non-yielding gold. Gradual profit-taking at elevated levels has weakened every rebound attempt, forming strong overhead resistance.
On the flip side, fundamental downside support for gold remains intact. Continuous gold purchases by global central banks have established a solid bottom for prices. In addition, lingering geopolitical uncertainties trigger safe-haven buying at every turn, effectively propping up downside levels. The current market landscape features short-term policy headwinds capping gains and long-term fundamentals limiting losses, leaving prices trapped in a balanced range waiting for a directional breakout.
From a technical perspective, bullish momentum following the previous rally has faded, and the daily chart has shifted into consolidation with mild short-term weakness. Nonetheless, key downside support remains robust. Major overhead resistance sits between $4,730 and $4,750; a break above this zone is required to reignite the uptrend. The critical support zone of $4,650 to $4,680 will offer solid buying opportunities on dips, supporting corrective rebounds.
The entire market is now awaiting fresh directional catalysts. U.S. inflation data and the Federal Reserve interest rate decision due in the next two days will serve as pivotal triggers for gold’s next move.
📌 I share my daily trading strategies every day.

US30 swingsDow Jones has been climbing trending to the upside. A reversal pattern, break of a recent HL to create Coch. In overall I foresee a huge reversal to the downside for at least a month.

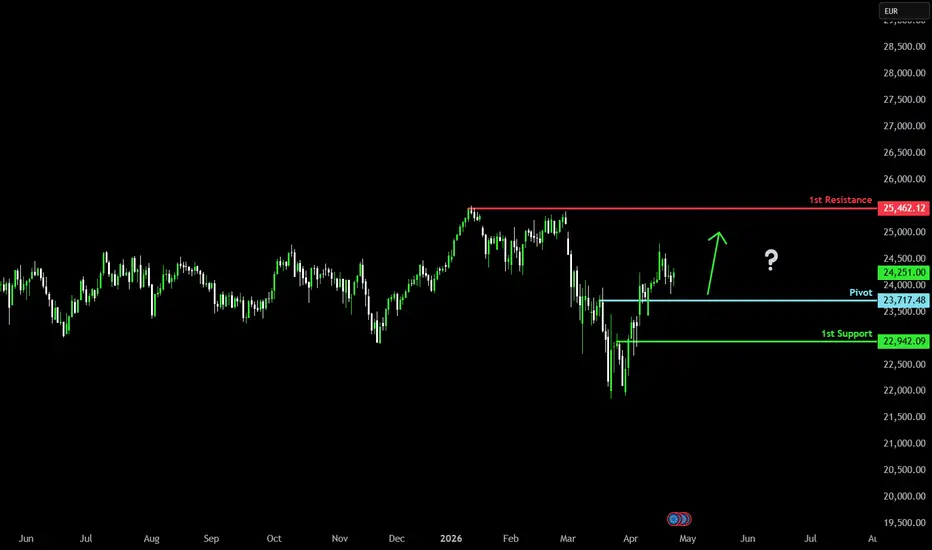
Potential bullish bounce?DAX40 (DE40) is falling towards the pivot and could bounce towards the 1st resistance.
Pivot: 23,717.48
1st Support: 22,942.09
1st Resistance: 25,462.12
Disclaimer:
The opinions given above constitute general market commentary and do not constitute the opinion or advice of IC Markets or any form of personal or investment advice.
Any opinions, news, research, analyses, prices, other information, or links to third-party sites contained on this website are provided on an "as-is" basis, are intended to be informative only, and are not advice, a recommendation, research, a record of our trading prices, an offer of, or solicitation for, a transaction in any financial instrument and thus should not be treated as such. The information provided does not involve any specific investment objectives, financial situation, or needs of any specific person who may receive it. Please be aware that past performance is not a reliable indicator of future performance and/or results. Past performance or forward-looking scenarios based upon the reasonable beliefs of the third-party provider are not a guarantee of future performance. Actual results may differ materially from those anticipated in forward-looking or past performance statements. IC Markets makes no representation or warranty and assumes no liability as to the accuracy or completeness of the information provided, nor any loss arising from any investment based on a recommendation, forecast, or any information supplied by any third party.
swing long on daily goldgold trending back up in bullish order flow daily after sweeping a weekly swing low. tp $4892
sl$4657

XAU/USD Gold Demand Zone Test and "Fakeout" Potential
The chart shows Gold attempting to find its footing after a volatile morning session. Key technical and fundamental details include:
Demand Zone Support: Price has descended into a blue Demand Zone between $4,700 and $4,715. While it briefly dipped below the box, it is currently showing a small bullish reaction, trading at $4,724.23.
Market Sentiment: Bullion is seeing a relief bounce following reports that Iran has submitted a new proposal via Pakistani mediators to reopen the Strait of Hormuz. This has eased some of the immediate "war premium," but the market remains skeptical.
The "Bull Trap" Risk: Despite the bounce, Gold is still trading below its 21-day SMA ($4,719) and 100-day SMA ($4,746). Many traders are viewing this move as a "dead cat bounce" or a "fakeout" before a deeper correction toward $4,650 later this week.
Week Ahead: All eyes are on the Federal Reserve (FOMC) decision this Wednesday. If the Fed signals "higher-for-longer" rates to combat energy-driven inflation, the current support zone for Gold may give way.
The Outlook: The $4,725 level is the immediate line in the sand. If buyers can't hold this reclaim, a breakdown below $4,683 (the recent low) could open the doors for a move toward the $4,580 liquidity pocket.

Daily live plan with XAUUSD using EasyFIBO in 15m 20260427Daily live plan with XAUUSD using EasyFIBO in 15m 20260427

Gold prices are fluctuating slightly with a bearish bias.What recent news has influenced the price movements of gold and crude oil? How should we assess the future direction of gold?
Gold prices fell under pressure, dropping to around $4,672 before rebounding, continuing the previous correction. Despite continued tensions in the Middle East, gold failed to find significant support and instead declined under the influence of macroeconomic factors, indicating that the current market pricing logic has shifted from simple safe-haven demand to a rebalancing of "interest rates and inflation expectations." Affected by the tense situation in the Middle East and rising energy prices, market concerns about inflation have intensified again. Coupled with the expectation that the Federal Reserve will maintain high interest rates, this has weakened the attractiveness of gold. Although safe-haven demand remains, the high-interest-rate environment has become the dominant factor, limiting the upside potential for gold. Logically, rising oil prices often push up overall inflation levels through energy cost transmission, and rising inflation expectations directly affect the path of monetary policy. The market currently widely expects the Federal Reserve to keep interest rates unchanged at this week's meeting. The expectation of high interest rates significantly weakens the attractiveness of gold as a non-interest-bearing asset. In a high-interest-rate environment, funds tend to flow to assets with yield attributes, thus putting downward pressure on gold.
This week will also see the release of key US data, including Q1 GDP and March PCE figures. Market focus will quickly shift from the negotiating table in Islamabad to the decision-making sessions of major central banks. The intensive meetings of the Federal Reserve, the Bank of Japan, the European Central Bank, and the Bank of England will be crucial variables determining the fate of gold. If the Federal Reserve releases any hawkish signals this week regarding rising inflation and the need to maintain tight monetary policy, gold prices could face a deeper correction.
Gold price trend analysis:
Today's gold trading recommendations focus on the resistance level of $4740-50 and the support level of $4650-55. Currently, you can consider shorting gold near $4740.

Gold Bulls Battle for $4700!Gold Bulls Battle for $4700!
Here's our trading strategy for tomorrow (Monday) (including precise entry and exit points).
I've reviewed all the news and market sentiment this week.
After a significant pullback from the $5400 high, market sentiment has entered a highly sensitive "balance between bulls and bears."
For me, volatility is profit, and gold is currently at a critical turning point.
As always, every word contains valuable information; like and join us!
Why is gold price oscillating between rising and falling?
The weekend didn't end this tug-of-war; market sentiment continues to oscillate between "safe haven" and "restraint."
1. The biggest negative factor (restraining gains): A stronger dollar and pressure from US Treasury yields: Recent strong US economic data (PMI) have postponed expectations of a Fed rate cut until 2027.
This means the opportunity cost of holding gold has increased significantly, hindering bullish entry at current prices and creating technical selling pressure. Previously, gold prices surged from $5,000 to $5,400, accumulating excessive "crowded long positions," and the current pullback is a deleveraging phase driven by this bullish squeeze.
2. Key Support (Preventing Deep Declines):
Geographical Tensions: The Strait of Hormuz standoff remains unresolved, and the US-Iran confrontation continues to escalate. High oil prices make it more difficult to lower inflation expectations.
Buying Support: Significant inflows support gold prices whenever they fall to the $4,660-$4,680 area.
My Conclusion: Gold prices may continue to consolidate on Monday to find a bottom, then await a catalyst for a breakout.
The key price level is $4,700.
Daily Chart: Gold prices are still in a downtrend, but the decline has slowed significantly, showing signs of bottoming out.
4-Hour Chart: Gold prices are forming a descending wedge pattern, which typically indicates a higher probability of an upward breakout.
Moat: $4680-$4700 (This is the last line of defense for the bulls).
High-Pressure Line: $4735-$4750 (4-hour moving average resistance zone).
I believe the possibility of gold prices falling directly to $4500 is relatively low. Tomorrow, Monday, is more likely to see a bottoming out and rebound or a direct rebound.
Core Strategy: Primarily buy on dips near strong support levels, avoid shorting! We should use pending orders and wait for market sentiment to subside before shorting.
Main Strategy: Wait for lower prices to go long.
Buy 1: $4685 - $4695
Buy 2: $4675
Take Profit 1: $4730
Take Profit 2: $4760
Stop Loss: $4650
If gold prices stabilize above $4720, it indicates an upward trend, and we should follow suit.
Buy: 4710-4720
Take Profit: 4745 / 4765
Stop Loss: 4710
If gold prices fall first on Monday, don't panic; this is major players squeezing out weak hands. Focus on the 4685-4695 range and use a pyramid strategy to build positions in batches.
If gold prices rise directly on Monday, don't chase the price. Wait for the price to pull back and stabilize around 4715 before entering.
Why follow the trend?
Gold is currently at the beginning of a "fish body" trend!
While others are still hesitating about entering around $4700, I have already calculated a precise bottom-fishing point of $4685 for you.
I don't offer "secret formulas for blowing up your account," I only offer methods for achieving stable profits through reasonable stop-loss orders.
This strategy has a risk-reward ratio of 3:1 (90 points of profit, 30 points of loss), which is the scientific trading method!
I will share the latest developments after the market opens on Monday.
The $4700 mark for gold is by no means the end; it could very well be the starting point for the second half of the year.
If you don't want to miss this period of volatility, please like, save, and share this excellent prediction!
Leave your entry point in the comments section, and let's work together on Monday to seize this strong upward trend in gold and conquer $4700!

EURUSD BUYSINVERSE FIBS
88.6%
76.46
61.8%
38.2%
11.6%
Buy zone or inverse fibs for sell zone
Sweep/qmr(quasimodo reversal) Market Structure shift or bos mitigated off ob is the META
trading plan is on the charts for price action and basic retail
Keep an eye out for the META
GHOSTFX

XAUUSD Breakdown from Wedge – Bearish Pressure Below ResistanceGold is currently trading around the 4730 region, positioned at a critical zone following a shift in near-term momentum.
🔍 Market Structure Insight (1H):
Price action reflects increasing bearish pressure after a breakdown from a wedge structure and a move below the 21-period moving average. This signals weakening bullish momentum, with sellers gaining control in the short term.
📈 Bullish Scenario:
If price reclaims and sustains above the 4740 resistance level with strong momentum, it may trigger a recovery toward the 4880 supply zone as buyers regain control.
📉 Bearish Scenario:
Due to:
= Strong US Dollar limiting upside
= Ongoing geopolitical tensions capping gains
= Technical breakdown and weak structure
If price remains capped below the 4730–4740 resistance zone, gold may continue its downside move toward the 4510 demand zone.
⚠️ Key Levels to Watch:
Resistance: 4740
Support: 4510
💡 Trading Idea:
Watch for rejection near resistance or continuation signals below current levels. A confirmed reclaim above resistance would shift short-term bias.
This is just a personal market view based on price action, not financial advice.
#Gold #XAUUSD #Forex #TradingView #PriceAction #TechnicalAnalysis

XAUUSD Update | Bearish Scenario Playing OutPrice is now reacting from the sell zone as expected, with bearish pressure building and lower highs forming.
Scenario 1 (primary) is currently playing out, confirming rejection from the liquidity area.
As long as price remains below the sell zone, bearish continuation toward 4700 → 4650 remains valid.
No bullish confirmation yet — still watching for continuation structure.

XAUUSD: Bullish Reversal Setup at Nested H1/4H Order BlockTechnical Analysis & Market Structure:
Gold (XAU/USD) is currently displaying a high-probability bullish setup on the 1H timeframe. After a significant liquidity sweep that cleared out retail stop-losses, the price tapped into a major POI (Point of Interest) aligned with an ascending support trendline.
We observed a strong impulsive move away from the POI, leaving behind an FTR (Fail to Return) zone. Currently, the price has retraced into a high-confluence demand area where the H1 and 4H Order Blocks (OB) overlap. This nested zone indicates heavy institutional buying interest.
Trade Setup Details:
Entry Zone: The price is currently testing the 4,685 – 4,705 demand cluster. Look for bullish price action or a lower timeframe shift in market structure (mBOS) within this box.
Target: The primary objective is the 4,765 level (marked as Target), which aligns with the recent structural swing high.
Risk Management: The setup remains valid as long as the price holds above the POI Point. A break below the 4,660 level would invalidate this bullish thesis.
Conclusion:
With liquidity cleared and the trend returning to the upside, the current retracement into the H1-OB provides a favorable Risk-to-Reward entry for a move toward the 4,765 liquidity target.

Patience At this point I believe the best thing is to wait for H1 close. If it closes bullish then longs can be placed. If bearish, the next H1 might sweep below it before closing bullish

Strong Bullish Start to the Week for Gold! OANDA:XAUUSD A strong start to the week! Gold’s internal structure remained bullish as long as it respected the last higher low at 4643, and so far, it has held firmly.
A clean break above 4740 would confirm continuation of bullish momentum, opening the door for further upside. However, keep one eye on geopolitical tensions, as they can inject sudden volatility into the market.
