Buy the Dip: Gold ready to bounce from 4660–4640!Gold prices didn't move dramatically during the day, mostly fluctuating narrowly around 4700. However, from a short-term perspective, gold repeatedly encountered resistance in the 4730-4750 area, indicating a clear bearish trend and maintaining an overall weak pattern. It's unlikely there will be a significant rebound before breaking through the 4730-4750 range.
Although the short-term downtrend is quite evident, the defensive strength of the key support area below should not be underestimated. Therefore, gold will generally maintain a range-bound trend, with multiple bottoming and rebounds being particularly noticeable. The lack of sustained bullish or bearish trends has resulted in range-bound trading with resistance above and support below. The support level in the 4660-4640 area below is particularly evident.
Therefore, since gold is still maintaining a volatile trend, this provides opportunities for both long and short positions to profit.
Short-term technical support levels: 4660-4640 / 4620-4600
Short-term technical resistance levels: 4730-4750 / 4800-4820
Therefore, in short-term trading, I would prioritize buying gold in the 4670-4650 range; if gold rebounds to the 4720-4740 range, I would consider shorting gold.
Community ideas

Why are you losing: you are not trading YOUR time frame!📌 Why timeframe is the basis of trading?
Many beginners think that the secret to profitable trading is in indicators, signals or a “secret strategy”.
But the reality is simpler and harsher:
You may be right in your forecast...but lose money because of the time frame.
Because the market moves in several directions at the same time!
At 1H - growth
At 5M - drop
On D1 - sideways
And they are all correct at the same time.
What is a timeframe?
The timeframe is the “scale” of the market.
The same thing applies if we present a map of the planet.
For example, the text inscription on the map is “1 cm - 30 km”. This is the easiest way to quickly estimate distance.
Unlike paper maps, we can view the chart under a magnifying glass:
M1-M5 (timeframe 1-5 minutes) → noise and fast movements
M15-H1 (time frames up to 1 hour, volatile environment) → intraday logic
H4-D1 (time frames several hours to 1 day) → medium-term trends
W1-M1 (time frames from 1 week to several months) → global picture.
‼️ The larger the time frame, the more important it is!
W1 - much more important globally than M15
📉 Example (how beginners lose money)
You see:
On M5 - strong growth 🚀→ go long
But on H1:
price at resistance→ market turns around
📉 Result: stop (at best)
You were not mistaken...You just traded the wrong time frame and because of this the price quickly returned to the stop.
How does a beginner and an experienced trader see a chart?
Newbie:
M5: Growth +5%:
Woow the rocket! A strong trend is starting.
Experienced:
Growth +5%:
What happened? Why price up?
M5: There seems to be momentum, me need to be ready to quickly open a trade.
H1: On the hourly time frame, the price tends to correct downwards.
D1-W1: But globally, the trend is downward.
Not good deal for invest, but good momentum for trading if you have profitable strategy.
The right approach: Top to bottom!
W1-М1 → determination of the global trend (up or down?!)
The first thing you need to start analyzing is ANY ASSET on the market.
D1 → where is the market heading in the coming months?
H1 → where are the nearest levels of support and comparison?
M15 → where is the nearest best trade entry?
This is called multi-timeframe analysis.
⚙️ How to choose your timeframe
Here's where most break down:
🔹Scalper (the most difficult, as you need to compete with trading robots)
* Timeframe: M1–M5
* Deals: many
* Stress: very high
🔹 Day trader
* Timeframe: M15–H1
* Trades: 1–5 per day
* Balance of risk
🔹 Swing trader
* Timeframe: H4–D1
*Deals: 1–5 per week
* Minimum noise
Each trader has his own suitable time frame.
The number of transactions means nothing!
You can open 100 trades and 99 of them will be negative.
Or you can study the market in detail and open just one trade with a risk/profit of 1/10, which will bring big profits.
And if you are not trading your time frame: you're nervous, close early, you come in late, catch your feet.
Golden Rule: Timeframes should match, not conflict
Example: Price 100$.
Analysis by timeframe:
* D1 → upward trend (this means it is advisable to open longs)
* H1 → rollback down to $90 (buy, support and resistance zones)
* M15 → search for the entry point into a trade.
This is a strong deal
The most common mistakes made by newbies
1) Watch 10 timeframes at once
2) Enter on the junior against the senior
3) Change style every day
4) Trade “according to your mood”
📈 Summary
A timeframe is more than just setting up a chart.
This is your style, your psychology, your strategy. Find yours and 50% of problems will disappear immediately.
The best asset that always grows against all currencies is Gold OANDA:XAUUSD
Its most often more profitable to trade long and accumulate for the long term.
I recommended buying gold in October 2023, when it cost ~$1900 - post in pinned messages.

Bullish Reversal from Ascending Channel Support
Conversation with Gemini
Plz make good title and description
It looks like you're eyeing a potential bounce on Gold (XAUUSD). Based on the chart setup you've provided, here is a professional title and a detailed breakdown for your analysis.
XAUUSD Analysis: Bullish Reversal from Ascending Channel Support
Overview
The chart shows Gold (XAUUSD) currently navigating a correction phase within a broader recovery attempt. After a sharp decline from the 4,860 highs, the price has stabilized and is now respecting an ascending parallel channel. This setup suggests a shift in momentum from bearish to cautiously bullish.
Key Technical Levels
Current Price: Approximately 4,703
Target (Take Profit): 4,740.68 — This aligns with a previous structural resistance and the white horizontal level.
Stop Loss: 4,690.25 — Placed just below the recent swing low and the red support line to mitigate risk if the channel breaks.
Trade Setup & Logic
Channel Support: Price is currently hovering near the lower boundary of the ascending channel. Historically, this zone has acted as a springboard for price appreciation.
Support Foundation: The red horizontal line at 4,690 represents a strong floor. As long as the price remains above this zone, the bullish thesis remains intact.
Risk-to-Reward: With the entry near 4,703 and a target at 4,740, the trade offers a favorable Risk-to-Reward ratio (R:R) of roughly 1:3, which is mathematically sound for long-term profitability.
This is not financial advise

ETHUSDT 1D#ETH has once again been rejected by the descending resistance, and a correction toward around $2127 is expected. After that, in case of a strong bounce, we can expect a breakout above the triangle and a move toward the following targets:
🎯 $2551.00
🎯 $2741.00
🎯 $3011.00
🎯 $3354.00
However, if the triangle breaks to the downside, it may revisit the $1747 level once again.
⚠️ Always remember to use a tight stop-loss and maintain proper risk management.

BTCUSDT Rising Channel Breakdown Incoming?Bitcoin is currently trading inside a well-defined ascending channel on the 4H timeframe, consistently respecting both trendlines with multiple higher highs and higher lows.
Recently, price tapped the upper boundary of the channel and faced strong rejection, followed by a sharp move back toward the mid-range. The current structure shows weakening bullish momentum as price struggles to hold above the channel support.
A potential breakdown scenario is forming:
- Price is testing the lower trendline support
- Multiple rejections from the upper boundary indicate seller pressure
- Current candle shows bearish intent near support (circled area)
Key Levels:
- Resistance: 79,000 – 80,000 zone (channel top)
- Support: 77,500 (channel base)
- Breakdown confirmation below support could trigger a move toward 66,000 – 65,800 region
Trade Idea:
-Bearish bias if price breaks and closes below channel support
- Target: Lower demand zone (~65K region)
- Invalidation: Strong reclaim and hold above 79K
Conclusion:
As long as BTC remains inside the channel, structure is bullish. However, a confirmed breakdown could shift momentum to the downside, offering a high-probability short opportunity.
Cheers
Hexa

1H chart of Ethereum...1H chart of Ethereum, price just rejected a resistance zone (~2390–2400) and broke down from the short-term structure.
📉 Bearish Target Levels:
Primary target: 2270–2280 (my marked level + trendline support confluence)
If breakdown continues:
2220–2240 (next demand zone)
2150 (stronger lower support)
📊 Key Observations:
Clear rejection from supply zone (top grey box)
Range breakdown after consolidation (middle grey box)
Price losing trendline support → bearish momentum building
⚠️ Invalidation:
If price reclaims 2380–2400, bearish setup weakens

EURUSD 15m Bullish SetupEURUSD is showing short-term bullish momentum after a strong rebound from the recent low.
Price is holding above the demand/order block zone around 1.1695 – 1.1702. As long as this area holds, the bullish scenario remains valid.
Key levels:
Entry/confirmation: 1.1715 – 1.1720
Target: 1.1745 – 1.1755
Invalidation: below 1.1690
A clean break and hold above 1.1720 could support continuation toward the upper resistance zone.

Trade Plan: OLEDTrade Plan: OLED
• Direction: Long
• Entry: 99.00
• Stop Loss:83.50
• TP1: 120.00
• TP2: 145.00
• TP3: 200.00
• TP4: 248.00
Take partial profits at each target, then trail stop to protect profits.
Not financial advice.

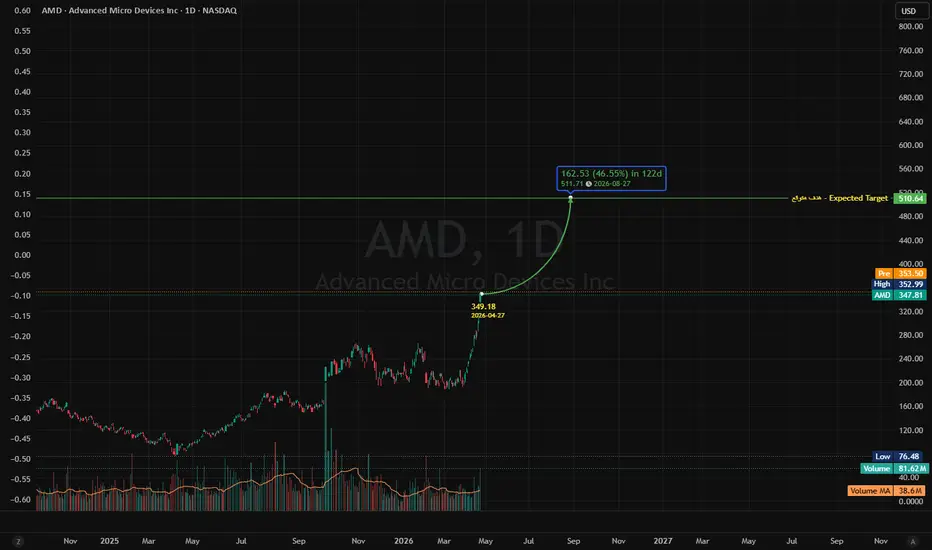
AMD - Advanced Micro Devices IncThe stock is expected to rise over the next 122 days,
Expected increase of 46%
XAUUSD Breakout Setup — Bearish Pressure Building (24.04.2026)XAUUSD 1H Chart Analysis 📉 : OANDA:XAUUSD
Gold is currently forming a triangle breakout pattern after a strong bearish move. Price is trading near the lower side of the triangle, showing weakness as sellers continue to defend the upper trendline.
Setup Overview :
XAUUSD is respecting a descending trendline from point A, while the lower trendline support from point B is being tested around the current price area. If price breaks and closes below the triangle support, we may see further downside momentum.
The bearish scenario remains valid as long as price stays below the marked resistance area.
Support & Resistance :
Resistance Zone:
Price may face strong rejection around the 4,737 – 4,752 zone. This area also aligns with cloud resistance, making it an important supply zone.
1st Support:
The first downside target is around 4,609.
2nd Support:
If selling pressure continues, the next major support is around 4,556.
A clean bearish breakout below the triangle could open the path toward these support levels. However, if price reclaims the resistance zone, the bearish setup may become invalid.
#XAUUSD #Gold #GoldTrading #ForexTrading #TechnicalAnalysis #TriangleBreakout #PriceAction #TradingView #ForexSignals #KABHITATrading
Disclaimer ⚠️
This analysis is for educational purposes only and is not financial advice. Always use proper risk management and confirm with your own trading plan before entering any trade.

XAUUSD | CSP Setup – Resistance Rejection After Gap FillGold has done exactly what it was supposed to do — filled the weekend gap and tapped straight into the resistance zone sitting around 4,730, where the very first rejection originally formed. That double touch at the same level is not a coincidence. It's the market telling us sellers are defending that area with intent.
What We're Watching:
The structure here is clean. Price rejected the resistance zone, pulled back, and is now hovering just above what we're identifying as the neckline region near 4,710. What we are looking for is one more push back up toward that resistance — a minor deviation or retest — before sellers step in again and drive price back down through the current market area. Once that neckline breaks with conviction, that's our entry signal.
The Setup:
We don't chase the resistance rejection itself. We wait for the proper market structure break — price needs to come back, form that lower high, and then crack the neckline cleanly. That's the confirmation that sellers have taken dominance and the move down has legs. Entry after the MSB keeps us on the right side of the trade with structure behind us, not hope.
Targets:
The short-term target sits just under the resistance zone on any failed retest, but the major target we're focused on is the 4,678 area — the zone marked clearly on the chart. That's where this move has room to breathe if the structure break plays out the way we expect.
If we decide to break early that neckline zone which could happen as well we will still look for that short!
Definitely one to keep an eye on as the session develops.
If this added value, boost it forward.
Swallow Academy

XAUUSD 30M Sell Setup | Supply Zone Rejection in PlayGold Spot (XAUUSD) on the 30-minute chart is trading inside a key supply / resistance zone, where sellers may regain control. Price has rallied into the marked bearish area near 4735 - 4751, making this a potential rejection zone for a downside move.
Market structure suggests this push upward could be a retracement into supply before continuation lower. If bearish candles form here, selling pressure may drive price back toward lower liquidity levels.
Key Levels:
Sell Zone: 4735 - 4751
Target 1: 4710
Target 2: 4680
Target 3: 4658
Stop Loss: Above 4755
Trade Idea:**
Watch for confirmation inside the supply zone:
Bearish engulfing candle
Rejection wicks
Lower high formation
Break of minor support for entry
Market Outlook:**
Unless price breaks and closes above the supply zone, sellers remain favored from current levels. This area can act as smart money distribution before another leg down.

ELLIOTT WAVE & MOMENTUM ANALYSIS: XAUUSD (APRIL 27, 2026)
1. Momentum Analysis
The divergence between timeframes suggests the market is in a critical transitional phase:
– D1 Timeframe: Currently reversing to the upside. If this reversal is maintained, we could see 3–5 days of bullish or sideways-upward price action.
– H4 Timeframe: Currently in a downtrend, but price is moving sideways. This sideways or bearish pressure is likely to continue until H4 momentum reverses upward or enters the oversold zone.
– H1 Timeframe: Currently in the overbought zone and preparing for a bearish reversal. A short-term corrective drop is expected here.
2. Elliott Wave Structure
– Daily Timeframe (D1): Bullish Scenario – If today's candle closes green (bullish), it confirms a 3–5 day upward move.
– Since the recent correction was shallow, price is likely developing Wave D with the potential to break previous highs. A more distinct correction (Wave E) may appear afterward.
– 4-Hour Timeframe (H4): Transition between Correction and Reversal – Current Structure: Wave W has completed with a clear 3-wave structure. The current sideways movement is compressing, indicating a time-based equilibrium following the correction.
– Two potential scenarios:
1. Scenario 1 (Preferred): The correction is finished; price follows the D1 momentum to start a new bullish leg.
2. Scenario 2: This sideways phase is Wave X, to be followed by another leg down (Wave Y) before a major rally.
– Confirmation point: Observe the peaks and troughs when H4 momentum reverses. Higher Lows (HL) will confirm the uptrend; Lower Highs (LH) will indicate a continued downtrend.
– 1-Hour Timeframe (H1): Short-term Battleground – Current strong resistance: 4725.
– If the current upward move is an ABC structure (black): The target for Wave C completion is around 4754.
– If price fails to break 4725, it will likely return to test the support at 4656.
3. Trading Plan
– Sell Zone – Entry Zone: 4753 – 4755 (Expecting Wave C completion on H1).
– Stop Loss (SL): 4775.
– Take Profit (TP): TP1: 4725 | TP2: 4706 | TP3: 4685.
– Buy Zone – Entry Zone: 4661 – 4663 (Strong support area, aligned with D1 trend).
– Stop Loss (SL): 4641.
– Take Profit (TP): TP1: 4697 | TP2: 4706 | TP3: 4725.

Long $TaoFor past two weeks TSXV:TAO traded in discount FVG then closes higher than previous week. Respecting discount pd array in bullish trend likely price will push higher to premium area. So I think price will most likely reach $267 before reaching $243.

Trade Plan: CDWTrade Plan: CDW
• Direction: Long
• Entry: 123.00
• Stop Loss:110.50
• TP1: 170.00
• TP2: 220.00
• TP3: 310.00
Take partial profits at each target, then trail stop to protect profits.
Not financial advice.

Long road out of EdenForeseeing a crisis later on, you can refer to my ethereum post on the timing pivots roughly. Still testing out that system.

Trade Plan: DQTrade Plan: DQ
• Direction: Long
• Entry: 22.80
• Stop Loss:16.50
• TP1: 53.80
• TP2: 110.00
• TP3: 210.00
Take partial profits at each target, then trail stop to protect profits.
Not financial advice.

BTCUSDT Update !!Bitcoin continues to trade within a well-defined ascending channel on the 4H timeframe, maintaining a consistent structure of higher highs and higher lows.
Multiple touchpoints along both the upper and lower boundaries validate the strength of this channel. Price is currently approaching the upper trendline again, indicating a key decision area.
Despite minor rejections near resistance, the broader structure remains intact and constructive. The market is showing controlled momentum rather than impulsive breakout behavior, which is typical in sustained trends.
Key Observations:
Strong channel respect with multiple confirmations
Higher lows indicate sustained demand
Price nearing upper boundary resistance
RSI in neutral zone, allowing further expansion
Levels to Watch:
Resistance: 78,000 – 81,500
Support (Channel Base): 65,000 – 68,000
Outlook:
As long as the price continues to hold within the channel, the trend remains bullish in structure. A decisive breakout above the upper boundary could open the path toward 80K+ levels.
Failure to break may result in a pullback toward mid or lower channel support before continuation.
Overall, the structure remains healthy, with the channel acting as the primary guide for directional bias.
NFA | DYOR

Gold Price Outlook – Trade Setup (XAU/USD)📊 Technical Structure
OANDA:XAUUSD Gold remains in a range-bound structure, with the 4,737–4,743 resistance zone acting as the upper boundary and the 4,679–4,686 support zone holding as the lower boundary.
After rebounding from support, price is now moving back toward the upper range but has not confirmed a breakout. The latest structure suggests fading upside momentum near resistance, creating a potential sell-on-rally setup.
Short-term bias: Bearish within range
🎯 Trade Setup (Sell on Resistance)
Entry Zone: 4,737 – 4,743
Stop Loss: 4,748
Take Profit 1: 4,686
Take Profit 2: 4,679
Risk–Reward Ratio: Approx. 1:5.37
📌 Invalidation:
A sustained break above 4,748 would invalidate the bearish setup and shift the structure toward bullish continuation.
🌐 Macro Background
Gold has some macro support from US-Iran peace hopes, softer oil prices, and lower Fed hike expectations. However, with the FOMC meeting ahead and price still capped below resistance, buyers may hesitate near the upper range.
🔑 Key Technical Levels
Resistance Zone: 4,737 – 4,743
Support Zone: 4,679 – 4,686
Invalidation Level: 4,748
📌 Trade Summary
Gold is approaching resistance within a range structure.
Preferred strategy: Sell near resistance, targeting a move back toward the support zone.
⚠️ Disclaimer
This analysis is for reference only and does not constitute trading advice. Financial markets involve significant risk; proper risk and position management are essential.

SUI | CSP Setup – Unfilled CME Gap + BOS Confirmation SUI has been one of those assets worth keeping on the watchlist lately, and here is exactly why.
Over the past few weeks SUI has been forming larger CME gaps — and as many of you who follow our work know, CME gaps act like magnets. Every single one that has formed on this chart has eventually been filled, without exception. The gap from April 18-19 is still sitting there partially unfilled, and that alone keeps us firmly on the bullish side here.
What makes this more interesting is what happened after that gap formed. Price did not collapse further. Instead it moved sideways — building a proper accumulation zone underneath. In candle psychology terms this is exactly what you see when the market is absorbing sell pressure before a move. Not going down, but not going up yet either. That patience in price action tells a story.
The Confirmation:
A strong break of structure has now formed on the smaller timeframes — buyers are starting to take back dominance. Combined with a strong weekly opening hitting the markets, the momentum signals are aligning.
Current Targets:
$0.9723 — first target, where we monitor closely
$0.9961 — main target, aligning with the full CME gap fill
Gameplan:
Price holds current support, buyers push above the BOS level — we follow the upside toward both targets.
Risk Management:
Wait for structure to confirm before entry. Both setups need to be triggered, not chased.
If this added value, boost it forward.
Swallow Academy

LUMIAUSDT Forming Bullish MomentumLUMIAUSDT is currently forming a clear bullish momentum pattern, a classic wave structure that often signals an upcoming breakout. The price has been consolidating within a narrowing range, indicating that selling pressure is gradually weakening while buyers are beginning to regain control. With consistent volume supporting accumulation at lower levels, the setup suggests a strong potential for a bullish breakout in the near term.
If the price breaks above the wedge resistance, the projected move could be notable, with a potential gain of around 80% to 90%. This type of bullish momentum pattern is typically seen at the end of downtrends or corrective phases, signaling a possible shift in market sentiment from bearish to bullish.
Traders closely monitoring LUMIAUSDT are observing strengthening momentum as it approaches a key breakout zone. The presence of solid trading volume adds confidence to this setup, indicating that market participants may be positioning early in anticipation of a reversal.
Growing investor interest in LUMIAUSDT reflects rising confidence in its technical structure and overall potential. If the breakout is confirmed with strong and sustained volume, it could mark the beginning of a fresh bullish leg. This setup may present a valuable opportunity for medium-term traders as momentum builds and the pattern completes.
✅ Show your support by hitting the like button
✅ Leave a comment below (What is your opinion about this coin?)
Your feedback and engagement keep me motivated to share more insightful market analysis with you!

Analytics: market outlook and forecasts
WHAT HAPPENED?
Last week, after correcting to the $75,000-$74,000 zone, bitcoin continued its upward movement and updated the formed maximum. However, then the price was in a narrow sideways range for most of the week – it hardly moved.
The buyer maintained the advantage by absorbing sales with limit orders. By Monday, the buyer attempted to update the maximum again, but to no avail.
Now the range has expanded to $79,500-$77,000, volumes remain low, and the market is shrinking. At the same time, sellers continue to exert pressure.
WHAT WILL HAPPEN: OR NOT?
The base case scenario is continued growth. This is possible both from the current levels during further trading, and after a false breakdown of the sideways minimum.
If the $76,500-$75,800 zone is tested and there is a reaction, long positions can be considered in order to update the current maximum.
It’s too early to open short positions. However, such a scenario is not excluded: if the price goes lower and there is no reaction, we’ll monitor the formation of a downward structure and update our forecast.
Buy zones
$76,500–$75,800 (local buyer aggression)
$73,200–$72,000 (initiative volume)
$70,000–$68,700 (selling absorption)
$67,500–$66,500 (accumulated volumes)
$62,500 level
$47,000–$40,000 (daily buy zone)
Sell zones
$82,000–$85,500 (volume anomalies)
$87,600–$90,500 (accumulated volumes)
IMPORTANT DATES
Macroeconomic developments this week:
• Tuesday, April 28, 3:00 (UTC) — announcement of Japan's interest rate decision;
• Tuesday, April 28, 14:00 (UTC) — publication of the U.S. Consumer Confidence Index for April;
• Wednesday, April 29, 12:00 (UTC) — German Consumer Price Index for April is published;
• Wednesday, April 29, 14:30 (UTC) — publication of data on crude oil reserves in the United States;
• Wednesday, April 29, 18:00 (UTC) — announcement of the US Federal Reserve's interest rate decision, as well as the FOMC statement;
Wednesday, April 29, 18:30 (UTC) — FOMC press Conference;
• Thursday, April 30, 1:30 (UTC) — publication of the index of business activity in the Chinese manufacturing sector for April;
• Thursday, April 30, 8:00 (UTC) — publication of German GDP for the first quarter of 2026;
• Thursday, April 30, 11:00 (UTC) — announcement of the UK interest rate decision for April;
• Thursday, April 30, 12:00 (UTC) — publication of the Bank of England's letter on inflation;
• Thursday, April 30, 12:30 (UTC) — publication of US GDP for the first quarter of 2026, as well as the basic price index of US personal consumption expenditures for March and the number of initial applications for unemployment benefits in the United States;
• Friday, May 1, 13:45 and 14:00 (UTC) is the publication of the index of business activity in the US manufacturing sector for April.
*This post is not a financial recommendation. Make decisions based on your own experience.
#analytics

EURUSDPrice pushed clean from the lows and is now sitting just under the upper high.
I’m watching for a pullback into my buy zones around 1.17036 / 1.16989 / 1.16951.
As long as price holds above the fail level around 1.16843, I’m still looking for continuation back into the highs.
Clean setup. Let price come to me.
