ETH Accumulation Above Demand Zone – Watch for Breakout MoveEthereum is currently respecting a strong ascending trendline while holding above a critical support zone around 2150 – 2250. This zone has acted as a demand area multiple times, indicating buyer presence.
Price is forming higher lows, suggesting a shift from bearish to bullish structure. A minor pullback into the support or trendline retest is expected before continuation.
📊 Key Levels to Watch:
* Support Zone: 2150 – 2250
* Trendline Support: ~2200 area
* Immediate Resistance: 2400 – 2500
* Major Resistance: 3200 – 3350
🔍 Market Expectation:
* Short-term: Possible dip into support (liquidity grab)
* Mid-term: Bounce towards 2500
* Breakout: If 2500 breaks → strong move towards 3200+
⚠️ If price breaks and closes below 2100, bullish structure becomes invalid and further downside can occur.
⸻
Note: Analysis is based on price action, trendline & support/resistance.
Not Financial Advice
Community ideas

thanks GOD is friday on a W-timeframebearish week $$$
price action has been bullish for the past four days and broke all-time highs with 4 bullish candlesticks this week. i anticipate a bearish possibility, in which i expect price to cover 50% of last week's bullish candle, or possibly more. The idea is TGIF. $ $ $ $ $

Loop may be Bottomed/BottomingMajor double/triple bottom possible here, with lows around 80-90 cents, neckline around 1.95-2.30.
If it get can and hold above 1.95, I expect a move to 4.29 and then 6.33 conservatively. Higher is possible.
May play out relatively soon if it is done now, though if we see another bottom instead it could take months to resolve.

Gold Now price is in a pullback / consolidation phaseThis is post-rally digestion, not a confirmed trend reversal
Price dropped sharply from the highs → volatility spike
Now forming:
Lower highs short-term
But still holding higher lows overall
That = mixed structure (short-term weak, long-term still bullish)
4800 strong hold on daily closing above and continuation to 4900 without much resistance after is a stronger chance of break out
Resistance: ~4,800 – 4,950
Area where sellers keep stepping in
Support: ~4,550 – 4,400
Buyers defending this zone
Major support: ~4100-4,200
If this breaks → bigger correction likely
What the chart is really saying
The uptrend is not broken
But it’s no longer trending strongly
It’s in a decision phase after a blow-off top
wait.....

USD/CAD Sell Limit
Here is a sell limit for USD/CAD with a 3 R/R
Follow me for more signals like this :)

SMC Outlook: Gold Accumulation Phase Before Bullish ContinuationGold is currently trading near a strong POI (Point of Interest) around the 4670 – 4685 zone, which aligns with previous demand and liquidity areas. Market has been forming lower highs, indicating short-term bearish pressure, but price is now sitting at a key reaction zone.
A liquidity sweep (SSL) below recent lows is likely before any strong move. If price holds this demand and shows confirmation, we can expect a bullish expansion.
📊 Key Levels to Watch:
* Support Zone (POI): 4670 – 4685
* Intraday Resistance: 4725 – 4750
* Breakout Confirmation (BOS): Above 4800
* Major Target: 4890 – 4900
🔍 Market Expectation:
* First: Possible fake breakdown / liquidity grab below 4670
* Then: Strong reversal towards 4750 → 4800 → 4900
⚠️ If price breaks and sustains below 4650, bullish setup becomes weak and further downside can continue.
⸻
Note: This is a structure-based analysis using Smart Money Concepts (SMC).
Not Financial Advice

Can this momentum in IGP carry us back to the previous highs?I hold this one personally so factor that in, and I was already a holder at 120p which made 80p look like an obvious top up opportunity.
Sentiment has shifted quickly here following some new contract wins and renewals, and the price action is starting to confirm it. Tuesday was the session that stood out, a strong bullish move closing the gap on very strong volume, finishing at the high of the day. When a price closes at the high on volume like that, it tells you the sellers have been cleared out at this level.
For a software company the valuation looks attractive and the chart is beginning to agree.
Short term I think this momentum can carry it back to the consolidation area around 120p at minimum.

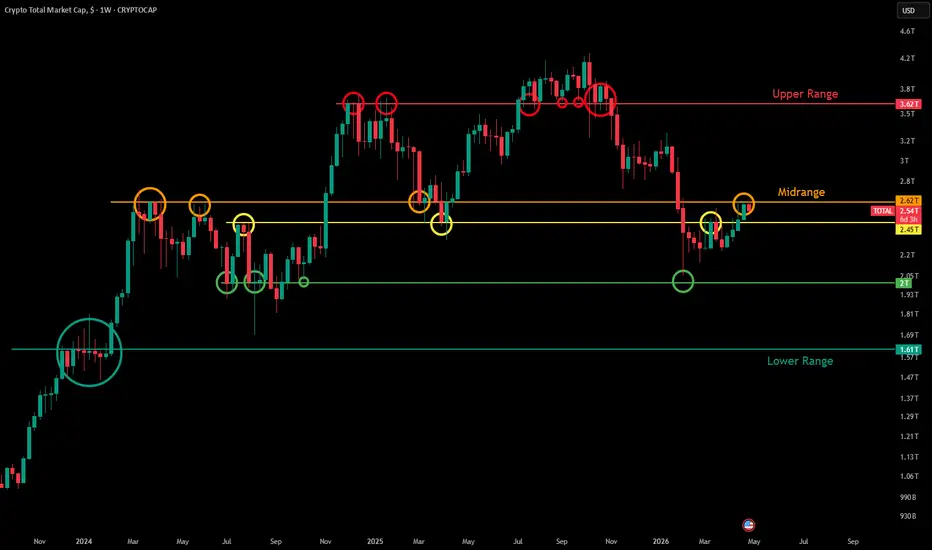
TOTAL - Understanding Significant Marketcap ValuesIn this post I want to break down the total cryptocurrency marketcap and the key levels that have developed over this past cycle. So far these levels have had significant confluence with Bitcoin's price action and will continue to do so going forward. Let's break down everything I have outlined in this chart.
To begin you must understand that this is on the weekly timeframe. This is important when considering the significance of these levels, as the most meaningful data points come from weekly settlement levels, specifically the weekly candle closes we see for TOTAL. The other thing to note is the bigger the circle on the chart, the more powerful the move off that key level was.
Upper Range $3.62 Trillion (Red Ray)
This became the first significant weekly settlement level when price created a weekly reversal from it in December 2024. The market cap had been in a strong uptrend, followed by a dragonfly doji, then a reversal to the downside with weekly candle bodies closing at $3.62T.
In January 2025, TOTAL wicked to that level a couple of times as continued resistance before falling again. Once marketcap broke above that weekly resistance level in July 2025 it established it as new weekly support, confirmed by candle body closes in August 2025. Then in September and October the marketcap continued to hold that key level as support. Once TOTAL closed below it in November 2025 the crypto bear market began and the upper range has not been tested since.
Midrange $2.62 Trillion (Orange Ray)
This is the current stage of the bear market that TOTAL has found itself in and is the most important level to examine in the present day. Today is April 27, 2026 and yesterday's weekly candle close solidified yet another significant market cap level at $2.62 Trillion.
What is fascinating about this level is that it sits exactly $1 Trillion below the upper range and is probably the most important level the entire cryptocurrency market cap is facing this cycle.
Looking back to March 2024 you can see why. This level marked the top of the March 2024 rally when BTC created a new all time high around $74,000. Even with BTC's recent push above $74,000, the total cryptocurrency market cap is still failing at the March 2024 highs because altcoins are significantly weaker than Bitcoin at this point in time.
Through March and April 2024 it continued to hold that level as resistance. Then in May and June the marketcap reached those levels again before creating wick highs and getting rejected once more. TOTAL then broke above in November 2024 during the election and the $2.62T level was not seen again until March 2025, exactly one year after it was first established.
This is where it gets really important. Looking at the four weekly candles from March 3, 2025 to March 24, 2025, all played a significant role with that orange level.
Now fast forward to current day. Yesterday's weekly candle closed at $2.60T with a high of $2.63T, right at the orange ray. This is significant because since Sunday's close the total cryptocurrency market cap has already erased over $60 Billion, showing a clear rejection from this extremely key market cap level. This could very well end up being the high before a drop back toward $2 Trillion.
$2.45 Trillion (Yellow Ray)
This was the last high in July 2024 before the major drop occurred. It was also the April 2025 low before the rally to all time highs began. Most recently it marked the top of the March 2026 rally with a weekly close at the level as resistance before the weekly double bottom was created.
So looking at current price action, the yellow ray marked a major weekly top in March 2026 and we are now likely seeing a major weekly top form for April 2026 at the orange ray.
$2 Trillion (Green Ray)
If a top is indeed forming for the total cryptocurrency market cap, the next level to watch is $2 Trillion. This should act as a major support zone and has already helped create the major low in February 2026 when BTC dropped to $60,000.
This level represented the weekly candle body lows in July and August 2024, and the weekly only had one false close below it before rallying to new all time highs, establishing the $2T level as major support. Even during the February 2026 crash the marketcap got close to $2T, finding a low at $2.05T before rallying significantly toward the midrange where it currently sits. Expect a local low to form around this $2T level.
Bottom Range $1.61 Trillion (Teal Ray)
This is the final level worth examining and the one that could mark the bear market bottom for TOTAL.
Are you starting to see the pattern? $1.61T, $2.62T, $3.62T, all significant levels and each approximately $1 Trillion apart.
This level marked many weekly candle body closes from December 2023 all the way through the breakout above in February 2024. Even during the August 2024 crash the total market cap almost reached that level but was slightly front-run, creating a low at $1.69T. Either way, the $1.61T level is likely to play a very significant role at the bottom of this cryptocurrency cycle if TOTAL loses the $2T level.
If you found value from this post you would also likely find value from my analysis on TOTAL2 and TOTAL3 bear market targets:

Technical Analysis – UBER UBER has remained in a well-defined long-term uptrend since mid-2022. Over the past two years, price action has traded within a rising channel, consistently respecting both the lower support trendline and the upper resistance boundary. The most recent correction toward the lower bound of the channel resulted in a decline of approximately 37%, representing a healthy pullback within the broader bullish structure rather than a deterioration in trend.
Following the successful retest of the lower channel support, price has shown a notable reaction off those lows, followed by two consecutive attempts to reclaim and break above the most recent local resistance area — a key signal that buyers are actively defending current levels. More importantly, the latest rebound has managed to break above the short-term descending parallel channel that had been containing the correction, suggesting that bearish momentum is beginning to fade.
From a price structure perspective, the recent formation also resembles a potential double bottom, a classic reversal pattern that typically signals exhaustion in selling pressure and opens the door for a continuation move to the upside if confirmed with a breakout above neckline resistance. Momentum indicators are beginning to align with the bullish thesis. On the RSI, we can observe an early breakout signal, often considered a leading indication of improving momentum. Meanwhile, the MACD is currently developing a bullish crossover, reinforcing the possibility of a trend reversal in favor of buyers.
Adding a fundamental sentiment layer, recent insider activity shows a purchase of approximately $1.6 million by the company’s CFO, representing a 357% increase in their position at the end of February — a signal that may strengthen bullish conviction from a positioning standpoint.
As long as price holds above the recent support zone, the technical structure favors a continuation toward higher levels and a potential retest of the upper boundary of the broader ascending channel.

NAS100 Buy 4 Hoursif that top gets broken we are going higher. We might see a little pull back but that should not affect the SL and TP. TP could be higher.

S&P 500 (ES) Analysis, Key Zones & Setup for Tuesday (April 28)S&P 500 E-mini (ES) Analysis, Key Zones, Setups for Tuesday (April 28)
Market Structure
The S&P 500 closed Monday at 7,173.91, up 8.83 points or 0.12 percent, after tagging a fresh 52-week intraday high at 7,178.74 and absorbing a routine pullback to 7,146.72. The cash session range printed a contained 32 handles, well inside the 0.63 percent statistical 1-day move expected for the date. ES futures extended modestly into Globex, settling near 7,205. The Nasdaq 100 finished essentially flat with NDX at 27,288.25, a decline of 0.03 percent, as megacap technology bid stayed concentrated in single-stock semiconductor leaders rather than the broader index. The VIX shed 0.77 percent to 18.03, WTI June futures settled at 96.37 with a 2.09 percent gain on continued Strait of Hormuz friction, Brent settled 2.75 percent higher at 108.23, gold gave back 0.81 percent to 4,679.20, and the dollar index held flat near 98.5. The session matched the muted base case priced into the dealer-positioning model, with realized volatility compressed under positive gamma and the index closing within five points of an all-time high.
A multi-indicator composite reading for SPX printed 72 percent BUY on Monday, with strength rated Good and direction Strengthening. Yesterday read 72 percent BUY, last week read 40 percent BUY, last month read 40 percent SELL, a clean four-week trend acceleration. Short-term signals print a 100 percent BUY bucket. Long-term signals print a 100 percent BUY bucket. The medium-term bucket sits at HOLD on lagging 50-100 and 50-150 moving-average crossovers that have not yet flipped. Those residual SELL prints will convert if SPX holds above 6,900 for another one to two weeks. The 14-day RSI at the 70-percent trigger price of 7,158.21 sits just below current spot, the kind of overbought print that tends to persist inside a strong trend rather than mark an immediate top.
Key Levels (SPX cash , ES futures)
Upside resistance zone
- 7,283 ES, secondary upside target
- 7,272 ES, third-level pivot resistance
- 7,260 ES, 2-StdDev resistance band
- 7,254 SPX 7,222 / ES, primary gamma concentration above
- 7,241 ES, 1-StdDev resistance
- 7,236 ES, second-level pivot resistance
- 7,232 ES / 7,200 SPX, dealer call resistance and key magnet
- 7,216 ES, first-level pivot resistance
- 7,210 ES / 7,178.74 SPX, Monday high and 52-week intraday high
Mechanical pivots, derived from Monday high, low, close
- 7,180 ES / 7,148.91 SPX, Tuesday pivot point
- 7,216 ES / 7,184.76 SPX, Tuesday R1
- 7,236 ES / 7,204.43 SPX, Tuesday R2
Downside support zone
- 7,196 ES / 7,165 SPX, prior settle reference
- 7,189 ES / 7,158 SPX, dense support shelf
- 7,182 ES / 7,150 SPX, secondary dealer gamma concentration
- 7,178 ES / 7,146.72 SPX, Monday low
- 7,160 ES / 7,129.24 SPX, first-level pivot support
- 7,151 ES / 7,120.24 SPX, 1-StdDev support
- 7,133 ES / 7,101.67 SPX, 2-StdDev support
- 7,127 ES / 7,095 SPX, volatility inflection level
- 7,124 ES / 7,093.39 SPX, second-level pivot support
- 7,105 ES / 7,073.72 SPX, third-level pivot support
- 7,049 ES / 7,017 SPX, dealer gamma flip level
- 7,032 ES / 7,000 SPX, primary gamma concentration below
- 6,832 ES / 6,800 SPX, primary downside protection wall
Primary Setup, Short Fade at Call Resistance
Bias, SHORT into the 7,200 SPX , 7,232 ES dealer call concentration
Entry, 7,228 to 7,236 ES, equivalent 7,196 to 7,204 SPX
Stop, 7,247 ES , 7,215 SPX
TP1, 7,210 ES , 7,178 SPX
TP2, 7,196 ES , 7,165 SPX
TP3, 7,182 ES , 7,150 SPX
Invalidation, an hourly close above 7,236 ES or 7,204 SPX flips the setup toward the alternate breakout configuration.
Alternate Setup, Long Bounce at Support
Bias, LONG on retest of the 7,180 to 7,185 ES , 7,148 to 7,151 SPX support shelf
Entry, 7,180 to 7,185 ES, equivalent 7,148 to 7,151 SPX
Stop, 7,170 ES , 7,138 SPX
TP1, 7,200 ES , 7,168 SPX
TP2, 7,215 ES , 7,184 SPX
TP3, 7,232 ES , 7,200 SPX
Invalidation, a sustained move below 7,170 ES rotates price toward 7,160 and 7,127 ES, and stand-aside on longs becomes correct.
Short-Bias Continuation Scenario
Bias, SHORT only on a clean break of 7,182 ES , 7,150 SPX with the volatility index above 19
Entry, 7,178 to 7,184 ES on a failed reclaim from below
Stop, 7,190 ES
TP1, 7,160 ES , 7,129 SPX
TP2, 7,127 ES , 7,095 SPX
TP3, 7,105 ES , 7,074 SPX
Invalidation, a reclaim of 7,190 ES or VIX slipping back under 18 kills the setup.
Long-Bias Breakout Scenario
Bias, LONG on an hourly close above 7,232 ES , 7,200 SPX with internals confirming
Entry, 7,235 to 7,240 ES on the retest of the broken call resistance
Stop, 7,225 ES
TP1, 7,254 ES , 7,222 SPX
TP2, 7,272 ES , 7,240 SPX
TP3, 7,283 ES , 7,251 SPX
Invalidation, a fade back below 7,225 ES voids the breakout and cycles the structure back toward the primary fade.
Bias
Constructive but consolidative into Tuesday, April 28. Monday closed at a fresh 52-week intraday high inside a positive-gamma dealer configuration that compressed realized volatility and matched the muted base case. The week carries three tier-one catalysts that dominate tactics: the FOMC rate decision Wednesday, April 29 at 2:00 PM ET, the post-decision Powell press conference at 2:30 PM ET, and the megacap earnings stack scheduled for Wednesday after the close including MSFT, GOOGL, META, AMZN, and QCOM. AAPL reports Thursday after the close on April 30. Tuesday is the only quiet US data day of the week, sandwiched between a calm Monday and a binary Wednesday, which argues for measured size and pre-event positioning rather than fresh directional commitments.
Night Session Forecast
Globex reopens Monday April 27 at 6:00 PM ET. The overnight window carries a Bank of Japan press conference on a tentative schedule, a Japanese Industrial Output Preliminary Month-over-Month print, and an Australian Manufacturing PMI Final, none of which are direct SPX catalysts but each of which can move JPY pairs and shape global risk tone into the Tokyo and London handovers. Drift inside 7,196 to 7,210 ES is the base case under the positive-gamma configuration. A breach above 7,232 ES, the dealer call concentration, opens a Tokyo-session push toward 7,254 to 7,272 ES that primes a continuation entry on the Tuesday April 28 9:30 AM ET cash open. A loss of 7,196 ES in Asia rotates structure toward the 7,182 to 7,185 ES support zone and primes the alternate long-bounce setup. The 10:00 AM ET CB Consumer Confidence print on Tuesday April 28 is the first scheduled US catalyst that can break the overnight balance.
Morning Session Forecast
The cash open at 9:30 AM ET on Tuesday April 28 sets up around the prior close of 7,173.91 SPX and 7,205 ES. The 9:30 to 9:45 AM ET opening range carries elevated weight given the absence of US data before 10:00 AM ET. Primary decision zone is 7,196 to 7,210 ES. A hold above 7,210 with constructive internals trends into the 7,232 ES dealer call concentration through the 10:00 AM ET CB Consumer Confidence release for April, the first scheduled US catalyst of the session. A loss of 7,196 ES and an hourly close beneath the cash-open VWAP rotates price toward the 7,180 to 7,185 ES support zone and primes the alternate long-bounce entry. The 11:30 AM ET US 2-Year Treasury auction adds a mild rates wobble but rarely sets equity direction.
Afternoon Session Forecast
The 12:00 PM to 4:00 PM ET window on Tuesday April 28 carries the 1:00 PM ET US 5-Year Treasury auction as the only scheduled domestic event, with pre-FOMC positioning the dominant flow. Pre-event positioning into a 2:00 PM ET Wednesday April 29 rate decision typically adds a cautious bid on constructive structure and trims size into the close. If the morning session held above 7,196 ES, the afternoon path leans toward a measured grind into 7,232 ES with profit-taking by 3:00 PM ET. If the morning broke below 7,182 ES, the afternoon base case is a bounce attempt to reclaim 7,196 ES followed by a second leg lower into the 3:30 to 4:00 PM ET cash close, with 7,127 ES as the next real support tested. The 4:00 PM ET cash close caps the regular session, and Globex continues into the overnight window ahead of the 8:30 AM ET Wednesday April 29 housing-permits, housing-starts, and durable-goods data and the 2:00 PM ET FOMC decision.

SILVER XAGUSD silver price will still drop,allow it to come to demand zone .
what is silver??
Silver is a rare, shiny, silvery‑white metal with the chemical symbol Ag and atomic number 47. It is one of the best electrical and thermal conductors among metals and is also valued as a precious metal for coins, jewelry, and investment.
A naturally occurring metallic element mined from ores and often recovered as a by‑product of copper, lead, and zinc refining.
Structurally a dense, malleable, ductile metal with very high reflectivity and excellent electrical conductivity, which makes it useful far beyond jewelry and coins.
Industrial applications in medicine
Silver’s key role in medicine comes from its strong antimicrobial (antibacterial, antifungal, antiviral) properties at low concentrations.
Common medical uses include:
Wound dressings and bandages: Silver‑coated or silver‑impregnated dressings (e.g., silver sulfadiazine, nanosilver) help prevent infections and speed healing in burns and chronic wounds.
Medical devices: Catheters, endotracheal tubes, and implants are often coated with silver to reduce the risk of device‑related infections such as urinary‑tract infections or ventilator‑associated pneumonia.
Surgical tools, implants, and dental use: Silver‑alloy coatings on prostheses (e.g., hip/knee joints) and dental materials (fillings, silver diammine fluoride) help control infection and slow tooth decay.
Industrial applications in military
In defense, silver is mainly used where maximum electrical reliability, corrosion resistance, and durability are critical.
Typical military uses:
Electronics and avionics: High‑reliability electrical contacts, switches, relays, and connectors in aircraft, missiles, radar, and satellite systems often use silver‑based coatings or plating because of its unmatched conductivity and low contact resistance.
Guidance and weapon systems: Silver appears in guidance electronics, fuses, and control systems of missiles and precision weapons where failure is not acceptable.
Optics, coatings, and batteries: Silver’s high reflectivity makes it useful in mirrors, laser systems, and night‑vision equipment; silver‑zinc batteries are used in some military and space applications for their high power‑density.
Silver in solar energy
In solar panels, silver is used primarily in conductive pastes that form the front and back electrical contacts of photovoltaic (PV) cells.
Key points:
Silver paste electrodes: A fine grid of silver‑based conductive paste is screen‑printed on silicon wafers; this grid collects electrons generated by sunlight and carries current out of the cell with minimal resistive loss.
Efficiency driver: Silver’s extremely high electrical conductivity helps maximize power output, especially in advanced cell designs like TOPCon and HJT, which can use 10–22 mg of silver per watt of panel capacity.
Scale of use: Solar already accounts for a large share of industrial silver demand (roughly 10–19% of global silver use), and that share is rising as PV installations grow worldwide.
Largest silver deposits in the world
Mount Isa (Australia): Among the biggest known silver‑rich deposits, with total silver resources estimated around over 1 billion ounces, mostly as a by‑product of lead–zinc mining.
Udokan (Russia): One of the largest undeveloped copper–silver deposits, with combined silver resources also in the hundreds of millions of ounces.
Polkowice‑Sieroszowice & Rudna (Poland): Massive underground copper‑silver operations operated by KGHM; each site holds over 1 billion ounces of silver equivalent in reserves/resources.
Penasquito (Mexico): Often cited as the largest silver mine by reserves, with proven and probable silver reserves above 850–900 million ounces, plus significant gold, lead, and zinc.
Major silver‑focused deposit countries
The top reserve holders globally include Poland, Mexico, Peru, Australia, Russia, and the United States, where many of these giant deposits sit.
Largest silver miners (companies)
Key global silver mining companies, ranked by scale and output, include:
Fresnillo plc (Mexico): One of the world’s largest primary silver producers, operating major mines like Fresnillo, Saucito, and San Julián.
Pan American Silver (Canada): Large‑scale operator with mines across the Americas (e.g., Mexico, Peru, Argentina), producing tens of millions of ounces annually.
Hecla Mining (USA): One of North America’s largest silver producers, with mines such as Greens Creek (Alaska) and Klondike (Idaho).
First Majestic Silver (Canada): Vertically integrated Mexican‑focused producer operating several pure‑silver mines.
Industrias Peñoles (Mexico): A major Mexican diversified metals company and one of the largest silver producers by volume.
my directional bias is bullish, but i have pull back zone based on the price action.
the breakout of the long descending trendline could be retested again and give a good market reset for silver price or it keep buying to the moon.
#silver #xagusd #dollar #us10y #dxy #metal

btcusdquick analysis with failure of breaking higher highs, hence the MSS and formed FVG which has been respected and taking quick shorts

Slight Lean Towards Bearish BreakdownMarket had a strong impulsive move up
Then transitioned into tight, choppy consolidation
Price is forming lower highs into a flat support (~49,000)+
Buyers: defending the same level repeatedly → there’s demand at ~49k
Sellers: stepping in earlier each time → increasing aggression
The pattern is valid but not clean
Price action inside is:
Choppy
Wicky
Not sharp rejections
What I’m expecting (probabilities)
Slight bearish lean
Because:
Lower highs are consistent
Buyers are not pushing higher anymore
If support breaks → likely fast move down
But not high conviction
Because:
Support has held multiple times
No aggressive selloff yet
Market is still deciding

BPL – Channel Breakout Attempt | TPs: 37 → 40 → 42+BPL – Channel Breakout Attempt | Reversal Setup
CMP: 30.78 | Time Frame: Medium Term | Risk: Moderate–High
BPL is attempting a breakout from a falling channel, signaling early signs of trend reversal after prolonged downtrend. Recent bullish candles indicate strong demand returning near the base (20–24 zone).
👉 Buying Range: 28.5 – 31
👉 Stoploss: 26.10
A sustained breakout above 32–34 zone can trigger upside toward 37 → 40 → 42+ levels, aligning with key Fibonacci resistances.
Structure remains constructive as long as 26 holds, positioning BPL as a high-risk, high-reward reversal play.
Disclaimer:
This content is for educational purposes only and should not be considered financial or investment advice. Market investments carry risk, and prices can move against expectations. Always perform your own analysis or consult a licensed financial advisor before making any trading decisions. TradeFlow Advisors is not responsible for any losses incurred.

XAGUSD IS STILL SELL DOWN $60 XAGUSD is currently in consolidation trend am am still going to be positioning for a sell entry on any pull back into a sell zone till target 60.00 is completed

S&P500: Imminent collapse to the 1week MA200.S&P500 / SPX is repeating the 2014-2015 Bear Cycle.
The 1week RSI is at a point where in 2014-2015 caused a rejection every time it hit its Falling Resistance.
Based on this, the market should make a massive correction to its 1week MA200.
Target 5800 long term.
Follow us, like the idea and leave a comment below!!

AUDJPY Wave Analysis – 27 April 2026 - AUDJPY reversed from support level 113.60
- Likely to rise to resistance level 116.00
AUDJPY currency pair recently reversed up from the support level 113.60 (former resistance from the start of March, acting as the support after it was broken earlier this month).
The upward reversal from the support level 113.60 continues the active intermediate impulse wave (5) from December.
Given the clear daily uptrend, AUDJPY currency pair can be expected to rise to the next resistance level 116.00 (target price for the completion of the active impulse wave (5)).

Google Wave Analysis – 27 April 2026
- Google broke pivotal resistance level 348,00
- Likely to rise to resistance level 360.00
Google earlier broke the resistance zone between the pivotal resistance level 348,00 (which stopped wave (5) in February) and the resistance trendline of the weekly up channel from November.
The breakout of the resistance level 348,00 continues the active short-term ABC correction 2 from the end of March.
Given the overriding daily uptrend, Google can be expected to rise to the next resistance level 360.00 (target price for the completion of the active ABC correction 2).

Nasdaq-100 Wave Analysis – 27 April 2026
- Nasdaq-100 index broke multi-month resistance level 26120.00
- Likely to rise to resistance level 28000.00
Nasdaq-100 index recently broke above the strong multi-month resistance level 26120.00 (which has been reversing the price from October).
The breakout of the resistance level 26120.00 accelerated the active short-term impulse wave 3 – which belongs to the intermediate impulse wave (3) from the start of April.
Given the clear daily uptrend, Nasdaq-100 index can be expected to rise to the next resistance level 28000.00 (target price for the completion of the active impulse wave (3)).

XAUUSDmy thought about gold movement shortly
the TP is 4665
we have 2 scenarios we will keep eyes on it
