Gold will continue to fallThe chart is a masterclass in trend continuation. After the initial "Wedge pattern" failure earlier this month, Gold has entered a secondary, more aggressive phase of distribution.
The Breakdown: We recently saw a clean exit from a massive Triangle pattern. This wasn't just a small slip; it was a structural shift that confirmed the bears are defending the $4,740–$4,760 zone with high volume.
The Retest (Current Play): Price has pulled back to "kiss" the underside of the descending Resistance line. Notice the red box—this is our high-confluence supply zone where the triangle's apex meets the diagonal ceiling.
Momentum: Every recovery attempt is getting shallower. This "lower high" sequence suggests that buyers are exhausted and institutional sellers are using these bounces to fill short orders.
The Downside Roadmap 🎯
If the current rejection at the red box holds, the path of least resistance is a straight shot toward the macro liquidity pool.
Entry Zone: $4,715 – $4,725 (The current Retest area).
Immediate Objective: $4,645 (The lower structural support marked by the grey box).
The Logic: In a broadening bearish structure, the price tends to hunt the previous major swing lows once a triangle support fails.
Stop/Invalidation: A clean 1-hour close above the dotted resistance line (approx. $4,735) would force a neutral reassessment.
Quick Take 💡
Don't be fooled by the minor green candles here. We are looking at a classic "Dead Cat Bounce" within a larger descending framework. The math is simple: as long as the diagonal resistance remains a ceiling, Gold is destined to test the $4,640 handle.
What’s your move? Are you shorting the retest at the red box, or waiting for a move back to $4,800? Let's hear it in the comments! 👇
Community ideas

The Ether Bull & New ATH · EMA13 Conquered · $3,730 Next!The 2025 bullish cycle really intensified once Ether moved weekly above EMA13. As soon this happened, ETHUSDT experienced sustained bullish action for months.
The bullish wave ended August 2025 with a test of EMA13 as support in September, then again October. When EMA13 broke as support, we saw months of bearish action.
The bearish period wasn't straight down, there was some relief in late 2025 until January 2026. In January, all growth stopped as soon as ETH faced EMA13 as resistance. Just one challenge of this level and a crash from $3,400 ended at $1,750, showing how important EMA13 is to determine mid-term price action.
After almost three months of consolidation, recovery and accumulation at bottom prices, after the 6-Feb low, ETHUSDT managed last week to move and close above EMA13, giving us the strongest bullish signal of all. This opens the doors for massive growth.
Just as in October 2025 a break below this level led to four months of bearish action; a break above in April 2026 can lead to several months of bullish action. All that is needed is a follow through this week.
If bulls/buyers show up at current prices, ~$2,400, we can expect a fast and sudden advance toward $3,730. That's our next target.
ETHUSDT just closed four consecutive weeks green after a long-term higher low. The path is open for a new all-time high long-term, and maximum growth short-term.
Thanks a lot for your continued support.
Namaste.

Bitcoin Tests Major Confluence ResistanceBitcoin is currently trading into a strong resistance zone, where multiple technical factors are aligning and creating a key decision point for price action. This region is acting as a major barrier, and the reaction here will likely determine the next directional move.
Key Highlights:
- Strong resistance confluence with 0.618 Fibonacci + daily level 🔺
- Declining volume on the move higher signals weak bullish momentum 📉
- Failure to reclaim opens downside toward low $70K support zone ⚠️
From a technical perspective, this area represents a high-probability rejection zone unless bulls can step in with conviction. The alignment of the 0.618 Fibonacci retracement alongside a well-established daily resistance level makes this a critical region where supply is likely to be present.
Additionally, the recent upside move has been accompanied by declining volume, which is typically a bearish signal. This divergence suggests that the rally may lack strength and could be driven by short-term positioning rather than sustained demand.
If Bitcoin fails to reclaim this resistance with strong volume and acceptance above the level, it significantly increases the probability of a corrective move. In that scenario, a rotation back toward the low $70K region becomes the more likely outcome, keeping the broader range structure intact.

Bitcoin at a Turning Point: Rally or Top? (12H)This analysis is an update of the one you can find in the related publications section.
The diametric structure we had identified for Bitcoin is still valid, but wave E has extended slightly.
In this update, we have optimized and revised the supply zone, and it is expected that wave E will complete within the red box.
However, since Bitcoin has broken a mid-term resistance trendline and there are still two waves remaining in the diametric pattern, we will consider two scenarios moving forward:
Scenario 1:
After the completion of wave E, if no deep drop occurs and wave F finishes within the green zone, Bitcoin could complete wave F, pull back to the broken trendline, and then form a strong bullish move as wave G potentially reaching up to the 90K range.
Scenario 2:
If wave F experiences a deep drop and the green zone is broken to the downside with strong 12 hour or daily candle bodies, it is likely that the top of this pattern has already been completed at wave E. In this case, we may not see significant bullish movement in wave G, and the price could move toward the 62K range.
Considering the ongoing tensions in the Middle East and how developments may impact the crypto market positively or negatively, we remain prepared for both scenarios. Therefore, monitor these key levels closely.
If you have a coin or altcoin you want analyzed, first hit the like button and then comment its name so I can review it for you.
Do you also think BITCOIN is bullish?

XAUUSD holds above 4,670 as gold targets 4,740 and 4,770 XAUUSD holds above 4,670 as gold targets 4,740 and 4,770 this week
Gold starts the week with a firmer technical tone after regaining balance above the 4,670 support area on the 3H chart. The early break in lower-timeframe structure has already been tested, and for now, price is showing that buyers are still willing to defend the near-term floor rather than surrender it.
That makes this week less about chasing momentum and more about whether gold can keep building above support without losing structure again.
At this stage, the chart matters more than the noise.
And the chart is showing a market that is trying to transition from short-term stabilisation into a more constructive recovery leg.
Technical Structure
From a technical perspective, gold has already reacted positively after testing the 4,670 support zone, which is now the key level holding the current bullish intraday structure together.
That area matters because it acts as the immediate base for the latest rebound attempt. As long as price remains above it, the market still has room to rotate higher and challenge the next resistance layers. Once a support level is tested and respected after a structure break, the focus usually shifts to whether price can extend cleanly into the next supply zone. In this case, the first level that matters is 4,740, followed by 4,770 if momentum continues to build.
The broader 3H chart also shows that gold is still trading under a descending resistance line from the previous swing structure. That means the market is improving in the short term, but it is not yet in full breakout territory. Buyers are gaining traction, but they still need to prove they can push through resistance instead of simply bouncing inside a wider corrective range.
Above that, the chart highlights a larger buy-side liquidity zone around the 5,000 region. That is not the immediate target for the start of the week, but it remains the broader upside reference if gold can continue holding its current base and build through the intermediate resistance layers first.
So the structure is currently clear:
4,670 is the key short-term support
4,740 is the first resistance test
4,770 is the next upside layer if momentum expands
holding above support keeps the bullish intraday structure alive
losing 4,670 weakens the current recovery view and forces a reassessment of direction
This keeps gold constructive for the start of the week, but still dependent on confirmation.
Key Technical Levels
Support: 4,670
This is the most important short-term floor on the chart. As long as price holds above it, the rebound structure remains valid.
First Resistance: 4,740
This is the first upside checkpoint. A clean push into this area would confirm that buyers are extending control from the current base.
Second Resistance: 4,770
If gold clears the first resistance zone, this becomes the next level where price may pause, consolidate, or face fresh reaction.
Broader Liquidity Zone: 5,000 area
This is the higher-timeframe upside reference shown on the chart. It remains relevant only if the current bullish structure continues to develop through the week.
Market Scenarios
Scenario 1 – Hold above 4,670 and push into 4,740
This is the preferred opening scenario for the week.
If buyers continue defending 4,670, gold may extend higher into the first resistance area near 4,740. That would confirm that the recent support retest has held and that the market is still building upward from the current base.
Scenario 2 – Consolidate around 4,740 before extending to 4,770
This is the constructive continuation scenario.
Gold may reach 4,740, pause, and then build sideways before attempting the next move higher into 4,770. That would fit a healthy market structure where momentum expands in stages rather than in one straight move.
Scenario 3 – Fail back below 4,670
This is the invalidation scenario.
If price loses 4,670 with clear downside acceptance, the current recovery structure weakens materially. That would suggest the recent upside is no longer holding and that the market may need to reset into a new short-term directional phase.
Market Insight
From my perspective, 4,670 is the line that defines the week.
As long as gold holds above that support, the structure still favours a push toward 4,740 first, and potentially 4,770 if buyers maintain momentum. But this is still a market trading inside a broader technical framework, not a fully confirmed breakout. That is why support matters more than excitement here.
For now, gold is holding structure well enough to keep the upside path active, but the recovery remains valid only while 4,670 continues to hold.

XAU/USD | Eyeing 4600! As you can see in the 4H chart of XAUUSD, it has been in a consolidation mood for some time and has been traded inside the same range for a while. After closing at 4709, it opened today at 4696 level and then it dropped all the way to the 4672 level, reaching the April 13th NWOG Low and then bounced back up, reaching the April 22nd NDOG and then dropped again, currently being traded at 4703.
I expect XAUUSD to drop considering the Geopolitical tensions and the increasing demand for Oil. If the 4700 support level is broken down strongly, it'll drop further to sweep the Minor SSL below the 4658 level, then to below the 4644 and finally 4638. If Gold fails to bounce back up from this support level which is the April 6th NWOG Low, further drop towards the 4550 level is expected.
However, if gold stabilize above the 4700 level, we could see a rise to 4710, then 4720 and then 4750 level. Finally if it manages break above the 4750 level, it'll go towards the massive April 20th NWOG Consequent Encroachment at 4802.

XAUUSD Gold Analysis Today | Bearish ContinuationGold (XAUUSD) continues to trade within a bearish market structure, with price forming lower highs and respecting resistance zones.
Currently, price is pulling back into a key sell zone between 4725 and 4755, aligning with previous supply and dynamic resistance. This area acts as a decision zone for the next move.
🔴 Scenario 1 (Primary – High Probability)
If price shows rejection inside the sell zone, we can expect bearish continuation. In this case, gold may move lower towards the 4700 support zone, with potential extension into the 4650 major demand area.
🟡 Scenario 2 (Alternative)
Price may first move higher to sweep liquidity above 4760 before reversing. This liquidity grab could trap buyers before the market continues lower.
Overall, the structure remains bearish, and pullbacks are considered selling opportunities. Traders should wait for lower timeframe confirmation (M5/M15 rejection or structure break) before entering trades.

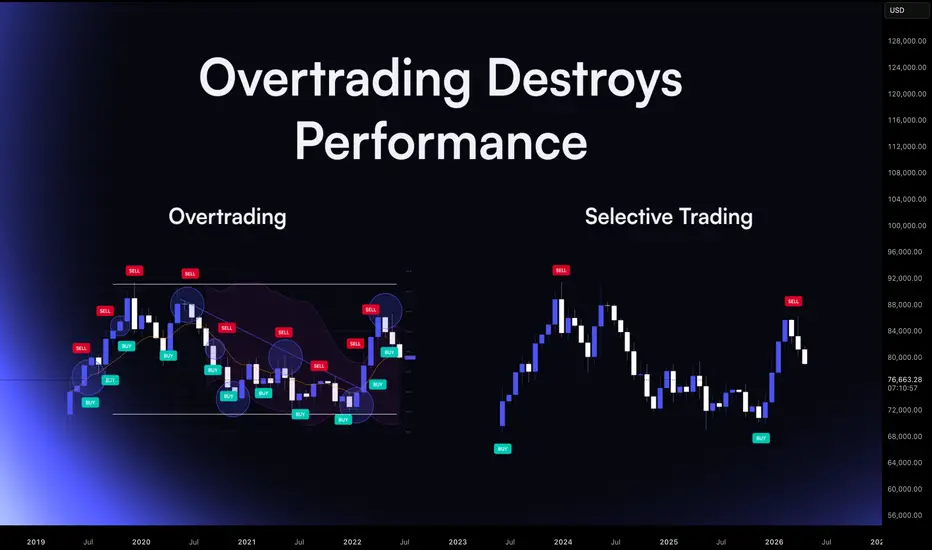
How Overtrading Slowly Destroys PerformanceOne of the most common reasons traders struggle to achieve consistency is not the strategy they use, but how often they trade. Many traders believe that more activity leads to more opportunity. In reality, excessive participation often leads to the opposite result.
Overtrading occurs when traders take positions that do not fully meet their criteria. The trades may look acceptable in isolation, but they lack the structural alignment that defines a high-quality setup.
This behavior usually develops gradually.
At first, the trader takes only clear opportunities. Over time, the desire to remain active increases. Charts are watched continuously, and small movements begin to appear significant. Trades that once would have been ignored start to feel justifiable.
The result is a higher frequency of trades with lower quality.
Each additional trade introduces risk. When these trades are taken without strong structural reasons, the probability of success decreases. Losses begin to accumulate not because the strategy stopped working, but because the trader stopped applying it selectively.
Another problem with overtrading is emotional fatigue.
Every trade requires attention, decision-making, and risk management. As the number of trades increases, mental energy becomes depleted. Decision quality gradually declines. Traders may begin to enter earlier than planned, move stops impulsively, or exit trades prematurely.
This degradation of execution often goes unnoticed at first.
Performance data may show several small losses rather than one large mistake. However, the cumulative effect becomes significant. Over time, a large number of marginal trades erodes profits that stronger setups could have produced.
Transaction costs can also amplify the problem.
Frequent trading increases fees and slippage, especially in fast markets. These costs may appear small on a single trade but become meaningful when multiplied across dozens of unnecessary positions.
Professional traders approach participation differently.
Instead of measuring productivity by the number of trades taken, they measure it by the quality of opportunities selected. Many experienced traders spend long periods observing the market without entering a position. Their goal is to wait for conditions where structure, liquidity, and participation align.
This selective approach reduces exposure to random price movement.
Fewer trades often produce clearer results. Each position is based on a defined thesis, risk is easier to manage, and emotional pressure remains lower because the trader is not constantly reacting to every movement.
The objective in trading is not to be active.
It is to be effective.
A strategy can only demonstrate its edge when trades are taken under the conditions it was designed for. Overtrading weakens that edge by introducing unnecessary exposure to environments where probability is unclear.
Consistency in trading rarely comes from doing more.
It comes from learning when not to act.
Bitcoin and the scenario in the coming daysBitcoin on today's timeframe was forming a descending price channel, which I had signaled. However, this channel was broken by a momentum candle, and now the price has broken the channel. Scenario 1: A retest of the yellow zone, which is a strong support area, and where the price also broke the descending price channel. Scenario 2: Continuation of the upward movement towards the demand zone, which is highlighted in yellow. Bitcoin is currently in a positive trend. Always remember: Trading is 90% patience and 10% execution. Trade safely. Omar Al-Shaaban

Gold Under Pressure: U.S.–Iran War and Geopolitical ShiftsCurrent Geopolitical Impact
Gold is trading near $4,679, but escalating U.S.–Iran tensions and the closure of the Strait of Hormuz are shifting global funds toward the U.S. dollar and oil markets. This diversion of capital weakens gold’s safe‑haven appeal in the short term, creating selling pressure. The chart’s descending channel and repeated lower highs support the bearish sentiment.
Short‑Term Traders
For short‑term traders, the current setup favors sell opportunities. With global funds flowing into USD and oil, gold could test the $4,400 support zone before any rebound. Quick entries on rallies into resistance zones may provide profitable short trades.
Long‑Term Traders
Long‑term investors should also consider strategic selling while tensions remain high. Sustained geopolitical instability may keep gold under pressure until a reversal pattern emerges. Patience is key — waiting for capitulation near strong support zones could offer better re‑entry points for accumulation.
What If War Stops?
If hostilities ease and peace talks progress, gold could reverse upward. Reduced geopolitical risk would weaken the dollar’s dominance, and investors would likely rotate back into gold as a hedge against inflation and long‑term uncertainty. In such a scenario, gold could reclaim levels above $4,800–$5,000.
Disclaimer
This analysis is based on the current geopolitical situation and is for educational purposes only. Investors should manage risk according to their portfolio size before entering trades.

XAUUSD H6: Gold Waits for a Breakout Week XAUUSD H6: Gold Waits for a Breakout Week
Gold is starting the week in a more constructive position on the H6 chart, supported by improving sentiment as hopes around US-Iran peace talks weigh on the US Dollar. At the same time, softer oil prices are easing inflation concerns and slightly reducing pressure for a more aggressive Fed path, which is giving gold room to stabilize ahead of the next key catalyst.
Still, with FOMC risk approaching and price stuck inside a defined range, this remains a market that requires patience rather than early conviction.
Fundamental backdrop
The current macro tone offers short-term support for gold.
A softer Dollar environment, helped by optimism around geopolitical negotiations, is reducing part of the pressure that had previously weighed on precious metals. Lower oil prices are also helping calm inflation expectations, which may limit the urgency for a more hawkish Fed stance.
That said, this support is not yet strong enough to confirm a full bullish breakout. With the market waiting for the upcoming FOMC meeting, gold may continue trading inside its current range until a stronger catalyst arrives.
Technical structure on H6
The H6 structure is shifting into a consolidation phase with a slight bullish recovery tone.
Price is currently moving sideways between 4694.610 support and the 4800–4853.400 resistance region. This range has become the key battlefield for the week. Buyers have managed to defend the lower area, while sellers are still capping price near the upper band.
The rising internal channel from the late-March recovery is still intact, which tells us the rebound structure has not fully broken down. However, the market has also struggled to clear the highlighted resistance zone around 4853.400, which keeps gold trapped in a wait-and-see phase.
Above that, the major upside draw remains the sell-side liquidity zone near 5200, but that scenario only becomes relevant if buyers can first break and hold above the current ceiling.
On the downside, 4498.428 remains the deeper buy-side liquidity zone, while 4128.863 is the broader weekly support if the market loses its current recovery structure.
What order flow is suggesting
Order flow currently suggests hesitation, not commitment.
buyers are still defending the lower range
price is holding above the rising recovery structure
sellers remain active below 4853.400
the market is likely to stay range-bound until FOMC or another major catalyst forces expansion
This keeps both sides in play, but for now the chart still slightly favors a recovery attempt as long as support continues to hold.
Trading scenarios
Scenario 1: Gold holds support and breaks higher
If price continues to hold above 4694.610 and reclaims 4853.400 with acceptance, gold may extend higher toward the next liquidity target.
Entry: confirmed break above 4853.400
SL: below the reclaimed resistance zone
TP1: 5000
TP2: 5200 sell-side liquidity
This is the bullish continuation scenario if buyers finally push the market out of consolidation.
Scenario 2: Sideways trading continues before FOMC
If gold keeps holding above support but cannot break 4853.400, price may remain trapped in a short-term range.
Entry: only on clear confirmation at range extremes
SL: outside the range
TP: opposite side of the range / intraday reaction levels
This is the most balanced scenario while the market waits for fresh direction.
Scenario 3: Support breaks and gold rotates lower
If price loses 4694.610 decisively, the recovery structure may weaken and open the way toward deeper support.
Entry: confirmed break below 4694.610
SL: above broken support
TP1: 4498.428
TP2: 4128.863
This would signal that buyers have lost control of the current rebound leg.
Key levels to watch
4853.400 → key resistance / breakout trigger
4800 area → upper range pressure zone
4726.995 → current market pivot
4694.610 → key support
4498.428 → buy-side liquidity
5200 → major upside liquidity zone
Conclusion
Gold begins the week with a mildly constructive tone, supported by a softer Dollar backdrop and easing inflation pressure, but the H6 chart still shows a market trapped inside a defined range ahead of FOMC. As long as 4694.610 holds, buyers still have a chance to challenge 4853.400 and push higher toward 5000 and potentially 5200.
For now, though, this is still a breakout market, not a trend market. The key for this week is whether gold can finally clear resistance, or whether the current sideways structure turns into another delayed rejection.

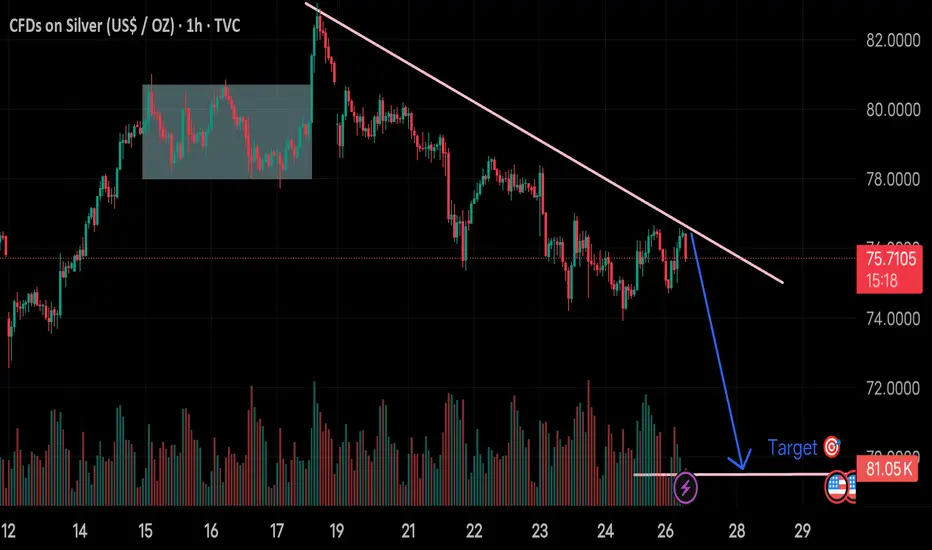
(Silver 1H chart)...(Silver 1H chart).
Price is trending down under a descending trendline
Recent structure shows lower highs + lower lows
I have already marked a horizontal support zone around ~70
Realistic downside targets
If that trendline holds and price rejects again:
Primary target:
70.0 – 69.5 (major support / liquidity zone — matches my marked area)
Extended target (if breakdown happens):
67.5 – 66.5 (next strong support range)
What needs to happen first
For my bearish target to play out cleanly:
Price should reject the trendline again (~76–77 area)
Then break below ~73.5 support with momentum
Invalidation
My idea weakens if:
Price breaks and holds above the trendline (~77.5–78)
Gold Pauses as Markets Await US–Iran DevelopmentsGold Pauses as Markets Await US–Iran Developments
Gold is well-positioned to rise at the moment, but the fact that the US and Iran seem unwilling to let go of the ropes could push the talks forward.
This is creating a pause in OIL and GOLD this week. The market will wait for a possible deal before moving.
If Gold starts moving before we have any news, it could be from insider trading that may know something in advance.
Even if gold moves down, we should be careful as it could rise again quickly given the geopolitical situation, but now also the economic one, which is not good.
You can find more details on the chart.
Thank you and good luck! 🍀
⚠️PS: Do your own analysis and use your own strategy to join the trade.
❤️ If this analysis helps your trading day, please support it with a like or comment ❤️

Bitcoin Rebound Scenario – Push Toward 79,000 IncomingHello traders! Here is my technical outlook based on the current BTCUSDT (1H) chart structure. Bitcoin previously traded within a range, showing consolidation before a breakout that confirmed bullish momentum. After the breakout, price continued higher and formed an ascending structure with consistent higher lows along the trend line. Currently, price is holding above the 77,000 buyer zone, which acts as strong support, while approaching the 79,000 resistance level (seller zone). At the same time, a descending resistance line is limiting upward movement, and a recent rejection suggests short-term selling pressure. As long as BTCUSDT holds above the 77,000 support and respects the ascending trend line, the bullish bias remains valid. I expect a potential rebound from this zone, which could push price toward the 79,000 resistance (TP1). Please share this idea with your friends and click Boost 🚀

This Level Has Just Stopped Bitcoin… And This Is Why!!! Major weekly barrier
~$78.4k is a clear resistance level from prior structure → price is reacting right into it
No reclaim yet
Price is at the level, not above it → nothing confirmed until we see acceptance beyond
Clean role flip zone
Previously acted as support → now acting as resistance → classic S/R flip test
Reaction matters more than arrival
The move into the level is irrelevant on its own → what happens here is what counts
Momentum still questionable
RSI rising but still below 50 → no strong confirmation behind the move
Binary outcome
Break and hold above = reclaim → bullish
Rejection here = confirms resistance → downside remains in play
In Summary
Bitcoin is sitting directly at a major weekly resistance around $78.4k, a level that previously acted as support and is now being tested as resistance. There is no confirmed reclaim at this stage, as price has not yet broken and held above the level. This makes the current reaction critical, with the outcome here likely to define direction. A clean move above would signal strength, while rejection would reinforce the level as resistance.

XAUUSD | 474x Sellers’ stronghold or the calm before a breakoutThere are times when the market moves with clarity.
And there are moments like now — gold is simply hovering, consolidating, testing traders’ patience.
After the pullback from 489x, price is compressing inside a range, and all eyes are now on 474x — the first major stronghold for sellers.
Key resistance levels:
474x — the most important resistance right now
477x — next upside test if 474x breaks
4795–4800 — major structure-defining zone
Key support levels:
467x — near-term support
464x — important lower boundary
4607–4600 — deeper support zone
My view
As long as 474x hasn’t been reclaimed decisively, I still lean toward a range-trading / scalp mindset, rather than chasing breakout moves.
Below 474x → market remains in a tug-of-war.
Break above 474x → potential move toward 477x.
Break above 4800 → then the broader narrative may shift.
For now, the market feels like it’s holding its breath ahead of bigger catalysts.
And often, after this kind of compression… comes a meaningful move.
Do you see 474x as a distribution zone for sellers, or a launchpad for a breakout?
Drop your view below — let’s discuss the next possible scenario.

AUDCAD Potential Upsides! Hey Traders, in today's trading session we are monitoring AUDCAD for a buying opportunity around 0.97600 zone, AUDCAD is trading in an uptrend and currently is in a correction phase in which it is approaching the trend at 0.97600 support and resistance area.
Trade safe, Joe.

EURJPY is new setup💱 EURJPY Trade Setup – Sell Opportunity 🔻
EURJPY is respecting a bearish trendline, with price currently reacting from a strong resistance zone — indicating potential downside continuation.
🔑 Sell Zone: 186.900
🎯 Targets:
✅ 1st Target: 186.800
✅ 2nd Target: 186.600
✅3rd Target: 186.400
⏱ Timeframe: 1h time
⚠️ Entry Confirmation:
Wait for clear rejection from resistance and bearish confirmation before entering the trade.
💼 Risk Management is Crucial
Always use proper stop loss & position sizing. Stay disciplined and protect your capital.
💬 Like | 🔁 Follow | 💭 Comment | 📤 Share for more setups 📊

BITCOIN DAILY PERSPECTIVE USING THE MARKET STRUCTURE STRATEGY.FOR REFERENCE ,MARKET STRUCTURE NEVER LIES.
THE CURRENT BTC PRICE IS 78,200.
Bitcoin lacks buy momentum in this season, sell bias still very much strong.
the structure of the market on weekly and daily have upside potential but limited by monthly chart ,technically sellers are holding and looking for another sell opportunity to sell,pls dont be a victim.
what is bitcoin??
Bitcoin is the world's first decentralized digital currency, often called "digital gold," that enables peer-to-peer transactions without banks or governments. Created in 2008 by the pseudonymous Satoshi Nakamoto, it operates on a public blockchain ledger.
Core Concept
Bitcoin (BTC) functions as a form of money stored and transferred digitally via cryptography. Unlike traditional currencies, no central authority controls it—transactions are verified by a global network of computers (nodes) using proof-of-work consensus. New bitcoins are "mined" through this process, with a fixed supply cap of 21 million coins
How It Works
Every transaction records on the blockchain—a tamper-proof chain of blocks containing details like sender, receiver, amount, and timestamp. Miners compete to solve complex puzzles to validate blocks, earning bitcoin rewards while securing the network against fraud. Wallets store private keys for access, but bitcoin itself lives on the blockchain.
History and Adoption
Launched in 2009, Bitcoin gained traction as an alternative to fiat money post-2008 financial crisis. El Salvador briefly made it legal tender from 2021-2025. Today, it's the largest cryptocurrency by market cap, used for payments, investments, and as a hedge against inflation.
#bitcoin #btc
Goodluck

GOLD DAILY CHART MARKET ANALYSISHey Everyone,
We are currently observing a range bound market structure, with price action trading between the 4587 Goldturn support and the 4900 Goldturn resistance levels.
There remains an unfilled retest zone near 4900, and as long as the 4587 support level continues to hold, the market is likely to move upward to revisit this area at somepoint.
Key confirmations to watch:
A strong candle body close above or below these levels and/or 5 EMA crossover, accompanied by a lock above or below the range boundaries.
This will help confirm the next directional move and establish a new trading range.
Additionally, the Goldturn ascending channel structure will play an important role:
The channel floor, midline, and ceiling will act as dynamic support/resistance.
These levels will help confirm the overall trend direction and market structure.
We will continue to monitor price action closely and provide updates as the market develops.
Mr Gold

TradeCityPro | Bitcoin Daily Analysis #285👋 Welcome to TradeCity Pro!
Let’s move on to Bitcoin analysis, today the market is sitting at a very important spot inside its range.
⌛️ 4-Hour Timeframe
Bitcoin is still moving inside the range between 77,369 and 79,285. After some buying volume entered the market and pushed price to the top of the range, it got rejected and moved back toward the bottom of the box.
📊 On the RSI, the key support within this range is the 50 level, and price has reacted to it. If this ranging continues for longer, momentum will drop even more, and RSI will become less reliable.
✨ Right now, a break below 77,369 is not a strong short trigger. However, if price continues ranging inside the box and starts showing bearish signs, this level could turn into a valid short trigger later.
🔍 On the other hand, a break above 79,285 would give us a long position. Breaking this level could be the start of the next bullish wave.
❌ Disclaimer ❌
Trading futures is highly risky and dangerous. If you're not an expert, these triggers may not be suitable for you. You should first learn risk and capital management. You can also use the educational content from this channel.
Finally, these triggers reflect my personal opinions on price action, and the market may move completely against this analysis. So, do your own research before opening any position.

GBPCHF Potential Upsides!Hey Traders, in tomorrow's trading session we are monitoring GBPCHF for a buying opportunity around 1.06000 zone, GBPCHF is trading in an uptrend and currently is in a correction phase in which it is approaching the trend at 1.06000 support and resistance area.
Trade safe, Joe.

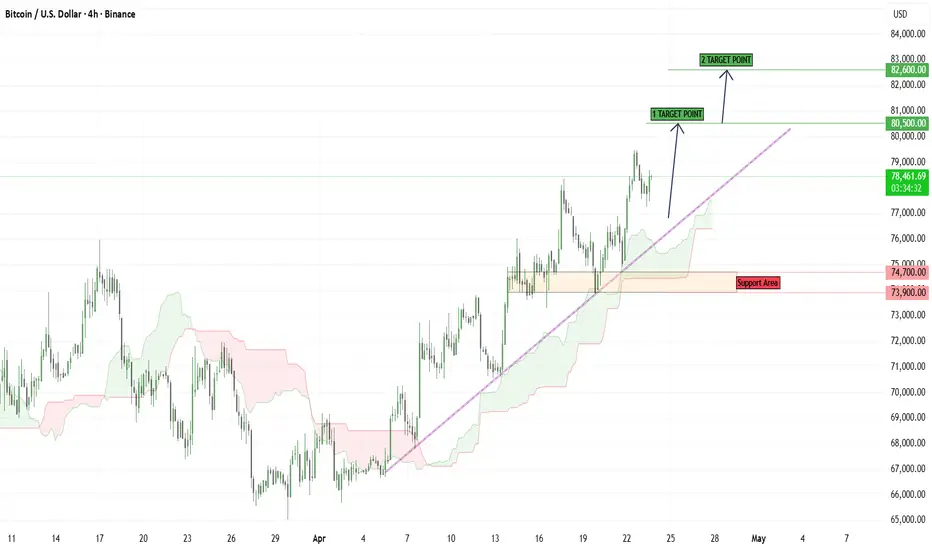
BTCUSD – Trend Continuation Analysis📊 BTCUSD – Trend Continuation Analysis
🔍 Market Overview
Bitcoin has developed a clean upward trajectory, supported by a rising trendline and consistent demand reactions from lower levels. The market has transitioned smoothly from accumulation into a bullish expansion phase, reflecting strong underlying buying interest.
Recent price action shows controlled pullbacks rather than aggressive sell-offs, indicating that buyers are actively defending key levels and maintaining bullish dominance.
📈 Structural Perspective
* Trend Bias: Bullish (trend-following environment)
* Price Behavior: Higher highs & higher lows intact
* Current Positioning: Holding above dynamic trendline support
The structure remains technically strong as long as price continues to respect the ascending support and avoids breaking below recent higher lows.
🚀 Trade Outlook
✅ Bullish Case (Preferred Direction)
Requirements:
* Price sustains above 74,000 support region
* Trendline continues to act as dynamic support
* Momentum candles support continuation
Execution Idea:
Focus on buying pullbacks into support or trendline with clear bullish confirmation.
🎯 Upside Target 1: 80,500
🎯 Upside Target 2: 82,600
❌ Bearish Case (Structure
Failure)
Requirements:
* Break below trendline with strong bearish close
* Loss of support zone validity
Execution Idea:
Short positions become valid on a retest of the broken structure.
🎯 Downside Target 1: 72,000
🎯 Downside Target 2: 69,500
📍 Key Price Zones
🔴 Resistance Levels: 80,500 – 82,600
🟢 Support Area: 73,900 – 74,700
⚠️ Breakdown Level: Below 73,500
⚠️ Market Behavior Note
The current move reflects a healthy bullish trend, where price is respecting structure and moving in waves. This type of price action often leads to continuation rather than reversal unless a clear structural breakdown occurs.
🧠 Trading Edge
Best opportunities exist in:
* Controlled pullbacks within trend
* Retests of trendline support
* Breakout continuation setups
Avoid chasing strong impulsive candles — patience improves entry quality.
🛡️ Risk Control
* Maintain low risk per trade (1–2%)
* Always define invalidation before entry
* Let price confirm before reacting