UNIP – Scrap Value vs. Financial Reality UNIP – Scrap Value vs. Financial Reality 📉📦
The Reality: A classic "Value Trap" in the penny stock realm. 🕸️
While revenue sits at EGP 1.37 billion, net income has collapsed by 87% to a mere EGP 13.05 million.
With a razor-thin net profit margin of 0.95%, the company is effectively dancing on the edge of a loss. ⛸️🔴
The Cash Squeeze: The balance sheet is under heavy fire. 📉
Less than 40% of operating profit is turning into cash, as liquidity remains trapped in slow-moving inventory.
With a staggering 111.7% Debt-to-Equity ratio, UNIP is gasping for air in this high-interest environment.
It’s currently "dead money" unless a miracle restructuring or merger occurs. 🩹🏦
The Valuation: On paper, it looks like a bargain, trading at EGP 0.28 less than half its Book Value of 0.63 EGP. 📚
While my mathematical Fair Value estimate of 0.380 EGP (using a recovery P/E of 18.5x) suggests upside, the market is currently pricing it at "scrap" value for a reason. 🧱⚖️
Sharia Status: ❌ Non-Compliant. UNIP fails the quantitative screens for the EGX33 Shariah Index (April 2026).
The heavy debt used to finance production and non-permissible interest income from its cash management break both the 30% and 5% thresholds. ☪️🚫
Verdict: A Cyclical Gamble.
UNIP is at a "Cyclical Bottom," but without a catalyst, it’s just a falling knife.
I don't even need to technical analysis this stock; enter at your own risk, but at least wait until it is over 0.30. 🛡️📉
If you like my posts, please follow and boost 🙌
🎁 Get a $15 discount on your next subscription:
🔗 www.tradingview.com ✨💸
Community ideas

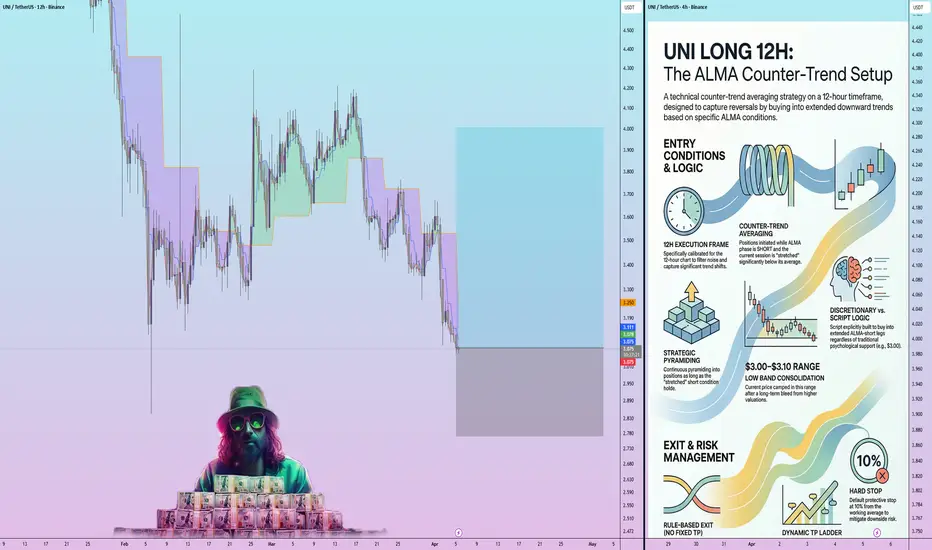
UNI LONG — ALMA Avg Strategy | 05.04.2026This trade — execution frame
New long leg from ALMA Avg Strategy: counter-trend averaging while ALMA phase is SHORT and the short session is stretched vs its average (then pyramiding while the condition holds). Exits are rule-based: ALMA flips LONG with a long session long enough vs average — not a fixed TP ladder. Default hard stop in the script: 10% from working average (unless the chart instance uses breakeven / other inputs).
Tape read
Price is camped in the low ~3.00–3.10 band after a long bleed from higher — a discretionary “support story” only matters here because the script is explicitly built to buy into extended ALMA-short legs.
Snapshot — what actually screams
Formal tile: 1H ALMA Overheat Short — current short run more than double its typical length — same family as “keep shorting until it snaps.” EMA side is uglier: every TF in the export reads Below the stack, with short runs huge vs averages (15m and 1H Cur S in the 30s–40s vs single-digit norms). Dev% ramps from tiny on 15m to absurd on 1W — the weekly number is the regime outlier; this is deep discount vs EMA, not a mild dip. ALMA board: 4H/1D/3D/1W still SHORT while 15m–1H have flipped LONG in the later snapshot — bounce machinery on small TFs, HTF still wearing the short jacket.
SMC — current and recent
4H bar in the log: not inside an OB/FVG “zone” on that template — no free pass from structure. Recent ledger is a bear-FVG ladder stepped down through ~3.24 → ~3.17 with raids; a breaker-bull marker printed ~3.237 — ammunition for a relief bounce, but overhead bear FVGs are fresh. Same stream: fractal low broken, RSI(9) oversold, long-liquidation flags on 4H/1D — flush language around the lows.
Derivatives — skew (flow strip on idea)
Funding slightly negative, OI rolling off prior highs, long liquidations clustered on the dip, account long/short split modestly long but not euphoric, CVD uninspiring — fits a bounce attempt without a clean “everyone already agrees” bid.
Social — attention vs sentiment
Sentiment stays hot while Galaxy, dominance, and activity fell off the February–March hype cliff — loud bulls in a quiet room. Good for stubborn dip culture; bad if the next leg needs fresh retail oxygen.
Holders (charts default: ≥ $10k notional and ≥ 0.1% of supply)
In the holder strip shown: USD held by the $10k+ cohort and the count of those addresses compressed with price — mid-tier balances got marked down. The opposite side: tokens held at ≥0.1% of supply and the number of such addresses drifted up through the drawdown — top-heavy wallets absorbing flow. Read as concentration into fewer, larger bags; not a timing signal, a positioning backdrop.
Network (short)
From ~11 Feb onward, the count of addresses holding any balance trends down — churn at the small-holder edge, not a widening base. New-funded and day-to-day activity sit near baseline after the earlier spike — participation cooled with price, which is a headwind for “everyone’s stacking” narratives.
Financial (short)
TVL and large-ticket flows read choppy-to-quiet; metrics like realized cap / NVT / long-dormant supply (where shown) point to a heavy, sticky stock of coins and valuation vs transfer noise — supports “holder base exists,” not “green tomorrow.”
Bull case
Overheated ALMA short + obese EMA short persistence + weekly deviation extreme = rubber-band fuel. Holder panel divergence (whale tokens up, $10k cohort squeezed) matches a supply handoff story. Strategy fired the buy side of its counter-trend book.
Bear case
Backtest on the same visual run carries a nasty max DD vs middling PF — averaging in a structural bleed hurts. SMC overhead is bear-FVG heavy; social has no megaphone; flow has no CVD hero. On-chain: shrinking address-with-balance count since mid-February undercuts broad retail accumulation.
Plume Network · Dumb bears vs the Altcoins Master (Guru Ananda) You know, it doesn't really matter if 100% of the futures accounts are bearish, it doesn't mean anything to me and to you. It doesn't mean the market will crash for sure.
If the majority of traders are bearish and piling up billions of dollars worth of shorts, knowing what we know, it simply reveals that all these people are about to incur a huge loss.
It doesn't really matter what the majority has to say. Technical analysis is not about a majority, being right is not about following the herd, the crowd—Crypto is going up.
It is unavoidable because it is already happening.
I have all these people arguing with me, telling me that I am wrong. I cannot be wrong, I am the Master of the charts.
Right or wrong is not decided by you, your thinking, your comments or your believes. It is decided by the market, I share what I see.
You have your point of view and I have mine. You say what you think and I continue to translate the charts—the market will take care of the rest.
You can be 100% bearish and trust me, I do not care. Crypto is going up. Bitcoin has been growing for months.
My analysis says the market will continue rising. You? You are trading based on emotions. You are making predictions based on assumptions. You are wrong.
Bitcoin is going up. As Bitcoin continues to rise, it will lift PLUMEUSDT higher and all the other altcoins. It is not hard to see and predict because it has been happening for months, many months.
Three months already the crash ended, it is not hard.
So, are you going to show up right now, in this present moment in time, in late April 2026 and join the bullish train?
Are you going to remain stuck in a bearish wave that ended so long ago?
Why would you argue with me?
Why would you read this post?
If you cannot see what I see, you are just dumb.
I am sorry, this is not an insult, it is a statement of facts. Each post, each publication comes with a chart. My analysis cannot be invalidated, it is already too late.
Either you accept what I am saying and join reality, or you are going to lose once more, you will lose again.
We are LONG. The market is going up.
Would you like to bet?
Hahahahahah!
Thank you for reading.
Your continued support is highly appreciated.
Namaste.

Key Bullish Factors for Gold# Key Bullish Factors for Gold
🏦 1. Central Bank Purchases Provide Strong Support, Limiting Further Declines (Core Medium-Term Support)
95% of global central banks plan to increase their gold holdings by 2026. China, India, and Turkey have been buying against the trend, increasing their purchases as prices fall. The 4650-4680 range represents the medium- to long-term cost line for global central banks and institutions. Once gold prices fall to this range, passive buying, bargain hunting, and concentrated central bank purchases will emerge, forming strong buying support and limiting further declines. Historical data shows that since 2025, every time gold prices have touched the 4650-4680 range, a rebound of 30-50 USD has occurred. Currently, 4695 is above the cost line, with extremely limited downside potential and a high probability of a bottoming out and rebound.
💵 2. The Fed's interest rate meeting is highly likely to release dovish signals, reversing expectations (core bullish catalyst). Currently, market expectations for rate cuts are low, with only a 36.8% probability of a September rate cut. However, the market widely expects today's meeting to release dovish signals, a downward revision of interest rate expectations in the dot plot, and Powell's hints at a September rate cut and a slowdown in balance sheet reduction. If these expectations materialize, it will directly strengthen rate cut expectations, cause a sharp drop in the dollar and US Treasury bonds, lower real interest rates, and an influx of funds into gold, pushing gold prices above $4750 and targeting $4780-$4820. Historically, on days when the Fed releases dovish signals, gold has a 90% probability of rebounding by $40-$60. Today's expectation reversal makes a bullish move for gold highly certain.

BTCUSDT 4H — Compression Before Expansion1. Bearish Shift in Structure
Price has moved below both the 5MA and 20MA, and the 5MA has crossed below the 20MA. The structure is now 20 > 5 > 60, indicating short-term weakness.
2. MA Compression Forming
At the same time, the moving averages are starting to cluster together. This compression often signals indecision and reduced momentum.
3. High Probability of Expansion
When MA lines converge like this, it usually precedes a larger move. The market is building pressure, and a breakout in either direction becomes more likely.
4. What I’m Watching
* Breakout direction from this compressed structure
* Expansion in volatility
* Whether price reclaims or loses key MAs
5. Prepare, Don’t Predict
This is not a moment to guess direction. Instead, I prepare for expansion and react once the market shows its hand.

EURCAD Long
EURCAD Buy entry @1.59595
SL 1.59259
TP1: 1.59975
EURCAD is currently trading within a defined price action structure. Price has tested a key liquidity zone, aligning with the order-flow bullish readings. The valuation tool is undervalued short-term against the Dollar. I will expect EURCAD to gain some value soon. Let's see if this plays out.
Trade Plan: Long
Bias: Bullish short term.
Entry reason: Price about to test key liquidity zone 30min-1Hr.
Stop Loss: Below nearest low.
First target: 1.59975

XAUUSD (Gold) Long Setup – Discount Accumulation Bullish BiasThis setup is essentially the inverse of your USDJPY short—here you’re looking to buy low (discount) after sell-side liquidity has been taken, aligning with a potential shift from bearish exhaustion into bullish expansion.
1. Market Context (Structure Shift Potential)
Leading into this zone, price has been:
Printing lower highs and lower lows
Showing clear bearish structure (multiple BOS to downside)
However, the key detail:
👉 Momentum is slowing as price reaches lower levels
This suggests:
The move down is becoming exhausted
Smart money may begin accumulating
2. Sell-Side Liquidity Taken (PDL Sweep)
Price taps into:
PDL (Previous Day Low)
Discount zone
Marked strong low / demand area
This is critical because:
Markets often reverse after taking liquidity—not before
You now have:
Stops triggered below lows
Liquidity filled
Fuel for reversal
3. Discount Zone = Institutional Buy Area
Your entry sits inside the discount portion of the range, which is exactly where buyers want to operate.
Below equilibrium → cheap pricing
Reaction already visible → early demand stepping in
This aligns perfectly with:
Buy low → sell high logic
4. Early Confirmation Signs
You’re not blindly catching a falling knife—good.
Signs already forming:
Initial bounce from PDL
Minor internal BOS to upside (on lower TF)
Slowing bearish momentum
Still, the strongest confirmation would be:
Break of a recent lower high
Followed by a higher low formation
5. Entry Strategy
Your positioning suggests:
Entry: Within discount / just above demand
This is aggressive but efficient
Safer refinement:
Wait for:
5M–15M bullish engulfing
Or micro BOS before full position
6. Stop Loss Placement
Your stop below the lows is well placed:
Below liquidity pool
Below structural invalidation
If price breaks lower:
→ The accumulation idea is wrong
7. Target Logic (Clean & Logical)
Your targets are structured properly:
TP1: Equilibrium (mean reversion)
TP2: Premium zone
TP3: PDH (Previous Day High)
This creates:
👉 A clear liquidity draw above
And a strong:
👉 Risk-to-reward profile (~3–5R depending on hold)
8. Confluence Factors
This setup works because multiple things align:
Sell-side liquidity sweep (PDL)
Discount pricing
Demand zone reaction
Bearish momentum weakening
Clear upside liquidity target (PDH)
That’s a strong institutional framework.
9. What Could Go Wrong (Invalidation)
Be realistic—this is still counter-trend (for now).
Risks:
Price consolidates and continues lower
No bullish follow-through after entry
Strong bearish displacement reappears
If that happens:
→ It’s not accumulation, it’s continuation
10. Key Execution Advice
The only real improvement here:
Don’t rely solely on the zone—wait for proof of intent.
Best trigger:
Break of minor structure high
Then enter on pullback
Final Take
This Gold long setup is a high-quality reversal opportunity based on:
Liquidity sweep at lows
Discount accumulation
Early bullish reaction
If confirmation follows, this can transition from:
Counter-trend bounce → full bullish reversal leg

Tensor (TNSR) has high bullish potential —Easy 1,222% or higher Taurus is the sign of the bull in astrology. I am not surprised at all to see a bullish Cryptocurrency market. It would be sad to have a bear market in the sign of the bull.
I am seeing something interesting here, what about you?
How do you do?
How are you feeling in this wonderful new Monday?
Is life giving you change, new, different and excitement? or, are you caught in the same repeating pattern?
Tensor—TNSRUSDT
The highlighted candle is an inverted hammer. A higher low and also the ended of the down-move that started in November 2025. It has high volume.
The end thus far. This can be taken as a reversal signal but this reversal signal is only confirmed when the market actually reverses. There you have an oxymoron.
A reversal signal doesn't work until an actual reversal shows up... Uh, what to do with these things?
Well, the signal alerts you that a reversal is possible. If it shows, good. If it doesn't, wait for the next one.
Or, look for supporting signals. The higher low (April 2026 vs October 2025). The MACD, RSI and so on. Bitcoin being strong, etc.
You get my point?
If your life has been stuck in a pattern that continues to repeat itself, it means you need change.
Change can come through a simple decision: Decide or ask for it, or life will force it on you.
I am changing every single day. So does the market, Bitcoin and the charts.
Tensor is going up.
Thank you for reading.
Namaste.


WLFI 1D – Breakdown Below Descending Channel SupportWLFI on the 1D timeframe is currently trading around 0.0724 after breaking down below the lower boundary of a descending parallel channel that has been defining the structure since the February highs.
Price had been making lower highs and lower lows inside the channel throughout February, March, and April. The recent breakdown below the lower channel boundary near 0.0760–0.0770 accelerated the sell-off and price is now sitting at the lowest levels on this chart.
There is no visible structural support below current levels.
Key Levels To Watch
0.0980–0.1000 → Upper channel boundary, major resistance
0.0900 → Lower channel boundary, now resistance above
0.0810–0.0840 → Prior consolidation zone, now overhead resistance
0.0760–0.0770 → Broken channel support, now resistance
0.0705–0.0724 → Current price, all-time low territory
Below 0.0705 → No structural support, open air below
The structure is fully bearish. Every prior support level has been broken and is now acting as resistance above.
A recovery back above the broken channel support near 0.0760 would be the first sign of stabilization and suggest the breakdown may be fading.
Continued rejection below 0.0760 keeps the path of least resistance toward new lows with no clear support levels in sight.
Structure is bearish.
Recovery only on reclaim of 0.0760 broken channel support.
Below 0.0705 opens room toward new lows with no structure below.


I see a push up for Gold.Based on Gold being bearish and rejecting a bullish push and what I see, I think it’s time for Gold to start reaching again.

BITCOINBitcoin has a short-term rise for this discount then return to the 75462 area, according to the time until 2026/5/2 is the deadline to reach the target.
if you are using exchange {Ku coin}, you can now copy trade with me and avoid heavy losses try it once.
follow my trading view page to stay up to data.

April 28, 2026 - XAUUSD GOLD Analysis and Potential Opportunity📊 Summary:
Price action this week has been relatively structured, making it suitable to trade around key support and resistance levels. Focus on the 4658–4667 support zone—if price breaks below, watch 4645. A further break below 4645 could open a downside channel.
On the upside, a break and hold above 4730 would signal bullish strength. If price fails to break 4730, it is likely to range between 4667 and 4730 until the Federal Open Market Committee (FOMC) meeting on Wednesday, which may provide clearer direction.
Stay patient and let the levels guide your bias.
🔍 Key Levels to Watch:
• 4741 – Resistance
• 4730 – Resistance
• 4718 – Resistance
• 4700 – Resistance
• 4690 – Support
• 4677 – Support
• 4667 – Support
• 4658 – Support
• 4645 – Support
📈 Intraday Strategy:
SELL: If price breaks below 4686 → target 4682, with further downside toward 4677, 4672, 4667
BUY: If price holds above 4697 → target 4700, with further upside toward 4703, 4710, 4718
If you find this helpful or traded using this plan, a like would mean a lot and keep me motivated. Thanks for the support!

Morning Star appearing on bigger tf.NRL Analysis
Closed at 384.64 (27-04-2026)
Morning Star appearing on bigger tf.
Immediate Support seems to be around 350 - 355.
However, it should not break 258 - 259 even in worst case.
Upside resistance seems to be around 430 & then around 480 - 500.

Long trade
5min TF Entry
📊 DOGEUSDT Continuation (NY Ssession Expansion)
🧭 Trade Overview
Pair: DOGEUSDT
Direction: BUY
Session: NY Session PM
Model: SNAP B — Continuation
🧠 Market Thesis
Price action formed a clear range during Asia/London, building liquidity on both sides.
The NY session delivered a strong breakout with displacement, confirming buyer intent.
A controlled pullback into a single FVG / demand zone provided an entry before continuation.
👉 Structure confirms:
Range → Breakout → Pullback → Expansion
🔍 Key Confluences
✔ Defined range (liquidity build)
✔ Breakout with momentum (displacement)
✔ Clean pullback into value (FVG / demand)
✔ Reaction entry (no chasing)
✔ NY session timing (expansion window)
🎯 Trade Plan
Entry: 0.09741
Stop Loss: 0.09710
Take Profit 1: 0.09856 (internal liquidity)
Take Profit 2: 0.09987+ (external highs)
Risk-to-Reward: ~7.9R
⚡ Execution Insight
Entry was taken:
At discount pricing
Inside a single clean FVG zone
After breakout confirmation
👉 This is reactive execution, not predictive trading.
📈 Structure Model
Range (Liquidity Build)
Breakout (Displacement)
Pullback (FVG / Demand)
Entry (Reclaim + Reaction)
Expansion (Continuation)
⏱ Outcome
Status: 🟢 In-play / Working (based on chart)
Structure: Holding above pullback zone
Momentum: Gradual expansion

Bitcoin Monthly Chart: Long-Term Structure & Two Macro ScenariosBitcoin remains inside a long-term ascending channel on the monthly timeframe (log scale). Unless the lower boundary of this structure breaks, the broader macro uptrend remains intact.
Key observations:
- Price continues to trade within the rising channel
- RSI is compressing after previous cycle highs
- Monthly volume has gradually declined during consolidation
- No clear capitulation volume signature has appeared yet
In prior cycles, large red monthly volume spikes often marked late-stage bottoms or major reset zones. A similar signal has not appeared so far in this cycle.
That leaves two primary scenarios:
Scenario 1 (My base case)
One more corrective move into the liquidity zone. BTC could revisit the lower part of the current liquidity pool (~53–54k), or even sweep deeper into the 45k–37k region before resuming the uptrend.
Scenario 2
The cycle low is already in. BTC holds above the 60k area, avoids a deeper retracement, and continues the macro uptrend from current levels.
The projected path on the chart is only my visual expectation. Visible patterns often invalidate before completion.
This is my personal view of the current market structure — not financial advice.

Continue to short gold on reboundsWhat recent news has influenced gold prices? How should we assess the future direction of gold?
Following the announcement of the extension of the US-Iran ceasefire agreement, the US dollar remained under pressure, and gold prices rebounded to a new intraday high, recovering from the support level of $4705. Trump announced the extension of the ceasefire on Tuesday without mentioning a timeframe, attempting to create conditions for peace negotiations. However, the Iranian Revolutionary Guard stated that Iran had not requested an extension and threatened to break the blockade by force. The US continues its blockade of Iranian cruise ships, and the standoff in the Strait of Hormuz remains unresolved. The dollar's decline has been significantly limited, and gold price gains have been suppressed accordingly. Gold bulls need to remain vigilant.
Warsh bluntly stated that the Federal Reserve's long-term policy mistakes, which led to runaway inflation after the pandemic, have already eroded its market credibility. Only by fundamentally reshaping its operating model can it rebuild public trust and achieve its interest rate cut goals. For gold trading, the expectation of interest rate cuts theoretically benefits non-interest-bearing gold, but simultaneous quantitative tightening will withdraw market liquidity, push up real interest rates, and significantly suppress gold prices.
Gold price trend analysis:
Today's gold trading recommendations focus on the resistance level of $4776-80 and the support level of $4600. Currently, you can consider shorting gold around $4740.

META @ 678.59 — range-bound, levels matterMETA is sitting at a crossroads. Price is testing right up against the daily 200 SMA at 679.73 — essentially at the doorstep of the first real structural test above the recent recovery move. We've come a long way off the recent pivot low, but the weekly setup is still transitional, and this level right here is where that story either advances or stalls.
This is not a clean breakout zone. It's a decision point.
**1. Context — Transitional, Not Yet Resolved**
The bias is neutral, and the reason is worth understanding: price is above the weekly 50 SMA at 678.28, but the weekly 21 at 642.61 is still below the weekly 50. That's not a confirmed bullish structure. That's a market that's repaired some damage but hasn't finished the work yet. Until the weekly 21 crosses back above the weekly 50 and price holds above both, we're in a transitional phase — not a clean trend environment in either direction.
The weekly 200 SMA at 449.98 and the weekly 300 SMA at 394.51 are far enough below price that they're not part of the near-term conversation, but they frame the macro floor if this move were to deteriorate significantly.
**2. Pattern/Setup — Recovery Off Lows, Now at a Real Test**
META has been in a meaningful recovery off the recent pivot low at 520.26. The daily structure has been constructive — price has been grinding back through key moving averages on the daily chart, reclaiming the daily 21 at 627.05 and the daily 50 at 630.43. Both of those are now clearly below price, which is a healthy sign for the recovery thesis.
But the pattern signal here doesn't carry high conviction. What we have is a trend-in-progress that's now walking into overhead supply. The move up has been real, but calling this a clean trend environment at current levels would be getting ahead of the structure. We need to see what price does at the daily 200 and the recent pivot high before assigning this a clear directional label.
**3. Key Resistance — Two Levels That Matter**
The first level I'm watching is the daily 200 SMA at 679.73. Price is essentially sitting on it right now at 678.59. This is where the recovery rally meets one of the most watched moving averages on the daily chart. A clean break and sustained hold above 679.73 is the first confirmation bulls need. Without it, this is still just a test.
Above that, the next meaningful resistance is the recent pivot high at 691.52. That's the level where price last failed on the way up — and for the structure to shift decisively bullish, that swing needs to be taken out. A hold and close above 691.52 would open the path toward 744, which is the next resistance level above that. Getting to 744 would require meaningful momentum and a real shift in the weekly setup.
**4. Key Support — Layers Behind the Move**
If price fails here at the daily 200 SMA, the first significant support I'm watching is the POC at 663.83. That's where the bulk of the volume has traded, and it tends to act as a gravitational zone — pullbacks that hold the POC keep the recovery structure intact.
Below that, 630.27 is the VAL (value area low), which lines up closely with the daily 50 at 630.43 and the nearby support level at 628.15. That cluster is a meaningful confluence zone — if we pulled back into that area and held, I'd consider the broader recovery still healthy. A break below the VAL and the daily 50 would start to do real damage to the short-term bullish case.
Below that, 600 is a round-number support level worth noting as the next line of defense. And the weekly 21 at 642.61 sits in between — worth watching on a weekly close basis as the structure continues to evolve.
The recent pivot low at 520.26 is the level that defines the bigger picture. A move back toward that area would represent a full structural breakdown and is not in the base case, but it marks the range floor.
**5. Targets**
On the upside, the sequence is straightforward: clear and hold the daily 200 at 679.73, take out the pivot high at 691.52, and the path opens toward the VAH at 727.22. Beyond that, 744 is the resistance target for a more extended move. On the downside, a failure here points back to the POC at 663.83 first, then the support cluster in the 628–630 range.
**6. Indicator Confluence — Extended But Not Overheated**
The daily RSI at 62.38 is in healthy territory — above the midline, not yet in overbought range. There's room to run on the daily momentum picture if price can hold above the key levels. No bearish RSI divergence is present, which means the move up hasn't been showing the kind of momentum degradation you'd want to see before fading a trend.
The daily Stochastic RSI is worth noting: the K line is at 61.16, slightly below the D line at 66.60. That's a mild bearish cross setup developing, though not yet confirmed as a reversal signal — more of a caution flag than a sell signal. If K continues lower and price fails to hold above the daily 200, that stoch setup becomes more meaningful.
Weekly RSI at 53.93 is constructive — mid-range, with room to develop in either direction. The weekly Stochastic RSI is elevated: K at 89.71, D at 78.91. That's a stretched weekly reading. It doesn't tell you price is about to fall, but it does mean that if price stalls at this resistance zone, the weekly setup would be ripe for a pullback that could carry further than most expect.
**7. Levels at a Glance**
Resistance / Upside (above price):
* 679.73 — Daily 200 SMA, immediate overhead test
* 691.52 — Recent pivot high, structural confirmation level
* 727.22 — VAH, volume area high
* 744.00 — Next major resistance above the pivot high
Support / Downside (below price):
* 663.83 — POC, high-volume zone, first pullback support
* 642.61 — Weekly 21 SMA, transitional structure level
* 630.27 — VAL, value area low
* 630.43 — Daily 50 SMA, key moving average confluence
* 628.15 — Near-term support, tight cluster with daily 50 and VAL
* 600.00 — Round-number support, next defense below the cluster
* 520.26 — Recent pivot low, macro range floor
**Final Thoughts**
The structure is cleaner than it's been in a while, but META is now at the hardest part of the recovery — testing through the daily 200 SMA with a transitional weekly setup and an elevated weekly Stochastic RSI reading. That's not a reason to abandon the bull case, but it is a reason to demand confirmation rather than assuming continuation.
Bull case: Price holds above the daily 200 SMA at 679.73, clears the pivot high at 691.52 with conviction, and the weekly setup continues to repair. That path points toward 727.22 and eventually 744.
Bear case: Failure to hold above 679.73 — or a false breakout that fades back below — shifts focus to the POC at 663.83 and the confluence zone in the 628–630 range. A weekly close back below the weekly 50 at 678.28 would put the whole recovery narrative back in question.
**Bottom Line**
META is at the daily 200 SMA with a transitional weekly setup — this is the test that determines whether the recovery has legs or whether we're about to give some of it back. Watch the close, demand confirmation, and know your levels on both sides.
No hype. No bias. Just levels.
Trade safe. Plan ahead. Win together.

MU @ 525.23 — bullish, trade with the trendMicron is trading at 525.23, sitting just below the value area high of 528.78 and well above every meaningful moving average on both the daily and weekly timeframes. The structure is about as clean a bullish trend as you'll find — but at these levels, extended momentum and thin resistance overhead create a setup where the next few sessions matter. Either price consolidates constructively and builds a base for continuation, or a rejection here unwinds some of the move and brings us back to test the levels that actually built this trend.
This is a high-momentum, high-risk-of-mean-reversion zone. Worth watching closely.
**1. Context — Bullish Structure, No Debate**
The weekly picture is straightforward and the bias is bullish. Price is trading above both the weekly 21 SMA at 386.49 and the weekly 50 SMA at 252.39, and the weekly 21 is sitting well above the weekly 50 — that's a clean trending structure with plenty of space beneath. There's no ambiguity in the macro setup: MU is in a bullish trend until those weekly moving averages are threatened.
The daily structure reinforces it. The daily 21 is at 424.01 and the daily 50 at 417.02 — both well below current price, both close to each other, which tells you the trend has been persistent and the market hasn't needed to retest those levels in a while. That gap between price and moving averages is worth noting — it's not a warning sign on its own, but it does mean any meaningful pullback could travel further than it feels like it should before hitting real support.
**2. Pattern/Setup — Trending, But Extended**
There's no clean flag or wedge to label here with conviction, so I'll call it what it is: an extended uptrend that has pushed into the top of the value area. Price has been moving higher, the pivots confirm it — the recent pivot high came in at 471.34 and the recent pivot low was 311.49 — and the overall structure is bullish. What we don't have right now is a well-defined continuation setup with a clear trigger. We're at a point where price is pressing against the VAH at 528.78 and the move is asking for either a breakout with follow-through or a pause to digest.
The ATR of 26.59 tells you daily ranges are wide. Entries and stops need to be sized accordingly.
**3. Key Resistance — Above Price**
The resistances list is empty in the data I have, so the levels above current price that matter are derived from the volume profile and structure.
The first and most immediate level is the VAH at 528.78. That's where the value area ends, and price is essentially sitting at the door right now at 525.23. A clean break and daily close above 528.78 opens up blue sky territory above the established value range — that's the bull trigger at the top of the current structure.
Beyond that, the next reference point is the daily 21 SMA at 424.01 — but that's below price, not a resistance. Without additional charted resistance levels above the VAH, 528.78 is genuinely the line in the sand. Above it, price is in uncharted territory relative to the volume profile, which can mean fast moves in either direction.
**4. Key Support — Downside Levels to Know**
The first thing below current price that matters structurally is the VAL at 363.62 — that's the lower bound of the value area. A move back toward this level would be significant and would represent a real retest of the distribution's floor.
Tight in above that is support at 363.90, essentially sitting on top of the VAL and reinforcing it. Below that is another cluster at 357.67, which gives that zone a little more body — three references converging in the low-360s means that area is meaningful if we ever get there.
The POC at 379.11 sits between the VAL and the daily SMAs. It's the highest-volume price in the profile, so if we're pulling back and the trend is still intact, 379.11 is where the market has spent the most time and is likely to find interest again.
Below all of that, the daily 21 at 424.01 and daily 50 at 417.02 are the first meaningful moving average supports on the way down. A pullback that holds those SMAs keeps the daily trend fully intact.
The weekly 21 at 386.49 is further down and would only be relevant on a larger corrective move — but it's worth knowing where it lives. Below that, 311.49 is both the recent pivot low and a charted support level, the macro floor on any significant drawdown.
**5. Targets — What a Continuation Looks Like**
If price clears and holds above the VAH at 528.78, the path of least resistance is continuation into open space above the value area. Without charted resistance levels above that point, the move can extend quickly. Sizing risk off the ATR of 26.59 gives a rough one-ATR extension target near 555 on a clean breakout — but that is an ATR projection only, not a charted level, so treat it as a guide for range expectation rather than a destination.
On the downside, a retest of the daily SMAs in the 417–424 range or the POC at 379.11 would be healthy consolidation inside an intact trend. A break below 357.67 changes the character of the move.
**6. Indicator Confluence — Stretched, But No Reversal Signal Yet**
Daily RSI is at 73.2 and weekly RSI is at 73.73. Both are in overbought territory. That alone doesn't mean a reversal is imminent — RSI can stay elevated in a strong trend — but it does mean the setup is not low-risk for new longs chasing here. The margin for error is narrow.
Daily Stochastic RSI is essentially maxed out: the K line is at 96.6 and the D line is at 93.8, with the stochRSI reading itself at 100. You don't get more stretched than that on the daily. This isn't a sell signal by itself, but it tells you that any hesitation in price will flip this reading quickly, and a rollover in the stochastic while RSI fails to make a new high would be worth watching as an early warning.
Weekly Stochastic RSI is in a different position entirely — K at 46.1 and D at 34.7, stochRSI at 54.4. That means the weekly momentum structure is only mid-range, not overbought. The weekly timeframe still has room to run, which is what gives the bullish case legs. The daily is the one doing the warning for now.
No bearish RSI divergence is present on the daily. Until that prints, the trend has no confirming reversal signal — just extended readings.
**7. Levels at a Glance**
Resistance / Upside (above price):
* 528.78 — VAH, top of value area, bull trigger above this level
Support / Downside (below price):
* 471.34 — Recent pivot high, prior swing resistance turned reference
* 424.01 — Daily 21 SMA, first moving average support on a pullback
* 417.02 — Daily 50 SMA, near-term trend anchor
* 379.11 — POC, highest volume price, strong pullback magnet
* 363.90 — Charted support, just above VAL
* 363.62 — VAL, lower bound of value area, key structural support
* 357.67 — Charted support, reinforces the 363 cluster
* 311.49 — Recent pivot low and charted support, macro floor
**Final Thoughts**
The structure is bullish and there's no serious argument against that. Price is above every relevant moving average, weekly SMAs are stacked correctly, and no bearish divergence has printed. The problem isn't the trend — it's the entry. MU is pressing the ceiling of its volume profile with daily momentum indicators at or near maximum readings and a wide ATR that makes sizing uncomfortable at these prices.
Bull case: Price breaks above 528.78 cleanly and holds. Daily stochastic resets through base-building rather than rolling over. Weekly stochastic continues higher from its mid-range position. That combination keeps the trend alive and targets an ATR-driven extension above the value area.
Bear case: Rejection at 528.78, daily stochastic rolls over from maxed-out levels while RSI starts to fade. That opens a move back toward the daily SMAs in the 417–424 zone at minimum, and a deeper corrective leg toward the POC at 379.11 or the support cluster in the low-360s. The weekly structure stays intact through all of that — this wouldn't be a trend reversal, just a healthy mean reversion inside a larger uptrend. But "healthy" pullbacks with a 26.59 ATR still move.
**Bottom Line**
MU is in a clean bullish trend pressing up against the VAH at 528.78 — a breakout above there is the bull trigger, but if you're entering here, the daily is fully extended and the risk-reward is not in your favor without a confirmed hold above that level.
No hype. No bias. Just levels.
Trade safe. Plan ahead. Win together.

Gold Trade IdeaGold H1 trend is bearish and Printing Lower Highs and Lower Lows.
Currently Price is ranging in Contracting Decending Triangle and if it breaks immediate support, we can witness and sharp move till 4500
Buy above 4740 breakout and retest
Sell below 4657 Breakout and retest

EURAUD WEEKLY CHART.EURAUD exchange rate currently is 1.63094 in the forex window across all central banks.
key technical information to note and why we have a massive sell of the EURAUD.
the head of RBA=The Governor is Michele Bullock, who commenced her term on September 18, 2023.
the RBA CASH RATE =4.10%
What is the cash rate? The cash rate is the interest rate that banks pay to borrow funds from other banks in the money market overnight. It influences all other interest rates, including mortgage and deposit rates.
In technical terms, it is the interest rate on unsecured overnight loans between banks (loans banks use to manage their liquidity)
The cash rate has a strong influence over interest rates in the economy, such as lending and deposit rates. In turn, these interest rates influence economic activity, employment and inflation. This affects all Australians, not just those with a mortgage.
the head of ECB=The President of the European Central Bank (ECB) is Christine Lagarde, who has held the position since November 2019. She leads the ECB's decision-making bodies, including the Governing Council, which is responsible for setting monetary policy for the eurozone.
ECB Interest Rates
The ECB Governing Council sets three key interest rates to steer monetary policy and manage liquidity in the banking sector. As of April 2026, the current rates, which have been effective since June 11, 2025, are as follows:
Main Refinancing Operations 2.15%
Marginal Lending Facility 2.40%
Deposit Facility 2.00%
The Governing Council continues to utilize these rates to maintain price stability, with a primary goal of keeping inflation at 2% over the medium term. The interest rates remained unchanged during the most recent policy meeting in March 2026.
the ECB 10 year treasury bond yield EU10Y=3.039%
the RBA 10 year treasury bond yield AU10Y=5.27%
The interest rate differential=2.1% FAVOUR EURAUD SELL
the bond yield differential=2.231% FAVOUR EURAUD SELL
the carry trade=FAVOUR SELL
MARKET STRUCTURE the rejection of the weekly descending trendline from the line was a higher time frame sell confirmation with the rising AU10Y.
upcoming economic docket will play a role in the next direction of trade as ECB will hold a key meeting soon.
#ECB #EURAUD #EU10Y #AU10Y
