The STG structure is turning bearish (4H)A bearish iCH can be seen in the internal structure, indicating that the larger trend may soon turn bearish.
We have marked a zone on the chart for a potential downside price rejection. In that area, after getting confirmation, one can look for sell/short positions.
Targets are marked on the chart. Move your stop to breakeven at the first target.
A daily candle close above the invalidation level will invalidate this analysis.
If you would like us to analyze a coin or altcoin for you, first like this post, then comment the name of your altcoin below.
What is your opinion about STG?
Community ideas


BTC Strong push… but failure to capitaliseDrive into highs stalls
Strong impulsive move into ~$79.4k, but no follow-through → buyers couldn’t extend the breakout
Tight consolidation
Price now chopping just below highs → typical pause, but also where distribution can form
Wedge structure building
Higher lows pressing up, but momentum compressing → classic late-stage move behaviour
Support doing the work
~$76.7k holding with trendline + 50 EMA → keeping structure intact for now
Momentum divergence
RSI showing bearish divergence while holding above 50 → underlying strength fading
Decision point
Hold and break higher = continuation
Lose support = confirms cracks and likely deeper pullback
In Summary
Bitcoin made a strong push into the highs near $79.4k but failed to follow through, instead entering a tight consolidation phase. This could be a pause before continuation, but the lack of momentum raises concern. Price is holding above key support around $76.7k, keeping structure intact for now. However, RSI divergence suggests fading strength. This leaves Bitcoin at a decision point, where holding support favours another push higher, while a breakdown would signal a deeper pullback.

ETHEREUM / ETHUSDT SELL SHORTETHUSDT SELL SHORT
- Ethereum Bearish Market Structure in HTF is Bearish Market is on W SIBI , market will respect & with Creat Liquidity on it , go to LTF ( H1 / M15 ) after All Liquidity Sweep & See a Valid MSS Conformation Then Enter with Proper SL & Hold for a Long Target , Target SSL .
NOTE - IN LTF after Valid Mss then Enter , Use For Sell Entry Use SIBI / AB / OB / PB / SZ
- Enjoy Floks .................................
------------ICT TRADER------------------

TeslaHi everyone 🌟
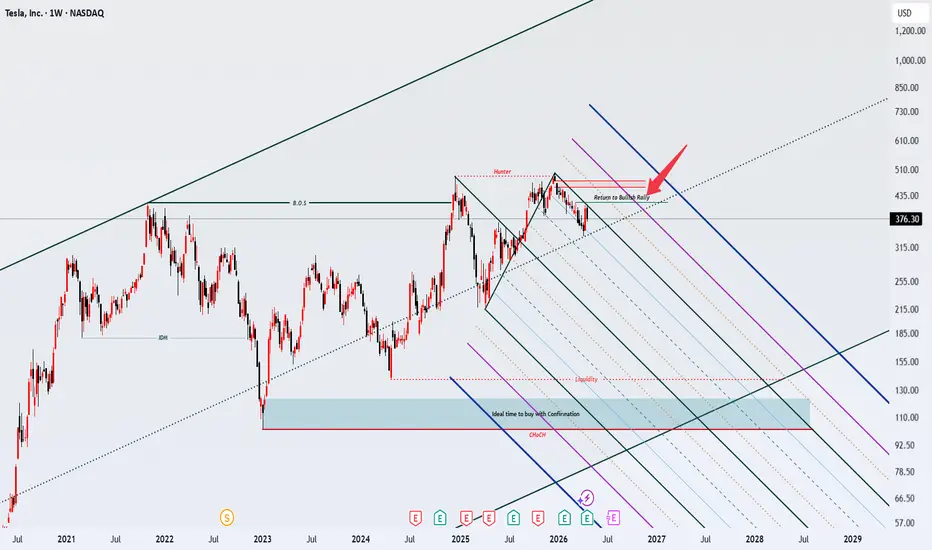
This is a long-term analysis of Tesla. I’m speaking directly to Tesla holders, so I’m sharing one of the best viewpoints I have—so they can push this analysis and move toward success with confidence.
Just look how simple I said it… and how clear it is!
After a big weekly BOS and a sweep of the highs, price is currently pulling back inside a very clean channel. But keep in mind: this is happening inside a bigger upward channel.
So once the market has collected liquidity, it should continue back toward the upside.
I want to emphasize this: if price returns to the target, we should see the bullish move continue again—likely a small correction, followed by a sharp upward move.
So we should pay close attention to when this stock starts to actually run. It’s better to monitor it carefully, but don’t get emotional and don’t buy in a rush.
Thank you, my dear followers.
Unfortunately, these days I don’t have a good internet connection to post lower-timeframe signals. Please forgive me.
Thank you again 🌟
$4,900 Is the Ceiling — Gold Likely Lower Unless It Breaks🟡 Gold Futures Breakdown — Major Reversal & Key Levels
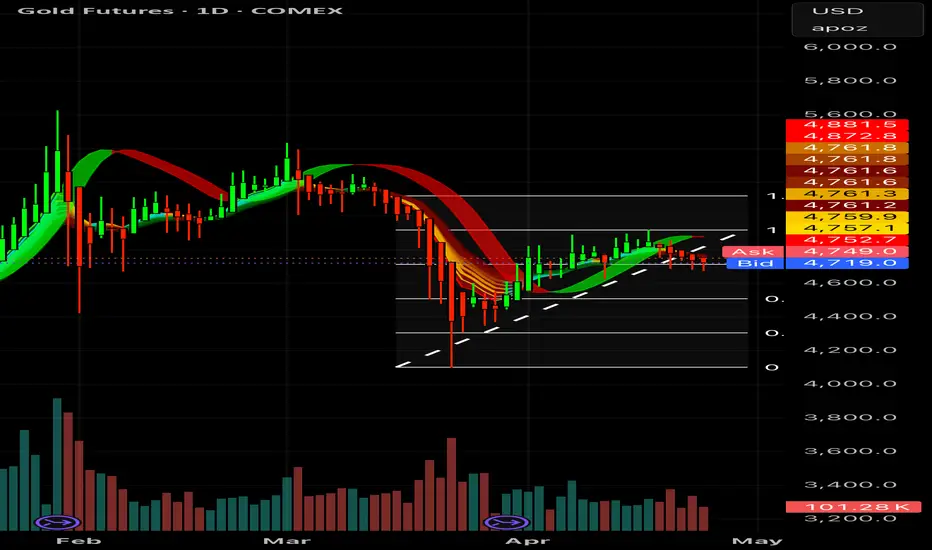
Gold printed a recent high at 5,626.8, followed by an aggressive two-day selloff down to 4,423.2 — a ~20%+ move. That kind of drop signals heavy distribution and a clear shift in momentum.
After the initial decline, price bounced from 5,174.2 and pushed into 5,434.1, where it was rejected hard at the 5,400 resistance zone. This area shows significant sell-side activity, with ~273K contracts indicating strong short positioning and supply overhead.
From that rejection, price continued downward and ultimately retested the 4,100 level, which acted as a key support and triggered a strong reaction from buyers. However, sellers are still active, consistently fading upward moves.
The prior uptrend (March 23 → April 17) is now weakening, and current structure suggests a transition into a corrective phase.
⸻
📐 Key Levels
* Resistance: 4900
* Cycle High: 5,626.8
* Breakdown Trigger: 4,675
* Supports:
* 4,500
* 4,300
* 4,100 (major level)
⸻
📊 Current Structure
Price is sitting within a ~25% Fibonacci retracement zone, which means a bull flag / temporary consolidation is still possible here.
However, this level is critical:
* Holding above current structure → potential stabilization / short-term bounce
* Breaking below 4,675 → continuation lower
⸻
📉 Bearish Scenario
If 4,675 breaks, downside targets:
* 4,500
* 4,300
* 4,100 (full retest)
⸻
⚠️ Key Takeaway
The 5,400 zone is the ceiling right now. Unless price reclaims that level with strength, rallies are likely to be sold into.
Market behavior suggests heavy supply overhead + active short pressure, with buyers struggling to maintain control.
⸻
🧠 Final Note
This is a high-volatility environment. Large moves in short periods reflect aggressive positioning on both sides. Watch reactions at key levels—those will determine whether this stabilizes or continues lower.
BITCOIN / BTCUSDT SELL SHORTBTCUSDT SELL SHORT
- Bitcoin Bearish Market structure Shift Market is on W SIBI , market will respect & with Creat Liquidity on it , go to LTF ( H1 / M15 ) after All Liquidity Sweep & See a Valid MSS Conformation Then Enter with Proper SL & Hold for a Long Target , Target SSL .
NOTE - IN LTF after Valid Mss then Enter , Use For Sell Entry Use SIBI / AB / OB / PB / SZ
- Enjoy Floks .................................ICT TRADER

ETH/USDT — Ascending Channel CompressionETH is trading inside a well-defined ascending channel on the 4H, currently consolidating at 2316 after rejecting the 2414.56 prior high. The 2385 level is the immediate structural decision point — it held as resistance on the most recent push and price has since pulled back inside the channel without a clean reclaim.
The read across both timeframes is cautious. CVD on the 4H shows the faster line rolling over from the recent high while the slower line holds, signaling sell-side pressure building into the range. The 1H confirms this — CVD has rolled over more aggressively following the rejection at 2414, and OI is compressing at 5.14M, suggesting neither side is committed to a directional move yet.
Two scenarios from here.
Bullish: Price holds channel support, CVD stabilizes and produces a bullish cross on the 1H, and a clean reclaim of 2385 on volume triggers a continuation toward 2414 and the upper channel boundary. A CHoCH above 2385 with CVD agreement is the Gate 5 trigger.
Bearish: Failure to reclaim 2385, CVD continues lower, and a break of the ascending channel lower boundary with volume expansion signals a deeper retracement. The structural floor below sits near 2200.
No trade until the 2385 level resolves with order flow confirmation. The channel is intact. The structure has not broken. But CVD is not supporting the bull case at current price.
Waiting for the gate to open.

BTCUSDT 4H — Short-Term Rebound Attempt1. Structure Still Not Fully Bullish
The current structure remains slightly weak, with the 20MA still above the 5MA, and the 5MA above the 60MA. This indicates that the market has not fully shifted back into a strong bullish trend yet.
2. Bullish Reclaim of Key Levels
However, price has now pushed above both the 5MA and the 20MA with a bullish candle. This suggests that short-term momentum is turning upward.
3. Potential Short-Term Upside
This move could lead to a short-term rebound or continuation to the upside. While not a confirmed trend reversal, it signals improving buying pressure.
4. What I’m Watching
* Whether price holds above the 5MA and 20MA
* Continued momentum after the breakout
* Possibility of 5MA crossing back above the 20MA
5. Stay Tactical
This is more of a short-term opportunity rather than a confirmed trend. I’ll stay cautious and wait for further confirmation before shifting to a full bullish bias.

BTCUSDT Liquidity Sweep at Highs | Bearish Rejection from SupplyBitcoin (BTCUSDT) is currently reacting from a key higher timeframe supply zone after a strong bullish push, showing signs of a potential liquidity grab and bearish reaction.
🔍 Market Structure Insight:
Price formed a strong bullish impulsive move, breaking internal structure (BOS).
A Change of Character (ChoCH) was seen earlier, shifting momentum bullish.
Recent move tapped into a weak high / liquidity zone, where sellers are stepping in.
Price is now reacting from a marked supply zone, indicating possible distribution.
📉 Current Scenario:
A liquidity sweep above equal highs suggests smart money taking buy-side liquidity.
Rejection from the supply zone hints at a short-term bearish pullback.
Internal structure is weakening, showing potential for downside continuation.
📈 Trade Plan:
🔴 Sell Scenario (Preferred):
Entry Zone: 78,400 – 78,700
Stop Loss: Above 78,800
Targets:
TP1: 77,600
TP2: 77,300
TP3: 77,000
🟢 Buy Scenario (Alternative):
If price holds above demand and breaks higher:
Entry after breakout & retest above 78,800
Target continuation towards 79,500+
⚠️ Key Levels to Watch:
Resistance: 78,700 – 79,000
Support: 77,300 – 77,000
🚀 Expectations: Price may:
Complete a pullback after liquidity grab
Tap into lower demand zones
Then decide continuation (either reversal or deeper correction)
⚠️ Risk Management:
Wait for confirmation (candlestick + structure)
Avoid chasing the move
Manage risk strictly (1–2% per trade)
💡 Conclusion: BTC is at a critical zone where liquidity has been taken at the top, and a short-term correction is likely before the next major move. Smart entries with confirmation can provide high-probability setups.

BTCUSD SELL POSITION Market have solid zone for supply ... ROS continuesly following so we just wait Market Maker a negative pattern we take sell

SOL TO 81.4Judges 16:19 — "And she made him sleep upon her knees; and she called for a man, and she caused him to shave off the seven locks of his head."
Samson was SOL. Strong until he wasn't.

SHORT DOGEDeuteronomy 13:3 — "Thou shalt not hearken unto the signs of that prophet; for the Lord your God proveth you."

Trade Plan: PGTrade Plan: PG
• Direction: Long
• Entry: 141.50
• Stop Loss: 136.00
• TP1: 155.00
• TP2: 163.00
• TP3: 175.00
Take partial profits at each target, then trail stop to protect profits.
Analysis based on market structure, volume profile and harmonic pattern.
Not financial advice.

BNB LONG — ALMA Avg Strategy | WR 66%Spot/perp BINANCE:BNBUSDT in the ~628–632 pocket after the local reject from the ~653–655 handle; live list shows a new LONG opened ~25.04 16:00 near ~629.9 with small negative mark in the capture — early scaling, not a victory lap.
ALMA board
15m through 3D: SHORT; 1W: LONG (L=2, S=0). Fuel: 1H Cur Short 7 vs Avg ~3.4 (diff ~3.6 bars, ~2× average length); 4H Cur Short 6 vs Avg ~3.0 (diff 3.0 bars, ~2× average). 15m short leg is short statistically (S=2 vs SAvg 3) — execution skew is 1H/4H, not micro. Weekly already LONG while lower clocks stay SHORT — same “young weekly long vs stretched intraday short” fork as other ALMA long notes.
EMA / session grid
15m Below with Cur Short 24 vs Avg ~4.8 — extreme micro short crowding in that export slice. 1H/4H/3D/1W cells Below with fat slow-TF short persistence (e.g. 3D Cur Short 33 vs ~9.7 avg); 1D alone Above with Cur Long 6 — daily rebound clock vs everything faster and slower screaming Below. 1W Dev% in the row prints large positive vs the slow EMA — distant weekly mean, not a tight tag.
SMC — timeline
4H: local MS down / CHoCH vocabulary at the print after the pop — bounce trades as repair, not as clean trend handoff until acceptance through ~636–640 supply steps in the grab.
1D: higher print than spot in the log — tape stepped lower into the flush; bull-side OB / MS-up events earlier in April vs bear FVG language into ~643 in the bundle — two-way ledger.
1W: raid / FVG bear prints in the capture window — weekly book still remembers overhead.
Log string alerts on the same symbol: 1H EMA first bar close below; fractal low formed / broken; new HTF bear FVG — reset vocabulary layered on top of the long-add template.
Derivatives — skew
Account-side long share very heavy in the strip while CVD stays soft / negative edge and “whale” net positioning in the pane reads contrarian short — crowded retail long without aggressive lift in delta. Context risk: a relief pop can squeeze that skew; a failure turns it into fuel for another leg down.
Social — attention vs sentiment
Sentiment pegged high while dominance / interaction gauges sit off prior hype peaks — enthusiastic mood, quieter attention than the manic phase; good for narrative pops, bad as a sole bull thesis.
On-chain / activity (1D bundle)
Interprets as backdrop only: activity and address series stable-to-grinding vs violent price; large-ticket volume spikes without matching tx-count steps read whale-sized flow, not broad retail adoption — tactical tape, not a fundamentals all-clear.
Trend — 1D
Regime: recovery inside the Feb–Apr box; the bullish case needs sustained trade through the descending macro rail zone (~650–680 in the capture), not just a hug of the green base. Invalidation skew: lose the ~580–600 integrity pocket on acceptance and the averaging book re-prices toward deeper FL ladders on the SMC chart.
Trend — 1W
Post-ATH drawdown back to multi-year support fan — rips are counter-trend repairs until major overhead steps aside; ~687+ weekly supply in the markup is the first serious “prove it” air pocket, not a forecast from the Pine exits.
Backtest honesty (attached Strategy Tester, long-only column = All)
CAGR ~9.7% in the capital-efficiency slice — big headline on a long sample. ~2.1k trades, win rate ~66%, average win ~+7.5% vs average loss about −6.5% with avg win / avg loss ratio below 1 — expectancy lives in frequency, not giant winners per loser. Distribution shows a fat right tail on wins but also deep single-trade losers in the performance table (largest loser ~−30% trade in the grab) — tail risk is real under a pretty equity curve. Run-up vs drawdown duration in the report: average drawdown phases drag much longer than average run-ups in days — psychology and capital usage matter as much as PF. Treat max drawdown lines in that panel as path-risk truth even when total return looks smooth in screenshots.
Bull case
1H/4H ALMA short legs ~2× their rolling averages with weekly LONG already printing; EMA grid shows absurd 15m short crowding plus 1D Above island; flow strip sets up squeeze fuel if price reclaims ~633 fast ALMA in the second screenshot.
Bear case
SMC still prints MS down / bear FVG / weekly raid language; HTF bear FVG alert in the log; retail-perp long pile without CVD confirmation; backtest avg loss nearly as large as avg win with nasty single-trade drawdowns — wrong bounce eats pyramids fast.

VRSN Chinchilla Mid-Bounce UpTrendVRSN stock is explained here with the RYW_Method, in a storytelling mode, the analysis and chart pattern. Verisign (VRSN) company is a global and critical internet infrastructure provider, primarily operating as the exclusive registry for top-level domains like .com and .net. It manages domain name registration, ensures DNS stability and security, and one of their services is a root zone maintainer - basically, the way we connect to internet and websites.
You can see in this pattern, a chinchilla. You will notice the horizontal trend line, the tail, his ears, his eyes and his paws. The key is his paws before the jump or upward trend. It is impossible for his paws to go below the horizontal trend line, or this theory/analysis is incorrect.
A chinchilla jumps up with his hind legs, not his paws. So, his paws may go down (or the stock may pullback) yet it can not go below the horizontal line, or this trade will fail.
This one I call the Chinchilla Mid-Bounce graph, because of he is in mid-bounce. Basically, he is 1/2 way into his bounce up. (For your own interest, look up how high a chinchilla can vertically jump.)
Target 1: 265 (his eyes - already completed.)
Target 2: 290 (his ears, mid-point)
Target 3: > 310+, bounce completed, yet maybe more.
Remember, always protect your capital. Follow w/Stop Loss or whatever method you use to not be caught in the chinchilla coming back down, beyond your entry or comfortable 'flex'.
Thank you for letting me share this story, stock and what I predict. This is not financial advice, and I do believe in this company and their products/services.
Trade fails < 250

Eurjpyi was looking for sell opportunity past week, but price fialed to come to my entry. am still waiting patiently for price to come to my entry to go short

Trade Plan: ETHUSDTrade Plan: ETHUSD
• Direction: Short
• Entry: 2235.00
• Stop Loss: 2340.00
• TP1: 2113.50
• TP2: 2000.00
• TP3: 1900.00
Take partial profits at each target, then trail stop to protect profits.
Analysis based on market structure, volume profile and harmonic pattern.
Not financial advice.

Trade Plan: EURUSDTrade Plan: EURUSD
• Direction: Short
• Entry: 1.17913
• Stop Loss: 1.18100
• TP1: 1.17370
• TP2: 1.17380
• TP3: 1.16970
Take partial profits at each target, then trail stop to protect profits.
Analysis based on market structure, volume profile and harmonic pattern.
Not financial advice.

Trade Plan: BTCUSDTrade Plan: BTCUSD
• Direction: Short
• Entry: 72000.00
• Stop Loss: 74000.00
• TP1: 68700.00
• TP2: 66000.00
• TP3: 62500.00
Take partial profits at each target, then trail stop to protect profits.
Analysis based on market structure, volume profile and harmonic pattern.
Not financial advice.

Trade Plan: GBPUSDTrade Plan: GBPUSD
• Direction: Short
• Entry: 1.34750
• Stop Loss: 1.35130
• TP1: 1.33370
• TP2: 1.32300
• TP3: 1.31130
Take partial profits at each target, then trail stop to protect profits.
Analysis based on market structure, volume profile and harmonic pattern.
Not financial advice.

Correction Not Over Yet – EthereumOver the past two to three days, as I review some cryptocurrencies, I mostly see a 15–20% move in them, followed by a continuation of their correction.
Regarding Ethereum, save the lines I have drawn somewhere.
Ethereum will more or less continue this path over the next two to three months.

US30 TRADE IDEA BUY | LONG (27/04)As shown on the chart above - pricing is heavily bullish and has been for the past few days before market closure. I expect it to push up and hit target price
Target price : 50204.45
