CVX, Oil Price Spike to Fuel Bullish Trend!Hello There,
welcome to my new analysis about CVX (Chevron) on the global timeframe perspective. The oil shortage and oil price spikes are continue to increase. This is driving surplus earnings of oil companies such as CVX higher. Currently, there is an increased likelihood that this will continue.
As seen in my chart CVX already completed this massive ascending triangle formation. The breakout above the upper boundary has been the turning point of a massive spike in bullish volume and volatility. Right now CVX already bounced avove the 200 mark and is preparing the next bullish formation.
Above the crucial level of 190 the price action is now building up. The several bounces within this area are the initiating points of this continuational bull flag formation. Such a formation is marking the continuation formation of a continued trend.
In the next times, I am expecting the price action to form the next bullish inclinments with the price moving above the 200 level again and building up above it. Once this happens it is likely that the price action is going to complete this major bull flag formation.
With the formation completed the minimum target zone of this ongoing volatility cycle will be within the 370 area marked in my chart. Once this zone has been reached further assumptions about the trend direction and momentum need to be made.
Also, as the supply shortage and increased demand moves further this is also offering fundamentally bullish signals. It is also likely that speculative whale money is moving into the market more and more as they bet on an ongoing shortage and increased surplus values.
What do you think about the stock? Are you currently trading the stock? Would you prefer a bullish outcome?
Let us know in the comments!
Thank you a lot for the support!
VP
Community ideas

POWRUSDT 1D#POWR is testing the daily SMA100. In case of a breakout above it, the potential upside targets are:
🎯 $0.0758
🎯 $0.0863
🎯 $0.0949
🎯 $0.1034
🎯 $0.1155
🎯 $0.1310
⚠️ Always remember to use a tight stop-loss and maintain proper risk management.

ETHEREUM: Crucial Formation, Important Levels to Watch!Hello There,
on the short-term perspective Ethereum is forming crucial bearish pressure which could be decisive within the near future. While Ethereum remains the second largest cryptocurrency, it is recently forming crucial formations that should not be underestimated. In the past weeks, trading actions already showed major selling pressure occurred from whales dropping their ETH on the market. Now, there is an important formation forming, which could be the setup of a determined continuation. Especially when the levels confirm this will likely lead to an exaggerated price move.
When looking at the chart, we can see Ethereum is now trading within this major downtrend channel in which it already formed major bearish pressure. Furthermore, it formed a bearish EMA crossover to the downside, confirming the bearish trend. The several lower lows of the bearish trend mark the significance of this condition. Now, within the past few days, Ethereum set up to form a bear flag formation within the downtrend.
Within this bear flag formation, Ethereum already completed the initial waves A and B of the inner bear flag formation. Now with wave C, Ethereum is likely to move into the upper resistance zones. There is a major resistance zone within the upper boundaries of the channels. Several resistances come together, such as the upper boundary of the descending channel, the upper boundary of the bear flag, and the horizontal resistance line.
With a bounce into this area, which should be expected within the next times, Ethereum is entering a really crucial zone from where a pullback is highly likely. Especially when more and more whales enter the market and short sell, a pullback from this area will be an origin for bearish pressure towards the downside. The whole bear flag formation will be confirmed with a breakout below the lower boundary of the flag formation.
Once this formation has been completed, the targets as seen in my chart will be activated. From there on, a bearish continuation could also be likely if Ethereum does not manage to reverse in this area. In any case, this will be a highly important area to watch out for. Currently, it is important to consider the next phases of development and how Ethereum reacts to the resistance zones. The bearish price pressure should not be underestimated in any case.
With this being said, it is great to consider the important trades upcoming.
We will watch out for the main market evolutions.
Thank you very much for watching!

Is BITCOIN Preparing the Next Wave Down? Wyckoff Distribution!Hello There,
welcome to my updated analysis about Bitcoin and the Wyckoff distribution I mentioned in my first analysis about this topic. In recent times, major bearish pressure increased, pushing the price below crucial zones. Also, massive bearish dumping accelerated. Over 100 million long liquidations took place. Speculative bearish pressure also increased because of the oil price hike.
Initial Analysis About the Ongoing Wyckoff Distribution:
Looking at my chart, Bitcoin completed the major Wyckoff distribution I mentioned in my previous analysis. As it tested the $97,000 level, it hit a strong resistance from which it pulled back bearishly. Since this pullback, it has completed the LPSY as I expected and mentioned in my previous analysis. Since this very decisive price move took place, Bitcoin pulled heavily downwards below previous lines of support.
The fact that Bitcoin broke out below this heavily crucial $84,000 level makes the whole setup highly bearish now. Currently Bitcoin is forming the next crucial formation. This formation is a potential bear flag. As Bitcoin is just testing the resistance levels again, this could be a major acceleration point for upcoming bearish pressure.
Bitcoin is now validly trading within phase D of this whole Wyckoff distribution. This means that supply is higher than demand. With the main resistance within the $84,000, a next bearish pullback from this zone is likely to complete the bear flag. A drop below the $62,000 level is completing the bear flag. From there on, massive bearish pressure is going to unfold decisive price action.
With this being said, thank you a lot for the support!
We will watch how the market evolves in the next times.
VP

EURUSD, It Is A Huge BROADENING-WEDGE-CONTINUATION-FORMATION!Hello,
Welcome to this analysis about EURUSD and the daily timeframe perspectives. If you never heard about a Broadening-Wedge-Formation I highly recommend to watch my tutorial about it to have a in-depth overview as EURUSD is forming such a formation:
Therefore, looking at my chart now we can watch there how EURUSD is in a broader downtrend with major lower lows formed in this trend, and EURUSD also setting up the further continuation formation now which is actually a massive broadening-wedge-continuation-formation as marked in my chart with the black boundaries. Within this formation, EURUSD has a coherent wave-count and the waves A to C are already completed. Now as EURUSD recently pulled back off this massive resistance-cluster which is marked in red in my chart where several resistances are coming together this is pointing to the final completion of the whole formation when EURUSD breaks below the lower boundary as seen in my chart it will be the origin for further continuation and approachment of the lower target-zone marked in black. It will be highly crucial on how EURUSD approaches this zone and if it manages to hold this zone or just sets up for further continuations because when EURUSD moves below this zone it will be the origin for a bearish extension, for now, we need to keep the bearish scenario in mind and do not underestimate it before moving to further conclusions.
In this manner, thank you for watching the analysis, all the best!
"Trading effectively is about assessing possibilities, not certainties."
Information provided is only educational and should not be used to take action in the markets.

SPX, Massive Breakdowns, Formation Completed, Crucial Sights!Hello,
Welcome to this Update-Analysis about the S&P 500 Index and the 12-hour timeframe perspectives. Since my last idea about the Index, the whole H-S-Formation that I mentioned has been finally completed and the Index heavily increased with bearish volatilities. The breakdown emerged after the FEDs announcement to possibly decrease their balance sheet which currently has a total balance of 8.7 Billion US-Dollar, also the FED is looking to increase interest rates, there was no action taken yet however the sheer announcement of it already caused turmoil in the market. Now the index already moved into the initial target-zone that I mentioned, if you did not see the analysis already I highly recommend it to watch as this one is building a coherent follow up on the previous analysis, therefore I am looking at all the important levels, upcoming determinations and structural formations we need to consider here.
Structural Developments:
As when looking at my chart we can watch there how the Index is now moving and testing the remaining supports at the 4380 levels which are also the first head shoulder targets nevertheless according to the high bearish momentum with which the Index showed up here there is an increased likelihood given that a bearish continuation is indicated. Therefore, currently, it is likely that the Index shows up with an initial bounce which moves on to test the 85-EMA in red and the 45-EMA in green which are currently still resistance. How the Index moves into these EMAs will determine upon the outcomes of either a bearish continuation or a reversal. Therefore when the Index shows up with an increased bearish pullback this will likely lead to a bearish continuation and wave C extension within the bearish continuation zone marked in my chart in red.
Upcoming Determinations:
When this does not happen and the Index somewhat manages to stabilize in the structure within the potential reversal zone there is also a reversal possible however due to the fact that the Index already heavily increased bearish volatility there is a higher possibility given that the bearish continuation will emerge. In this case, targets of 4150 to 4170 will be indicated. Taking these factors into consideration simultaneously it will be also important what the FEDs decision will be next week because when the FED comes up with a decision on increasing the interest rates this will be a high likelihood indication for further declines to follow up in the market. A similar indication will be given when the FED decides upon decreasing their balance sheet, such a development will lead to similar bearish causing, it will be a crucial dynamic ahead.
In this manner, thank you for watching the analysis, all the best!
"There are many roads to prosperity, but one must be taken."
Information provided is only educational and should not be used to take action in the markets.

XRP ReversalWill look for price to continue bearish to my area of interest will a buy limit set at the red line. Once triggered will look for price to print a strong rejection candle on the higher timeframe for further confirmation. RR on this idea is roughly 1:19 with possibilities to hold up to $5.00 (over 300RR) This is a risky set up but the reward is immense so I'm not afraid to enter multiple times. God speed brothers

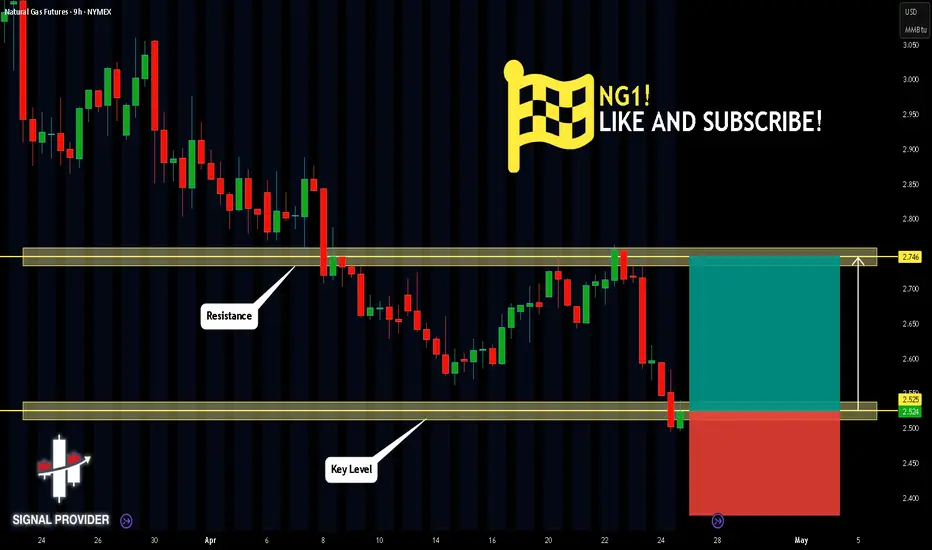
NG1! Will Move Higher! Buy!
Please, check our technical outlook for NG1!.
Time Frame: 9h
Current Trend: Bullish
Sentiment: Oversold (based on 7-period RSI)
Forecast: Bullish
The market is approaching a key horizontal level 2.525.
Considering the today's price action, probabilities will be high to see a movement to 2.746.
P.S
We determine oversold/overbought condition with RSI indicator.
When it drops below 30 - the market is considered to be oversold.
When it bounces above 70 - the market is considered to be overbought.
Like and subscribe and comment my ideas if you enjoy them!
Bitcoin Bullish Continuation – Testing Resistance Amidst AscendiThis chart illustrates a recovery phase for Bitcoin (BTC) following a significant market bottom established in early February near the $60,000 mark. The price action is currently defined by a series of structural shifts and a well-defined bullish trend.
1. Market Structure & Trend
Break of Structure (BOS) & CHoCH: The chart highlights several "Change of Character" (CHoCH) and "Break of Structure" (BOS) points. After a period of consolidation in March, the price successfully shifted from a bearish to a bullish bias, evidenced by the consistent formation of higher highs and higher lows.
Ascending Channel: Since April, BTC has been respecting a steady ascending channel (the green diagonal corridor). The price is currently hugging the upper boundary of this channel, indicating strong buying momentum.
2. Key Support and Resistance Levels
Current Price: Approximately $78,044.
Immediate Resistance: A significant horizontal level sits at $78,465, with a primary target (Take Profit zone) marked at $84,793.
Demand Zone (Support): There is a clear "Order Block" or demand zone identified in blue between $65,000 and $70,000, which served as the launchpad for the current rally.
Stop Loss/Invalidation: The red shaded area suggests a risk management zone around $75,017, where the bullish thesis would be questioned if the price breaks below the channel.
3. Future Outlook
The projection (indicated by the black zig-zag line and the large teal arrow) suggests a bullish continuation. The expectation is for Bitcoin to break through the immediate $78k resistance and trend toward the $84k - $85k range by late May or early June, provided the ascending channel remains intact.

SPY BEARS ARE STRONG HERE|SHORT
SPY SIGNAL
Trade Direction: short
Entry Level: 713.69
Target Level: 670.88
Stop Loss: 742.23
RISK PROFILE
Risk level: medium
Suggested risk: 1%
Timeframe: 9h
Disclosure: I am part of Trade Nation's Influencer program and receive a monthly fee for using their TradingView charts in my analysis.
✅LIKE AND COMMENT MY IDEAS✅

DYDX seems ready for an upward surge (4H)A trigger line has been broken, and the price is currently pulling back to retest this trigger line.
After forming a swing low (SWL), the price has moved upward and created a bullish change of character (CHoCH), indicating the presence of buyers.
Considering the price compression and the loss of bearish momentum, we will look for buy/long positions within the specified zone.
Targets are marked on the chart; move your stop to breakeven at the first target.
A daily candle close below the invalidation level will invalidate this analysis.
If you would like us to analyze a coin or altcoin for you, first like this post, then comment the name of your altcoin below.
What is your opinion about DYDX?

GBPUSD is showing a clear downtrend,💱 GBPUSD Trade Setup – Sell Opportunity 🔻
GBPUSD is showing a clear downtrend, with price rejecting from a key resistance zone — signaling potential continuation to the downside.
🔑 Sell Zone: 1.34700
🎯 Targets:
✅ 1st Target: 1.34500
✅ 2nd Target: 1.34300
✅ 3rd Target: 1.34100
⏱ Timeframe: 15 Minutes
⚠️ Entry Tip:
Wait for strong rejection candles or confirmation before entering. Avoid entering blindly at resistance.
💼 Risk Management is a Must
Use proper stop loss & lot size. Consistency comes from discipline!
💬 Like | 🔁 Follow | 💭 Comment | 📤 Share for more setups 📊🔥

ATOM looks ready to take off (12H)A trigger line has been broken, and we have a bullish CH on the chart both are signs of buyer strength. Price is also trading near a key level that is important for us.
We have two entry points on the chart, and positions should be built using a DCA approach.
Targets :1.842 _ 2.032
secure partial profits at the first target and then move your stop to breakeven. A hit of the stop level will invalidate this analysis.
If you would like us to analyze a coin or altcoin for you, first like this post, then comment the name of your altcoin below.
What is your opinion about ATOM?

Bears are in control of COMP price action (8H)Price has reacted to a supply zone and then broke below the bullish trendline to the downside. We also have a bearish ICH structure on the chart, and the candle that touched the supply was rejected immediately with a wick. Based on this, it is expected that COMP may move toward lower levels.
Two clear entry points have been marked for DCA entries.
Targets are marked on the chart, and at the first target you should move to break even.
A daily candle close above the invalidation level will invalidate this analysis.
invalidation level: 27.10$
If you would like us to analyze a coin or altcoin for you, first like this post, then comment the name of your altcoin below.
What is your opinion about COMP?

XAUUSD – 4H Confirms Bias | Liquidity Below🔍 Current context
- Clear bearish structure (LH + LL)
- Reaction from premium / supply zone
- Price below EMA200 → bearish bias
- Last drop shows strong selling pressure
🧠 Key point
👉 Liquidity resting below 4657 (LL)
- Equal lows / liquidity pool
- Natural downside target
👉 Current move:
- Just a pullback / distribution phase
- No real bullish shift on 4H
📉 Main scenario
- Below 4720–4750:
➡️ targets:
- 4657 liquidity
- extension 4640 → 4615
📈 Alternative
- Above 4750–4760:
➡️ opens move toward 4800+
🎯 Conclusion
👉 4H supports bearish continuation
👉 4657 liquidity is the key target
👉 Current move = correction, not reversal

Downward pressure - gold price falls to the 4645 region.📈 1. Trend : Structure
After forming a top around the 4.88x – 4.89x zone, price reversed sharply, confirming a break of the previous bullish structure.
A steep descending trendline has since taken control of the overall market direction.
Throughout this phase:
Price has been consistently rejected at the trendline
A clear sequence of lower highs and lower lows is maintained → confirming a sustained downtrend
👉 Current situation:
Price is moving tightly along the underside of the trendline, showing a bearish compression pattern
Pullbacks are weak and quickly sold off upon reaching resistance
Price is currently testing a key support zone around 4.66x
👉 Conclusion:
Short-term trend: Strong bearish
Market structure:
→ Downtrend → compression → high probability of further breakdown
📊 2. Key Levels
🔴 Resistance (Sell Zone):
4,700 – 4,730
Confluence:
Descending trendline
EMA (dynamic resistance)
Previous breakdown zone
👉 This is the optimal area to look for sell continuation setups
🔵 Support (Breakdown Zone / Targets):
Nearest: 4,660 – 4,650 (currently being tested)
Key level: 4,620 – 4,600
Deeper target: ~4,550 – 4,580
👉 A confirmed break below 4.65x could trigger a strong sell-off
3. SIGNAL
BUY GOLD zone : 4646-4643
SL: 4638
TP: 4670 - 4695 - 4728

BTCUSD Possible Liquidity Sweep & Bearish Reversal BTCUSD on the 15-minute timeframe is approaching a high-probability bearish reaction zone after a sharp bullish expansion. Price has rallied into a premium area where resting liquidity is likely sitting above recent highs. This creates the perfect scenario for a liquidity grab / stop hunt before a potential downside reversal.
Current market structure shows multiple internal swings, equal highs, and inefficient price delivery that may attract price upward first. Once liquidity is taken above the recent highs near 78,600 - 79,000, traders should watch for signs of weakness such as rejection wicks, bearish engulfing candles, Change of Character (CHoCH), or Market Structure Break (MSB).
After confirmation, BTCUSD could begin rotating lower into discount zones and fill nearby inefficiencies. The first downside objective sits around the marked demand/support area near 77,400, where partial profits may be secured. If momentum continues and sellers remain in control, price may extend lower toward the major swing low near 76,985.
Market Logic Behind This Setup:
Strong bullish move into higher-timeframe resistance
Buy-side liquidity resting above recent highs
Potential sweep of weak highs before reversal
Bearish reaction expected inside premium zone
Clean downside targets below current range lows
Key Trading Levels:
Main Resistance Zone: 78,600 - 79,000
Liquidity Sweep Area: Above recent highs
Sell Confirmation Zone: After CHoCH / MSB on M15
Target 1: 77,400
Target 2: 76,985
Invalidation: Strong close and continuation above 79,000
Risk Management Plan:
Wait for confirmation before entry. Avoid blind selling into strength. Use stop-loss above sweep highs and scale profits at major support zones. Maintain proper risk-to-reward ratio.
Final Note:
This setup is based on Smart Money Concepts, liquidity behavior, and market structure. Patience is key—let price come into the zone and show rejection first.

#SLPUSDT Ready to go higher#SLP
The price is moving within a descending channel on the 1-hour timeframe and has reached the lower boundary. It is now poised for a bounce and is expected to retest this boundary.
The Relative Strength Index (RSI) indicates a downward trend, which is likely to continue given the overbought conditions.
There is a key support zone (in green) at 0.000658. The price has bounced off this zone several times, making it a strong support level.
The price is trending towards the 100-period moving average, which we are approaching. This trend supports an upward move.
Entry Price: 0.000710
First Target: 0.000719
Second Target: 0.000736
Third Target: 0.000755
You can stop at the first and second targets and close below them, or continue towards the third target. Stop Loss: At the resistance zone (in green).
Remember this simple rule: Money Management.
Any questions? Please leave a comment.
Thank you.

JASMYUSDT 1D#JASMY is on the verge of breaking out above the descending resistance and the SMA100 on the daily chart. If that happens, the potential upside targets are:
🎯 $0.00646
🎯 $0.00739
🎯 $0.00815
🎯 $0.00890
🎯 $0.00997
🎯 $0.01133
⚠️ Always remember to use tight stop-losses and maintain proper risk management.

DXY Next week🛡️ OMFA – DXY (US Dollar Index) Analysis | 4H Context
🧭 Overall Bias: BEARISH
Discipline | Structure | Freedom
🔍 Market Structure Insight
Price has shifted from a previous bullish move into a clear bearish environment
We are now seeing:
Lower highs forming
Weak continuation on bullish attempts
The internal trendline support has been broken and retested
→ Indicates loss of bullish strength
📉 Displacement & Momentum
Bearish displacement is present
Recent bullish move into the zone is corrective, not impulsive
Price is reacting inside a premium area (sell zone)
📦 Area of Interest (AOI)
🔴 Primary Sell Zone
1D DCC / Supply Area
Around: 98.48 – 98.77
👉 This is where institutions are likely:
Positioning for continuation to the downside
🎯 Execution Model (OMFA Confirmation System)
You are not predicting—you are executing.
Entry Conditions:
Price reaches AOI (Done ✅)
Liquidity sweep
Lower timeframe shift
Engulfing confirmation
Entry AFTER candle close
❌ No confirmation → No trade
🎯 Targets
First Target: 4H S&R (~98.04)
Extended Target:
→ 97.33 – 97.30 (Weekly Target Zone)
❌ Invalidation
Sustained strength ABOVE 99.86
→ Bearish bias becomes questionable
🧠 Confluences
Bias: Bearish
Displacement: Bearish
Liquidity: Bearish
DCC: Bearish
Trendline: Broken & respected as resistance
⚠️ Key Insight
The current bullish move is not strength—it is a retracement into supply
🛡️ OMFA Principle
“We don’t predict. We execute.”
Patience is your edge
Confirmation is your protection
Discipline is your identity
🧭 Final Outlook
Expect:
Short-term pullback inside supply
Then continuation to the downside
Focus:
Sell setups only
High-quality confirmation entries

#RAVEUSDT – Short Setup from Key Supply Zone#RAVE
The price is moving within an ascending channel on the hourly timeframe. It has reached the lower boundary and is heading towards a breakout. A retest of this boundary is expected.
The Relative Strength Index (RSI) indicates a downward trend, and this trend is likely to continue due to the overbought condition.
There is a key resistance zone in green at 1.90, which the price has bounced off several times, making it a strong support level.
A consolidation trend is observed above the 100-period moving average, which we are approaching. This trend supports a decline towards this level.
Entry Price: 1.31
Target 1: 1.19
Target 2: 1.04
Target 3: 0.8870
Stop Loss: At the resistance zone in green.
Remember this simple rule: Manage your money wisely.
For any questions, please leave a comment.
Thank you.

$BTCUSD | Compression Between Rising Support & Major Resistance BTC is climbing within a rising structure after reacting from a strong demand zone. Price is now approaching a key resistance area where liquidity may build.
If buyers maintain higher lows above the trendline, continuation toward the upper range could develop. A rejection from resistance may lead to a pullback toward dynamic support before the next move.
Key Focus: • Rising support holding structure
• Resistance acting as decision zone
• Higher lows showing buyer strength
• Break or rejection may define next direction
This is a structure-based view for educational purposes. Always wait for confirmation and manage risk.

Bitcoin Consolidating Below Resistance With Upside PotentialPrice is currently moving in a tight range after a previous decline, forming a consolidation structure just below a clear resistance zone. The repeated reactions from this level show that it remains a key area to watch.
The current structure suggests accumulation, with price holding above a stable support line. The projected movement indicates a small dip toward support followed by a push higher, aiming to test the resistance zone again.
Key Levels:
Support Zone: 76,200 – 77,000
Resistance Zone: 78,200 – 78,600
Targets:
78,500
79,800
80,800 – 81,200
