ADA: Support Confirmed! Roadmap to the $0.2530 Channel TopThe Macro View 🛰️
Cardano remains one of the most technically resilient assets in this April cycle. Following the successful deployment of the Van Rossum Hard Fork, network efficiency has spiked, drawing in fresh institutional interest. While the market is currently distracted by USD/JPY volatility and the 160.00 psychological level, ADA has been quietly consolidating in a very healthy accumulation zone. On-chain data continues to show aggressive whale accumulation, suggesting that the smart money is betting on a breakout as the month closes.
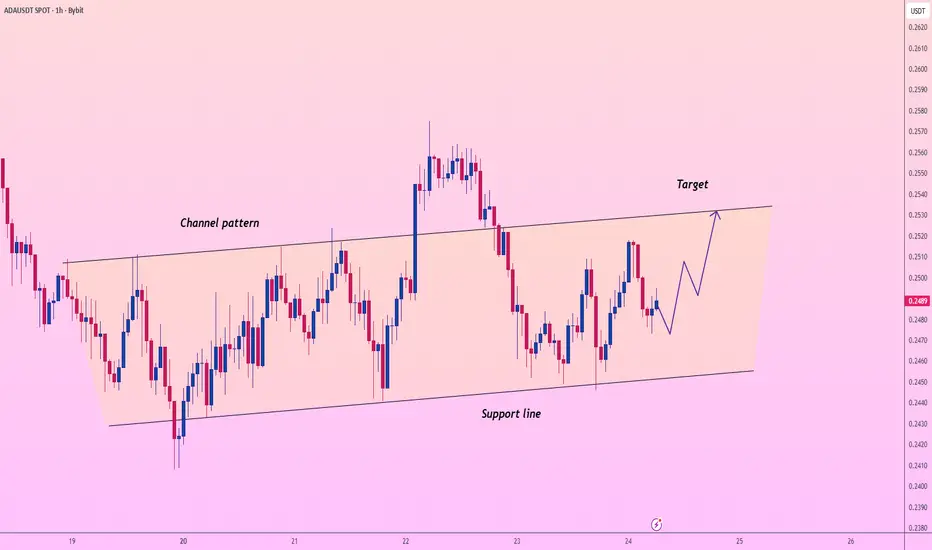
The Setup: Ascending Channel Pattern 🧩
The 1-hour chart reveals a textbook Ascending Channel:
The Support Line: ADA has just finished testing the lower boundary of the channel. This "Support line" has been defended three times in the last 48 hours, confirming that buyers are stepping in with significant volume at the $0.2450 – $0.2470 level.
Price Action: We are seeing a series of higher lows, which is a classic signal of bullish continuation. The recent "shakeout" below the channel midline was quickly bought up, showing that the bulls are still in control.
The Momentum: RSI is curling upward from the oversold territory, providing the "technical fuel" needed for a move to the upper boundary.
The Roadmap: Destination $0.2530 🎯
As indicated by the blue projection, the path of least resistance is toward the channel ceiling:
Immediate Entry: The current zone ($0.2480 – $0.2495) offers a solid risk-to-reward ratio.
The Target: The upper "Target" line near $0.2530 – $0.2540.
The Logic: In an ascending channel, price naturally seeks the upper liquidity zone after a successful support test.
Invalidation: A sustained 1H close below the $0.2440 support line would negate this bullish thesis and signal a shift to a neutral/bearish stance.
Community ideas


BTC/USD Rejection at the $78,200 Supply ZoneThe chart highlights a high-stakes standoff as the weekend draws to a close. Key observations include:
Current Trend: Bitcoin is trading at $78,073.89, up roughly 0.69% over the last 24 hours. The price has been oscillating in a tight band after a volatile week.
Supply Zone Rejection: The price has just tested a blue Supply Zone (marked with a red circle) near $78,200. A sharp red candle indicates that sellers are actively defending this level, preventing a clean breakout toward the weekly high of $79,472.
Market Sentiment: The Fear & Greed Index is currently at 33 (Fear). Despite the proximity to $80k, traders remain cautious due to a lack of volume on the latest upward move.
Geopolitical Context: The "wait-and-see" mood is driven by the collapse of indirect peace talks in Pakistan this weekend. With President Trump calling a revised Iranian peace plan "insufficient" and the U.S. naval blockade of the Strait of Hormuz remaining in place, the market is pricing in sustained geopolitical risk.
The Outlook: Most technical analysts view the current structure as a mean-reversion setup. If Bitcoin cannot reclaim the $78,500 resistance wall soon, it is likely to retest the weekend support floor near $77,200.

CHF/JPY LONG FROM SUPPORT
Hello, Friends!
CHF/JPY is making a bearish pullback on the 4H TF and is nearing the support line below while we are generally bullish biased on the pair due to our previous 1W candle analysis, thus making a trend-following long a good option for us with the target being the 204.317 level.
Disclosure: I am part of Trade Nation's Influencer program and receive a monthly fee for using their TradingView charts in my analysis.
✅LIKE AND COMMENT MY IDEAS✅

#RIVERUSDT Descending channel ?#RIVER
The price is moving within a descending channel on the hourly timeframe. It has reached the lower boundary and is trending towards a bounce. A retest of this boundary is expected.
The Relative Strength Index (RSI) indicates a downward trend, and this trend is likely to continue due to the overbought condition.
A key support zone (in green) was found at 5.64. The price has bounced off this zone several times, making it a strong support level.
The price is trending towards the 100-period moving average, which we are approaching. This trend supports an upward move.
Entry Price: 6.37
First Target: 6.592
Second Target: 6.877
Third Target: 7.1363
You can close at the second target or wait for the third target to be reached. The choice is yours.
Stop Loss: At the resistance zone (in green).
Remember this simple rule: Money Management.
Any questions? Please leave a comment.
Thank you.

Trade Plan: PINSTrade Plan: PINS
• Direction: Long
• Entry: 20.00
• Stop Loss:16.00
• TP1: 30.00
• TP2: 45.00
Take partial profits at each target, then trail stop to protect profits.
Analysis based on market structure, volume profile and harmonic pattern.
Not financial advice.

SOL: Why I'm Not Buying $86 (And Where I Will Buy)Half my feed is calling SOL the bottom at $86. It's not. The structure is pointing somewhere specific, and I'd rather wait for that than guess.
Read the count across degrees and the picture gets pretty clear.
The $8 low in late 2022 closed out Cycle wave II. Everything since has been Cycle III.
Primary ((1)) of that Cycle III is the move from $8 all the way to $295.83. Five clean intermediate waves up over two years. That's the kind of move that opens a bull market, not the kind that ends one.
What we've been in since the ATH is Primary ((2)). One correction inside something much larger that's barely started.
Inside Primary ((2)) you've got an ABC. (A) bottomed at $95.86. (B) bounced to $253.51 and rolled. We're in (C) now, and the minor sub-waves are nearly all in. 1, 2, 3, 4 done. Minor 5 is the only piece left.
That's the move I'm waiting for.
WHY $48 TO $55
Four things stack into the same $7 window.
The 1.0 fib extension of (A) to (B) lands at $52.94
The wave 1/4 overlap from Primary ((1)) sits in the same zone
$52 was resistance for most of 2023 before flipping to support. Old resistance turned support tends to hold the first real test
On log scale, the 0.5 retrace of the entire $8 to $295 impulse comes in at $48.72
When you halve the whole bull move, the math drops you in the same place as the smaller fibs. When fibs, structure, and prior price all agree, that's confluence I take seriously. $86 doesn't have any of that. Why would I buy here?
THE PLAN
Not buying $86. The structure points lower and I'd rather wait.
Trigger is a wick into the $48 to $55 zone followed by a daily close back above the recent minor (iv) high. Sweep, then reclaim. A reversal candle on its own isn't enough. I want to see who actually defends the level.
Entry: $48 to $55 on the reclaim
Stop: daily close under $45
T1: $129 (0.618 retrace of Primary ((1)))
T2: $200
T3: $260 to $295 (prior ATH zone)
Past T3 sits Primary ((3)). By Elliott convention, that's the longest and strongest leg of any cycle. I'm not slapping a price on it yet because price hasn't earned that conversation. But if the count holds, the entire move from $8 to $295 was the opening act. T3 is where I'd start trimming and watching, not where I'd assume the story ends.
WHEN I'M WRONG
A monthly close under $45 kills it. That's below the structural pocket and means I'm reading something the market isn't pricing. I step aside. No hero stuff.
A reclaim of $130 before price ever taps the $48 to $55 zone means minor 4 is still extending and the count needs adjustment. I'm not in the trade yet, so being wrong here costs me nothing.
Clean invalidation beats a clever story every time.
ON MULTI-DEGREE COUNTING
This is the part most retail counts skip. People label waves on whatever timeframe their chart happens to open to and assume that's the whole picture. A 5-wave move on the daily can be wave 1 of something on the weekly. A weekly impulse can be the opener for something monthly.
Stop reading at $295 and SOL ran a complete bull cycle. Zoom out and that move is the first chapter. Primary ((2)) isn't the top of anything important, it's the setup for what comes after.
The chart is on log scale, which is the only honest way to read a multi-year crypto count. On linear, the early structure compresses to a flat line and the proportions lie to you.
----------------------------------------------------------------
Updating this idea when minor 5 prints and the (C) low confirms. Follow along if you want the trigger update when it sets up.

LTC TO 54.96Luke 16:10 — "He that is faithful in that which is least is faithful also in much."
LTC was least. It remaineth least. Faithful nonetheless.

TOTAL3: Confirmation of support leads to resistance, back to ATHI noticed all cycles are different. While we always expect the same, it is always different. This chart here shows three complete bullish cycles.
The first one is really steep and ends with a blow-off top. The second cycle was also really steep and ended with a long-term double-top, quite different to the first cycle. The first one produced a major high and the highest ever. The second one a major new all-time high.
The third one is more gradual and there isn't even a new all-time high. Again, completely different.
Look at the 2017 bullish cycle. After the end of the bearish period, late 2018, there was a very significant relief rally, truly strong.
Look at the 2021 bullish cycle and the bear market that followed. The main low in June 2022 transitions into a long-term bottom process, no relief rally. See the huge difference?
In 2018 there is a huge rally after the bottom. In 2022, after the June 2022 low, the market dies out and goes sideways for more than a year... What about 2026?
The tops are different in all three cycles —wait. Can the relief be different in all three cycles?
The last two cycles produced different patterns after the bear market. What is to say that we will not get a different pattern this time around?
We have a double-top as the end of the long-term bullish cycle, 2024 vs 2025. Then a long long-term triple top. These two years and 2021. So 2024 and 2025 produced no new all-time high.
This index shows the Cryptocurrency market without Bitcoin and Ethereum —TOTAL3.
Can you understand what I mean?
The second cycle went deep below MA200. In the past, we would expect MA200 to remain unchallenged during the bearish period but things change.
Now, in 2026, after the first portion of the bear market, MA200 weekly remains unchallenged... Market conditions continue to change.
This is not to say that something specific should happen next. The whole analysis is intended to reach the conclusion that anything can happen.
We can see a new bull market start now, as there was no new all-time high in 2024-2025.
We can see a major relief rally now, the size of which we have not seen before. For example, the biggest relief rally in the history of crypto.
We can see the market drying out and going flat, like 2022, but this is only a possibility and not a 100% certain and unavoidable reality.
There is nothing in the whole world that demands right now for the Cryptocurrency market to move in a unique and specified way. If anything, all the developments in the last few years opened the doors for anything to happen, we've been seeing events in this lifetime that have not been present for centuries, 200 to 300 years ago. Who is to say that whatever happens now should be the same as four years ago? Why not 8 years ago? Why not 3 years ago?
Where on this chart does it say that Crypto must crash and it cannot grow?
I can build a map and behave based on certain assumptions, but this doesn't mean that the market must move in the way my imagination demands.
Ok, you saw a chart and you saw a pattern that happened years ago. But this chart never told you what will happen next. When you are looking at 2022, you are looking at the past and you are ignoring all the other cycles that do not validate your pre-conceived idea.
If the cycles must be all identical and the same, then 2022 should have been a repeat of 2018, and this obviously wasn't the case.
2025 should have been a repeat of 2021, and this didn't happen. Market conditions continue to change.
With that in mind, I am looking at the charts and the signals with fresh and untainted eyes; everywhere, I see signals supporting a massive wave of growth.
When we are focused on a bearish perspective only, it is 100% fully based on imagination, not from anything coming from the chart. Ok, past action, but the past is already gone.
The bottom is already in, based on the signals coming from the charts. Since the bottom is already in, at this point in time, anything goes.
We can have a massive relief rally, sideways consolidation or even a new bullish impulse starting this or next month. Anything can happen, and the chart looks ready, set and prepared for a very strong wave of growth.
If we go by technical analysis, TOTAL3 is reversing right above support. The lower low in February 2026 has lower volume vs October 2025, showing that the bearish move is losing force.
Once support is hit, the market reverses to test resistance. This means that a challenge of the resistance that produced the correction comes next. This would mean a bullish wave headed towards 1.15 - 1.20 T. This the most likely scenario based on technical analysis.
Thank you for reading. If you enjoy the content and find it engaging, make sure to follow.
Namaste.

BLESSThese published trades represent a portion of a trading history and are not investment advice. A trade is typically published with a 1:1 risk ratio; this does not mean I adhered to these limits, but rather that the closing price will fall within them.

$BTC - Weekend OutlookWe’re still holding 74k as key support here, and as long as we continue trading above this level — or even if Bitcoin deviates into Monday’s high around 76.5k — that would still be fine.
I still think there’s room for one more push into the 79k–80k region.
Two things I’m watching:
• A sweep of the local marginal highs around 78.8k–79.3k
• Or a wick higher into the 79.3k–80.1k range
I’m ready for both!

BTC Reclaim Attempt Into Supply – Major Decision Zone AheadBTC has bounced strongly from the lows, and is now pushing into a high timeframe supply zone aligned with key Fibonacci levels.
Price is also interacting with a descending trendline resistance, making this area a critical confluence zone.
A clean break and hold above the 95K–100K region could open the path toward new highs. However, failure to break this zone may lead to rejection, with a potential move back toward the 74K–72K range.
For now, this is a classic retest of supply after recovery. The reaction here will define the next major move.

CTRA - Wave Resistance Break Could Trigger RallyIn previous research, we analyzed the wave scenario where bulls are about to take control. The stock already reached the expected Fibonacci cluster level and hit the first target of 33.45 !
Visit here:
What's Next?
If the stock is going on an upward march, it has to break the wave resistance of 34.35 and sustain above it. A strong move with good volume can help the stock make a new all-time high, too. Target for this setup is 36.10 - 38.1 - 39.8.
As we mentioned earlier, a pullback before a move is expected when the price fails to break the resistance.
We will update further information soon.
@BrightRally_Research

AUDCAD Is Bearish! Short!
Here is our detailed technical review for AUDCAD.
Time Frame: 1h
Current Trend: Bearish
Sentiment: Overbought (based on 7-period RSI)
Forecast: Bearish
The market is approaching a significant resistance area 0.977.
Due to the fact that we see a positive bearish reaction from the underlined area, I strongly believe that sellers will manage to push the price all the way down to 0.975 level.
P.S
Overbought describes a period of time where there has been a significant and consistent upward move in price over a period of time without much pullback.
Like and subscribe and comment my ideas if you enjoy them!

NILUSDT UPDATENIL Technical Setup Pattern: Falling Wedge Breakout Current Price: $0.04364 Target Price: $0.07500, $0.08000 Target % Gain: 76.09%
Technical Analysis: NIL is breaking out of a falling wedge on the 1D timeframe with price pushing above the descending resistance trendline, indicating bullish reversal potential supported by recent momentum and structure shift. Time Frame: 1D

CADCHF: Bullish Setup After WXY CompletionCADCHF has likely finished its correction phase (called a W-X-Y in Elliott Wave), which basically means the market has already gone through a messy sideways/down move and may now be ready to trend. Price recently dipped below support (a fake breakdown) and quickly reacted, suggesting sellers are losing control.
Right now, the market is trying to form the first move up (Wave 1), but it’s not confirmed yet. For real strength, currency needs to break and hold above the marked resistance level. Breakout above wave B will confirm the bullish cycle.
Bullish targets are 0.5148 - 0.5751+ . We can extend the targets after the breakout of wave X.
We will update with further information soon.
By @BrightRally_Research

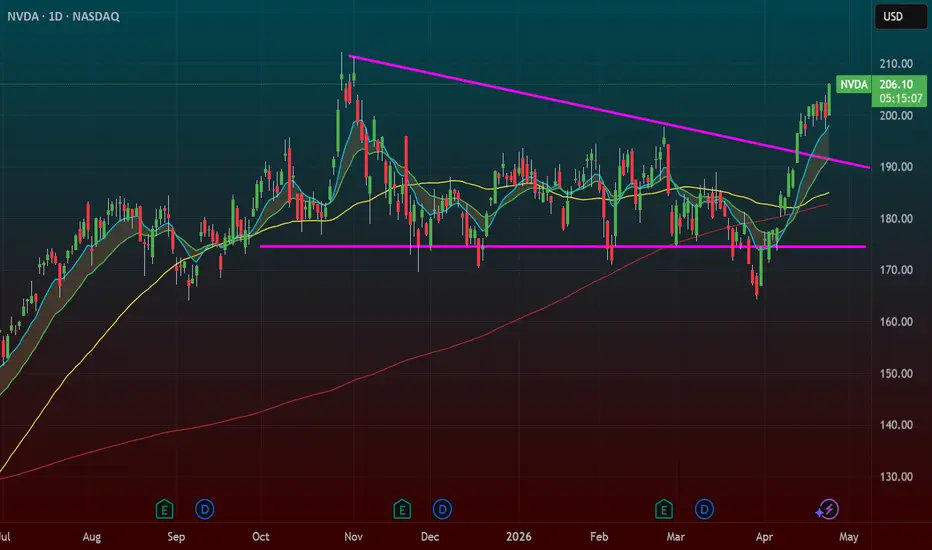
NVDA – The Market Leader Has Been Sitting Still While EverythingHere's what most people are missing on NVDA right now.
While MU ran 69% this year. While MRVL ran 95%. While AMD ran 43%. The stock that started this entire AI trade has been basically flat. The market leader has been coiling for months while the rest of the semiconductor sector went parabolic around it.
That kind of setup — the leader lagging while the sector heats up — doesn't last forever. When the market leader wakes up, it moves fast.
─────────────────────────────────
THE SETUP
─────────────────────────────────
Four day bull flag sitting right at $204. Tight consolidation, clean pattern. Above that is the larger ATH breakout level that everyone who trades this name knows about.
This is textbook. A short-term flag inside a larger base, coiling right under the level that matters most. The pattern is giving you a defined entry with a clear stop — low of today's candle. If that level breaks you're out. Simple.
The semiconductor sector is red hot and NVDA is the engine behind all of it. Revenue was up 73% year over year last quarter. Blackwell chips are sold out through mid-2026. Jensen Huang is already projecting $1 trillion in chip demand by 2027. The fundamentals have not changed. The chart just needed time to catch up.
─────────────────────────────────
TRADE PLAN
─────────────────────────────────
Entry: Break of the 4-day flag above $204
Stop: Low of today's candle
Target: ATH and beyond
Pattern: Bull flag into ATH breakout
─────────────────────────────────
THE ONE RISK
─────────────────────────────────
The QQQ is extended. Any day we could get a 2-3% flush on the index and NVDA will feel it regardless of how good the setup looks. That's just the reality right now. Keep the stop tight, don't press size, and let the trade work. The setup is clean but the market doesn't owe anyone anything.
If it works, this is the old warrior taking the lead again. The market leader reclaiming its spot at the top of the sector. That's a powerful move when it happens.
GBP/USD Technical Outlook📊 GBP/USD Technical Outlook — Bullish Structure Testing Resistance
This chart of the GBP/USD on the 4H timeframe shows a clear shift from bearish to bullish market structure, with price now approaching a key decision zone.
🔻 Previous Phase: Bearish Momentum
The left side of the chart shows a strong downtrend, characterized by lower highs and lower lows.
Selling pressure was consistent until price reached a major support zone near 1.3150, where the decline slowed.
⚖️ Consolidation: Range Formation
After the drop, price entered a horizontal range (mid-March area).
This indicates indecision and accumulation, often a precursor to a breakout.
Multiple rejections within this range confirm equilibrium between buyers and sellers.
🚀 Current Phase: Bullish Channel
Price broke out upward and formed a rising channel (ascending structure).
Higher highs and higher lows confirm bullish momentum.
The dashed midline acts as a dynamic support, showing controlled upward movement rather than impulsive breakout.
🧱 Key Levels to Watch
Resistance: ~1.3700–1.3750
→ Strong supply zone; price has not yet broken above it.
Support: ~1.3150
→ Major structural base where buyers previously stepped in.
Channel Support (dynamic): ~1.3400–1.3450
→ Critical short-term level inside the bullish structure.
🔍 Current Price Behavior
Price is pulling back within the channel, forming a possible bullish continuation pattern.
The zigzag projection suggests a short-term dip followed by a move higher.
Momentum is slowing slightly near resistance — watch for confirmation.
📈 Potential Scenarios
✅ Bullish Continuation
Hold above channel support (~1.3450)
Break above resistance (~1.3700)
Target: 1.3800+
⚠️ Bearish Breakdown
Loss of channel support
Break below ~1.3400
Could revisit 1.3300 → 1.3150 support
🧠 Professional Insight
This is a textbook market cycle:
Downtrend →
Range →
Breakout →
Trending Channel
The current phase suggests trend continuation unless structure breaks. Smart traders typically wait for:
Confirmation at support for buys
Or rejection at resistance for short-term sells

GBPUSD 4H Trade IdeaGBPUSD 4H Trade Idea
Price is currently trading around the 1.3520 area, sitting inside a key resistance zone between roughly 1.3500 and 1.3550.
I’m watching this area for a possible bearish rejection, supported by the marked XABCD pattern on the chart. The short idea is based on price reacting from resistance and potentially moving back toward the lower demand/support zone.
Potential setup:Sell area: around 1.3520Stop loss: above the resistance zone, around 1.3550–1.3560Take profit: around 1.3265
The reward-to-risk looks attractive, but confirmation is important. I’d prefer to see a clear bearish rejection candle, lower high, or a break below the recent consolidation low around 1.3450–1.3460 before trusting the downside move.
This is just a trade idea, not financial advice. Manage risk carefully.

Panduhh's Tesla Blueprint for Swingers So I have given the intraday pivots, however I was at limit before I was able to post this one for Swing Traders. Here are the pivot levels, Price directly at PP.
----------------------------------------------------------------------------------------------------------------------
These are the equilibrium levels for the current structure in Tesla
Levels are derived from internal framework using structure and geometric relationships—not time-based inputs.
Focus is not on prediction, but on order flow response at price.
Reaction at each level determines outcome:
– Acceptance → continuation within value
– Rejection → rotation away
– Failure → discovery beyond the range

XAUUSD BEARISH MOVE (READ CAPTION)Hi trader's what do you think about GOLD
Gold is currently trading with a bearish market bias, as price continues to face rejection from key resistance levels. Sellers are maintaining control, and short-term upward moves are being treated as potential selling opportunities.
🔴 Resistance 1: 4,771
The 4,771 level is acting as an immediate resistance where price may face rejection. Staying below this level supports the bearish outlook.
🔴 Resistance 2: 4,800
The 4,800 level represents a stronger resistance and supply area. Any retest of this level followed by rejection would confirm further downside pressure.
🟢 Demand Zone: 4,696
The 4,696 level is a key demand area and downside target. If bearish momentum continues, price may move toward this zone where buyers could attempt a reaction.
📉 Market Bias
Below 4,771 – 4,800 → Bearish continuation likely
Rejection from resistance → Sell-on-rallies opportunity
Downside target → 4,696 demand zone
Break above 4,800 → Bearish setup invalidated
Overall, Gold favors a sell-on-rallies strategy while price remains below key resistance levels.
please like comment and follow thank you!

USDCAD Long Trade | VMS 2.0 Reversal Setup (Limit Entry Filled)Good morning,
Here’s a breakdown of a USDCAD trade we took yesterday using the VMS 2.0 framework.
After an extended 3-week move down, the market began showing signs of exhaustion and reversal.
🔍 Structure:
A hammer candle formed at the lows
Followed by a bullish engulfing candle
This combination signaled a potential shift in direction after sustained downside pressure.
⚙️ VMS 2.0 Alignment:
Momentum:
Daily momentum was at -86 and strongly hooking up
4H momentum showed divergence and strong upward movement
Volume:
4H: 81
1H: 93
This confirmed participation as buyers stepped in.
⏰ Timing:
All confirmations aligned around 7am, within our primary trading window (5am–9am).
🎯 Trade Execution:
Entry: Limit order (filled quickly after placement)
Stop Loss: Swing low minus ATR
Take Profit: Set at the next resistance level
🧠 Key Insight:
This is a great example of a reversal setup where:
Structure signals the shift
Momentum confirms direction
Volume validates participation
Alignment is what we wait for.
The strategy is simple.
Mastery takes time.
Guidance is optional.
This is for educational purposes only. Not financial advice. Always do your own research.
