XRP – Compression Before Expansion?XRP is currently bullish, trading within a rising wedge in blue.
Momentum is building… but still waiting for confirmation.
For the bulls to take over and kick off the next impulse upward, a clean break above the minor red channel is needed 🚀
Until then, price remains in a compression phase.
Meanwhile, if XRP dips back into the accumulation zone, that would open the door for fresh trend-following long setups from value.
Structure is tightening… move is coming.
Which way do you see it breaking? 🐂🐻
⚠️ Disclaimer: This is not financial advice. Always do your own research and manage risk properly.
📚 Stick to your trading plan regarding entries, risk, and management.
Good luck! 🍀
All Strategies Are Good; If Managed Properly!
~Richard Nasr
Community ideas

USDCHF – Follow the Trend!USDCHF is currently trading below a strong resistance / supply zone.
This area has acted as resistance multiple times before… and now it’s being retested again.
As long as price holds below this zone, the bias remains bearish and we will be looking for trend-following short setups.
Clean structure. Clear level. Simple plan.
Will sellers step in again? 🤔
⚠️ Disclaimer: This is not financial advice. Always do your own research and manage risk properly.
📚 Stick to your trading plan regarding entries, risk, and management.
Good luck! 🍀
All Strategies Are Good; If Managed Properly!
~Richard Nasr

THE KOG REPORT THE KOG REPORT:
In last week’s KOG Report we said we would want price to come down into the lower defence region of 4785-95 which is where we wanted the long trade to come from. On open, we managed to breach the 1H RB and activate the bias level which brought us to the level we wanted for the short but as you can see, we broke below the defence region. We had marked the lower level for another attempt which we did get successfully, resulting in the long and then more ranging price action which gave us some extremely good scalping opportunities.
During the week we gave our updates on the path and the RB targets which worked well but we didn’t get that higher level we wanted.
A successful week in Camelot however with our indicators and algo playing their part, not only on gold but the numerous pairs we trade and analyse.
So, what can we expect in the week ahead?
Again, due to news over the weekend we may open with gaps across the markets for that reason we’ll say we’ll stick with the plan but traders need to be aware of the extreme movement we may see from the open.
We have a resistance level above at the 4735 level with support below at 4704 and below that 4675-90. We would need 4735 to hold price down on the open to then target the breach of 4710 making it easier for price to attempt the lower levels before attempting the long trade from the lower defence regions sitting at the 4610-20 region at extreme. We need to hold above that level to go higher, failure to do so can result in a lower move into the 4550s.
On the flip, higher defence here sits at the 4754 level, we’ll use that level as the bias for this week and say we will need a strong break above to then go higher.
We would expect a choppy open and first day of the week, while price should settle closer to the FOMC statement which is expected on Wednesday. We’ll update traders with the FOMC KOG Report prior to the statement.
RED BOX TARGETS:
BREAK ABOVE 4710 for 4729, 4735, 4741, 4750 and 4756 in extension of the move
BREAK BELOW 4689 for 4680, 4675, 4665 and 4658 in extension of the move
Please do support us by hitting the like button, leaving a comment, and giving us a follow. We’ve been doing this for a long time now providing traders with in-depth free analysis on Gold, so your likes and comments are very much appreciated.
As always, trade safe.
KOG

Bitcoin Rally Failed Near the Top — Is a Bigger Drop Next?As I expected at the start of the week—just like I mentioned in the previous daily timeframe post — Bitcoin ( BINANCE:BTCUSDT ) began to decline from around the resistance lines, resistance zone($79,500-$78,750), and the 21_SMA(Weekly). In recent hours, this decline has been continuing with solid momentum.
From a classical technical analysis standpoint, it looks like Bitcoin, on the 4-hour timeframe, is forming an Adam & Adam Double Top Pattern(AADT) —one of the valid types of double-top patterns. A notable sign is that the right top is approaching the neckline with strong momentum, which adds to the pattern’s reliability.
From an Elliott Wave Theory perspective, it seems Bitcoin has completed its main wave 4 right near the resistance lines.
Also, we can see a negative Regular Divergence(RD-) between the last two peaks.
Since the S&P500 index ( FX:SPX500 ) is near its all-time highs, we must also keep an eye on it. If the S&P corrects from these highs, Bitcoin’s decline could be amplified due to their correlation. This increases the likelihood of further downside.
I expect that after breaking the support zone ($77,160-$76,740) and the neckline, Bitcoin could drop at least to around $74,900. If the downward momentum is strong, we could look for lower targets.
Target: $74,900
Stop Loss: $81,000(Worst)
Cumulative Short Liquidation Leverage: $80,100-$79,540
Cumulative Long Liquidation Leverage: $76,980-$76,200
Cumulative Long Liquidation Leverage: $74,500-$73,500
CME gap: $84,560-$79,660
CME gap: $69,535-$70,055
CME gap: $67,570-$67,170
What’s your view on Bitcoin? Could it push toward $80,000, or should we anticipate a deeper correction?
💡 Please respect each other's opinions and express agreement or disagreement politely.
📌Bitcoin Analysis (BTCUSDT), 4-hour time frame.
🛑 Always set a Stop Loss(SL) for every position you open.
✅ This is just my idea; I’d love to see your thoughts too!
🔥 If you find it helpful, please BOOST this post and share it with your friends.

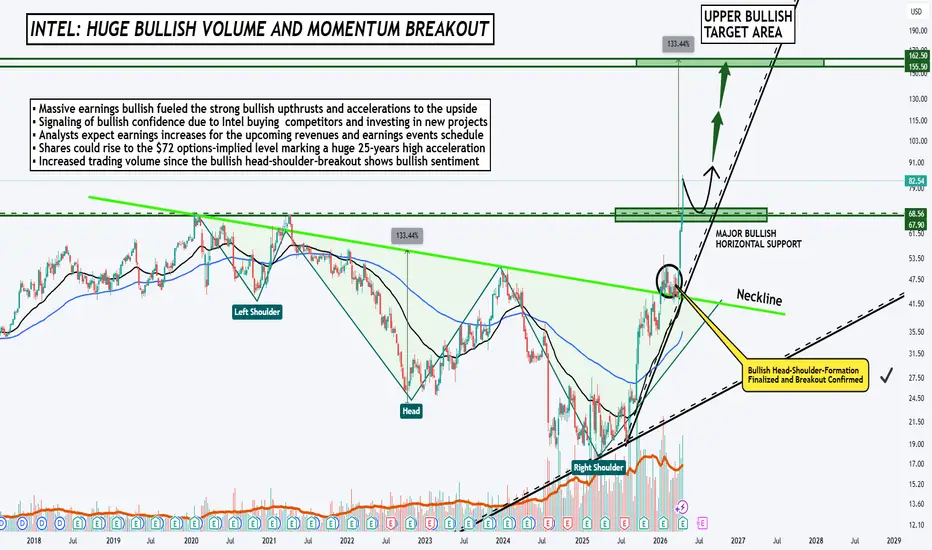
INTEL: Huge Bullish Earnings and Breakout Activated Targets!Hello There,
welcome to my new analysis about INTEL (INTC) on the weekly timeframe perspective. In the past month and weeks, the stock surged massively. The bullish volume and momentum increased heavily. Since the low at 18 in April 2025, exactly one year ago, the stock surged over 300% to the upside. Recently, the massive earnings boost originated in the pivotal bullish upthrust. In my analysis I detected further signs that are highly crucial right now.
As when looking at my chart, we can watch there how INTC, since breaking up above the all-time high region, printed another huge candle towards the upside. This all-time high region is now a major bullish horizontal support, as marked in my chart. Should INTC visit this area again, it will highly likely bounce there and set up the next bullish wave towards higher levels. Also, the 100-EMA marked in blue and the 35-EMA marked in black serve as strong support levels.
The completion of this gigantic and massively bullishly inverse head-and-shoulders formation has now activated the upper target areas, being within the 150 to 165 area. With INTC visiting those areas again, the stock would print another 100% towards the upside. With the options market and investor sentiment aligning with the bullish trend, the established bullish volume and momentum are likely to accelerate further. Once the targets have been reached, further assumptions about the continuation need to be made.
In this manner, thank you a lot for watching!
The support is highly appreciated.
VP
Gold Rejection From Resistance Targets Lower LevelsGold is pulling back from a lower high and approaching the 0.5–0.618 Fibonacci support zone, where buyers may attempt to stabilize price. The overall structure shows rejection from resistance, suggesting short-term bearish pressure while price remains below the resistance band.
If price reacts positively from the 4,721–4,708 Fibonacci support zone, a corrective move back toward the 4,749 resistance may occur. However, a confirmed break below the 0.618 level could expose the downside toward the 4,669 target zone.
Bias:
Short-term bearish below resistance, with downside risk increasing if Fibonacci support fails.
Educational purposes only — not financial advice.

EURJPY - The end of the correction will lead to an uptrend FX:EURJPY remains in a bullish trend. Signs of the correction coming to an end are emerging, which generally gives the market a chance to continue its upward movement.
The currency pair has been in a bullish trend since last March. Technically, the bullish structure remains intact. The weak Japanese yen is supporting the euro’s upward movement.
Technically, the price is breaking through the resistance of the local correction and local consolidation. If the bulls keep the price above 186.8–186.87, we can expect growth to continue in the medium term.
Resistance levels: 187.92, 187.70
Support levels: 186.87, 186.43
A retest of 186.87 and price consolidation above that level will confirm the price’s readiness for growth. Zones of interest: 187.7–187.95
Best regards, R. Linda!

VIEW DAY | 49XX – 50XX: THE FINAL LIQUIDITY TRAP BEFORE THE FALLThe market enters this week under heavy macro uncertainty, with the key focus on whether the FED will initiate rate cuts or maintain a restrictive stance. At the same time, geopolitical tensions remain elevated, yet the market reaction is no longer as strong as before. This indicates that capital is not aggressively flowing into gold, and the market is currently in a waiting phase rather than committing to a clear direction.
From a price action perspective, gold is moving within a sideway structure – a corrective phase inside a broader downtrend. The behavior is very clear: slow and extended bullish moves, but sharp and decisive sell-offs. This is a classic signature of a market lacking strong institutional participation, where short-term buyers and sellers are competing without real dominance.
The upper zone around 49xx – 50xx (FVG + Fibo + Trendline confluence) acts as a major liquidity pool, where price is likely to be drawn in to sweep liquidity before continuing the primary direction. With the broader macro narrative leaning toward a gradual recession scenario, long-term capital is more likely waiting for higher prices to position for the next leg down.
Trading Scenarios:
Short-term: Price continues ranging, reacting around 0.5 – 0.618 levels
Mid-term: Look for price to retrace into 49xx – 50xx → prioritize SELL setups
Bearish confirmation: A break below current support → signals strong momentum and continuation
Conclusion:
The market has not chosen a direction yet due to the lack of a strong catalyst. However, once capital steps in, the move will be fast, aggressive, and directional.
Overall Bias: SELL – aligned with the long-term recession narrative.
LucasGrayTrading

GBPUSDHello Traders! 👋
What are your thoughts on GBPUSD?
The GBPUSD chart is currently at a critical decision zone, with price reacting to a strong cluster of resistance factors.
Price continues to move within a descending channel, indicating that the overall trend remains bearish unless a valid breakout occurs.
The highlighted resistance area is acting as a strong supply zone, where sellers have repeatedly stepped in and pushed price lower.
The 0.618 Fibonacci level is perfectly aligned within this zone, adding further strength to the resistance.
As long as price remains below this resistance area, the dominant bias stays bearish, and it is expected that after some consolidation in this zone, price will move toward lower targets.
Feel free to like and share your thoughts in the comments! ❤️
EURUSD: Massive 1:9 RR Trade | RBS & Gap ConfluenceRBS zone (Resistance Become Support). The second zone is a 4H timeframe Gap, which aligns with the 8H timeframe. Price got rejected on the 1H timeframe. Stop Loss is 13 pips, and the target is 126 pips. We need a 1H candle close below 1.16792 to continue towards the final target

Spy .. 1 more high then goodbyeGoing to this week, I think we make 1 more high targeting 720-726 before a 4-6% pullback in the first 2 weeks of May.
Approaching our 17yr trendline shown
Also we are 5% extended from the 20sma and yeah I know it's been propped and stubborn but that's just Seasonality
Majority of this move higher came from big tech...
The 2 biggest tech sectors responsible for that move are AMEX:XLK and NASDAQ:SMH
These tech sectors are outside their weekly Bollingerbands this is not sustainable and even though I expect another high this week most likely on the heels of big tech earnings I think we immediately start the pullback inside the Bollingerbands towards the End of the week. Also as you can see I circled the last 4 weekly green candles, 3 white soldier candle pattern gave us our fourth last week, usually the 5th and 6 are pullbacks
Usually at the start of every FOMC week the market usually opens red or flat and trades with extreme chop and low volume going into that Wed ... I'm thinking Wed is bloody during cash session and afterwards we recovery any losses on big tech earnings likely making a new high.
Early on between Monday and Wed I'm looking for a move between 709-715.
Either Wed or Friday I think we will close that gap at 701.50 ...
So my low end target for the week is 701 and my upside target is 720-726
Something's worth mentioning, Financial sector AMEX:XLF and Healthcare sector AMEX:XLV both declined beneath their 200ma last week... That's not a bullish market, just a tech squeeze and the tech squeeze comes to an end this week...
I'll update this some more throughout the week

GOLD MARKET UPDATE1H Market Update
The bearish gap at 4681 Goldturn has now been filled, acting as a support level and providing a bounce, although price did not reach the upper Goldturn. We are currently seeing another test of the 4681 level.
A confirmed break and Lock below this area could open the range to the lower Goldturn.
At the same time, we’re mindful of the 4H support at 4624, which is likely to show a reaction.
On the upside, the bullish gap at 4770 remains in focus. We’ll look to use lower Goldturn levels as potential buying the dip opportunities.
An EMA5 cross and lock will be key for confirmation, helping determine whether we should expect further downside continuation or rejection for another bounce.
We’ll keep you updated.
Mr Gold

GBPUSD Downtrend Continuation: Sellers in ControlGBP/USD is showing a bearish reaction mainly due to a confluence of technical resistance and underlying fundamental pressure.
GBPUSD the market likely performed a buy-side liquidity sweep above recent highs, triggering stop orders before reversing downward. This is a common smart money pattern that leads to bearish continuation On the fundamental side, the move is supported by relative strength in the US Dollar and/or weakness in the British Pound. This can be driven by factors such as:
On the technical side, price rallied into a strong resistance / supply zone around 1.3550–1.3580, which has previously acted as a rejection area. The market attempted to break higher but failed, forming rejection wicks and weak follow-through, indicating that buyers are losing strength. Additionally, price respected a descending trendline, confirming that the upside momentum is limited. This type of behaviour often signals a distribution phase, where institutional traders sell into buying pressure.
You may find more details in the chart,
Trade wisely best of luck buddies.
Ps; Support with like and comments for better analysis Thanks for Supporting.

USDCAD - BEARISH MOVE!Hello traders,
the USDCAD price has formed a rectangle pattern.
Currently, the support level (1.36436 – 1.36312) is broken,
so I expect a bearish move.
🎯 TARGET: 1.35810

EURUSD - H4 - Wave 4 completedI think wave 4 is complete, so we expect a price rally that should take last high.
There is an AB=CD pattern also (yellow).
Best Regards.

Selling EURUSD I’m looking for sells on EURUSD at a fib level currently we could counter trend and be in buys as long as it bounces on the fib above

XAUUSD 1HXAUUSD is in down trend as of now
but it will take pull back or give demand
if any bearish pattern form in box drawn then again we can see fall continue

SOLUSDT ready for 10% gain toward 94$ after weeks of ranging Hi,
i can see ranging candlesticks for weeks for the BINANCE:SOLUSDT but market is witnessing new volume and the price is close to the great support area the 10% gain toward 94$ can be the beginning of the new journey for the trend and the sol.

XAUUSD Bearish Control: Key Support Decides the Next BreakOption 1 (Professional & Clean):
Gold (XAUUSD) continues to trade within a clear bearish structure, forming lower highs while respecting a key support zone. Price is currently consolidating below resistance, with Ichimoku signaling continued downside pressure. A breakdown from support could accelerate bearish momentum, while a reclaim of resistance may trigger a short-term move toward the marked target zones.
Option 2 (More Analytical):
XAUUSD remains in a descending structure, with price reacting to a well-defined support base near recent lows. The Ichimoku cloud continues to act as dynamic resistance, reinforcing bearish sentiment. A sustained hold above support could lead to a corrective push toward Target 1 and Target 2, but failure to hold opens the path for further downside continuation.
Option 3 (Short & Punchy):
Gold is trapped in a bearish range. Support is the key battleground—hold for a bounce toward targets, or break for continuation lower.

BITCOIN 1D Bear Flag or 4H Channel Up?Bitcoin (BTCUSD) has been trading on a 4H Channel Up since the February 06 Low which on the 1D time-frame though is the 3rd of a series of similar patterns. The November 2025 - January 2026 one turned out to be a Bear Flag, the first of the Bear Cycle that started since the October 06 2025 All Time High (ATH).
Having already broken above the 1D MA100 (green trend-line), which is where it got rejected on January 14 2026, BTC sees now the 1D MA200 (orange trend-line) as the next Resistance, which is key, as all previous Bear Cycles tested it (and got rejected).
The presence of RSI Lower Highs both on the 1D and 4H charts, should make us skeptical. On 4H and the even shorter Channel Up (blue) that was initiated after the March 30 Low, the 4H MA50 (blue trend-line) is what's holding the pattern from a correction below the 0.236 Channel Fibonacci level. Critical days for the Cycle as a whole ahead of us.
Do you think the RSI Lower Highs will pull an immediate rejection or BTC will test the 1D MA200 first? Feel free to let us know in the comments section below!
---
** Please LIKE 👍, FOLLOW ✅, SHARE 🙌 and COMMENT ✍ if you enjoy this idea! Also share your ideas and charts in the comments section below! This is best way to keep it relevant, support us, keep the content here free and allow the idea to reach as many people as possible. **
---
💸💸💸💸💸💸
👇 👇 👇 👇 👇 👇

GOLD 1H CHART ROUTE MAP UPDATE & TRADING PLAN FOR THE WEEKHey Everyone,
Please see our 1H chart levels and targets for the coming week.
We are seeing price play between two weighted levels with a gap above at 4770 and a gap below at 4681, as support. We will need to see ema5 cross and lock on either weighted level to determine the next range.
We will see levels tested side by side until one of the weighted levels break and lock to confirm direction for the next range.
We will keep the above in mind when taking buys from dips. Our updated levels and weighted levels will allow us to track the movement down and then catch bounces up.
We will continue to buy dips using our support levels taking 20 to 40 pips. As stated before each of our level structures give 20 to 40 pip bounces, which is enough for a nice entry and exit. If you back test the levels we shared every week for the past 24 months, you can see how effectively they were used to trade with or against short/mid term swings and trends.
The swing range give bigger bounces then our weighted levels that's the difference between weighted levels and swing ranges.
BULLISH TARGET
4770
EMA5 CROSS AND LOCK ABOVE 4770 WILL OPEN THE FOLLOWING BULLISH TARGETS
4860
EMA5 CROSS AND LOCK ABOVE 4860 WILL OPEN THE FOLLOWING BULLISH TARGETS
4927
BEARISH TARGETS
4681
EMA5 CROSS AND LOCK BELOW 4681 WILL OPEN THE FOLLOWING BEARISH TARGETS
4580
EMA5 CROSS AND LOCK BELOW 4580 WILL OPEN THE SWING RANGE
4504
4425
EMA5 CROSS AND LOCK BELOW 4425 WILL OPEN THE SWING RANGE
4351
4263
As always, we will keep you all updated with regular updates throughout the week and how we manage the active ideas and setups. Thank you all for your likes, comments and follows, we really appreciate it!
Mr Gold
GoldViewFX

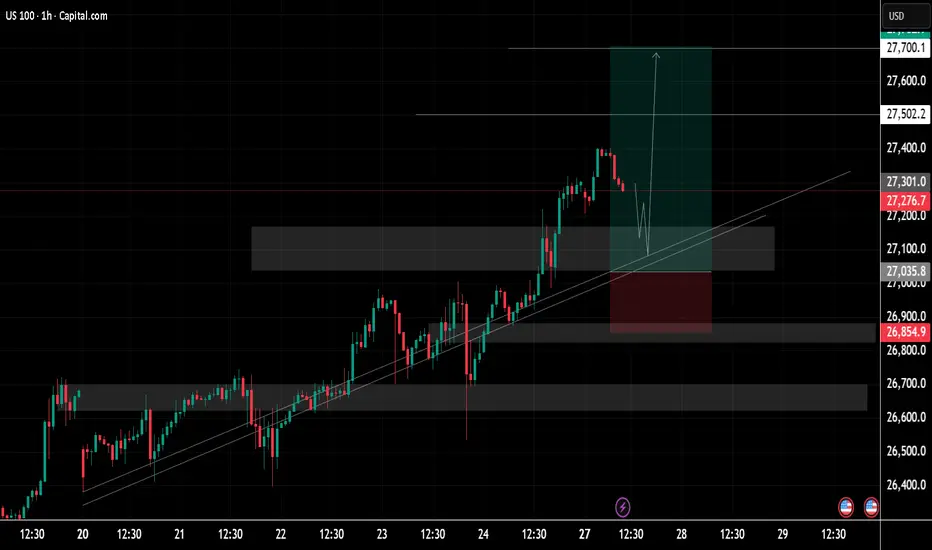
US100 Price Update – Clean & Clear ExplanationUS 100 a strong upward trend, where the price has been consistently respecting an ascending trendline. This suggests the market is bullish and likely to continue moving higher if the support levels remain intact.
In terms of risk management, the stop-loss is set at 26,854, a critical support level. This level is essential for determining the trend's strength; if the price dips below this, the market might experience a significant reversal. The gray areas on the chart indicate possible resistance levels, and the current price action suggests that if the index can break through these levels, it will likely continue its upward momentum, aiming for the next resistance level at 27,700.
For traders, the best strategy right now would be to consider entering a long position as the price approaches the ascending trendline support. This entry should aim for a target at the upper resistance zone around 27,700, with a stop-loss positioned just below the recent low near 26,854 to manage risk. This approach takes advantage of the current bullish momentum while safeguarding against potential downside movement.
Ps; Support with like and comments for better analysis Thanks for Supporting.
Gold 30M: Bullish Recovery From Fibonacci SupportGold is rebounding from the 0.5–0.618 Fibonacci retracement zone after forming a short-term higher low, suggesting early signs of bullish recovery. Price is currently approaching a descending trendline resistance, where continuation strength will be tested.
If price holds above the 4,699–4,689 Fibonacci support, buyers may continue pushing toward the 4,739 resistance zone, with a potential extension toward the 4,768 target area. However, rejection at the trendline resistance could lead to another pullback toward the support zone before continuation.
Bias:
Short-term bullish while holding above Fibonacci support, with upside potential toward 4,739 and 4,768.
Educational purposes only — not financial advice.
