$APP: Coiling in the Golden ZoneHey everyone, I hope you are doing well.
Let's jump straight into this NASDAQ:APP analysis.
NASDAQ:APP is at a critical juncture on the 4D chart after a steep ~40% drawdown from the ATH of $745.61. Here's what we're seeing:
Multi-Timeframe Signal Conflict
The LVL Weekly Short has hit its first price target (TP1/ PT1) at $440.95 and the LVL Monthly Long also has hit TP1 ($443.50) with room to continue higher. Conflicting signals like this typically resolve into a compression phase before the next directional move, which is exactly what price structure is reflecting right now.
Golden Zone (Fibonacci 0.50 - 0.786)
Price is sitting inside the Golden Zone, a 15-month window flagged from June '25 through Sep '26 where price went directional from a low to a high. This is historically a high-probability reversal area. The 0.786 at $411.08 and the 0.9 at $362.56 serve as deeper support if this zone fails to hold.
Price Structure: Compression
Recent 4D candles are printing higher lows and lower highs simultaneously, a classic compression/coiling pattern. These typically precede a sharp directional move. Until one side breaks, both longs and shorts (buyers and sellers) are playing a waiting game.
A key level: $451.31 (4D mid price)
This is the bull/bear pivot on the 4D. Sustained price above $451.31 signals bullish momentum is returning. Price is currently just below it at $448.13. A reclaim and hold would shift bias toward continuation of the monthly long.
Bias
Cautiously bullish on higher timeframes. The monthly long TP1 ($443.50) hit suggests the larger trend wants to go higher, and the golden zone is providing structure. Near-term, the weekly short still has pressure, so chop and downside wicks are possible before a clean move develops.
Levels to Watch:
Resistance: $476–$495 (prior consolidation zone)
Support: $431.42 (Previous Weekly Low) / $411.08 (0.786 fib)
Monthly long entry zone: $405.07
Invalidation / Stop (bear case): Below $385.86
Looking at NASDAQ:APP 470c 05/01/26
Not financial advice. This is a technical read only.
Follow me @brandonthrives for daily setups.
Community ideas

XAGUSD – Bearish Continuation Confirmed After EMA200 Rejection🔍 Current context
- Strong rejection from 79.5 – 80 (OB + premium)
- EMA200 acting as resistance → no acceptance above
- Structure: LH + LL + confirmed bearish BOS
- TP1 and TP2 already hit → valid momentum
📉 Market behavior
- Liquidity sweep + distribution
- Weak pullback into FVG → continuation
- Minor CHoCH = correction only
📉 Main scenario (Bearish continuation)
As long as price stays below 77.5 – 78 (EMA200 + OB)
➡️ Targets:
- TP2: 76.50 ✅
- TP3: 75.00 – 74.90
- TP4: 74.20
✔️ Confirmations:
- FVG rejections
- lower TF BOS
- no EMA200 reclaim
📈 Alternative scenario (Bullish)
Only if price accepts above 78 – 79
➡️ then:
- short invalidation
- possible move toward 80+

AUDJPY WEEKLY PERSPECTIVE AUD TO KEEP GAINSAUDJPY WEEKLY FOREX EXCHANGE WINDOW CLOSES AT 113.927 FROM ALL BANKS ,to be honest Australian dollar will keep rising against Japanese's yen from all indication, the market structure and the fundamental support AUDJPY LONG HOLD
TRADE TECHNICAL INFORMATION.
the RBA CASH RATE =4.10%
What is the cash rate? The cash rate is the interest rate that banks pay to borrow funds from other banks in the money market overnight. It influences all other interest rates, including mortgage and deposit rates.
In technical terms, it is the interest rate on unsecured overnight loans between banks (loans banks use to manage their liquidity)
The cash rate has a strong influence over interest rates in the economy, such as lending and deposit rates. In turn, these interest rates influence economic activity, employment and inflation. This affects all Australians, not just those with a mortgage.
AU10Y=4.957%
JP10Y=2.433%
BOJ RATE =Uncollateralized Overnight Call Rate(average) is 0.728%
Interest Rate Applied to the Complementary Deposit Facility is 0.75%
Basic Loan Rate is 1.0%
Current Account Balances at the Bank of Japan is 466,320billion yen
Next Monetary Policy Meeting Date is April 27 2026 ,expect some volatility during the session.
Governor Kazuo Ueda has maintained a cautious approach, balancing the risks associated with global geopolitical tensions ,such as the conflict in the Middle East and against the need for domestic inflationary control.
INTEREST RATE DIFFERENTIAL=4.10%-0.75%=3.35%
BONDYIELD DIFFERENTIAL=4.95%-2.433%=2.51%
CARRY TRADE ADVANTAGE =go long favor AUD
MARKET STRUCTURE =the break of weekly supply roof followed by retest opens a buy continuation into the long term roof of the bullish channel. While this may look like a technical correction zone from the bullish rally revert to 15min and look for market structure supporting sell bias ,otherwise you will have some losses.
HEAD OF CENTRAL BANK RBA=Reserve Bank of Australia (RBA): The Governor is Michele Bullock, who commenced her term on September 18, 2023.
HEAD OF CENTRAL BANK BOJ=UEDA Kazuo
ECONOMIC DOCKETS= BOJ MPM meeting on 27th April will set forward guidance in the direction of trade.
may 5th RBA MPC ( monetary policy committee will meet and take action ,expect volatility.
Wish you good luck
#AUDJPY #AU10Y #JP10Y

SILVER Liquidity Sweep into Demand – Long Setup Opportunity
Despite the current bearish structure and descending trendline, this setup favors a buy after a controlled drop into key demand. Price is expected to sweep liquidity below the 75.60–74.80 support zone, potentially triggering stops before moving lower into the 72.50–73.00 major demand/order block.
This lower zone is the high-probability area for bullish reaction, as it previously acted as the base for a strong impulsive move. A sharp rejection, bullish engulfing candles, or increased volume from this region would confirm buyer interest.
Wait for price to dip into 72.50–73.00 demand zone
Look for confirmation (rejection wicks, structure shift on lower timeframe)
Enter long after confirmation, not blindly
Upside Targets:
First target: 75.60–76.00 (support turned resistance)
Second target: 78.00–78.50 (trendline area)
Final target: 80.00–81.00 (major resistance zone)

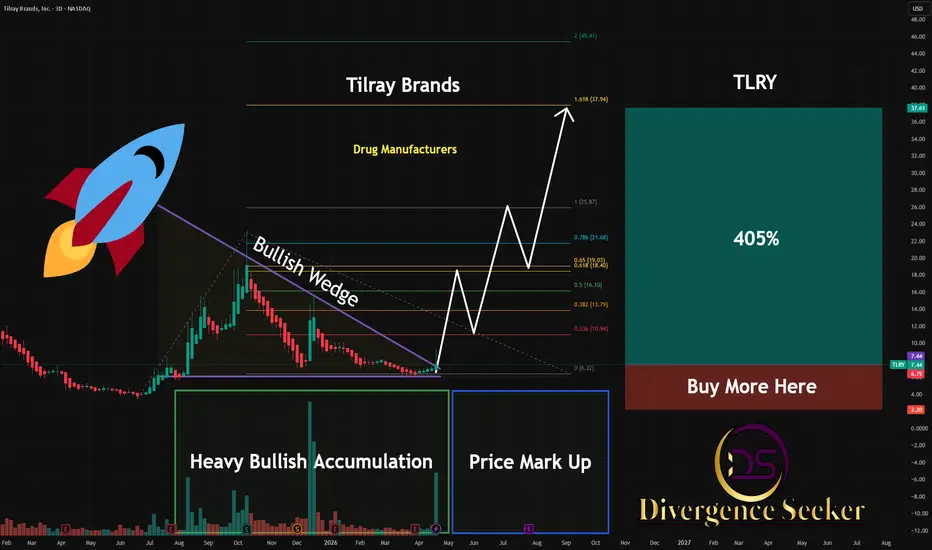
TLRY | Why Tilray is Coiled for a 400% Explosion | LONG Forget the daily retail noise. If you want to understand the massive move currently coiling up for Tilray (TLRY), you only need to look at three interlocking factors: the fundamental catalyst, the structural pattern, and the institutional footprint.
The Catalyst: DEA Rescheduling
The looming U.S. federal order to reclassify medical marijuana to Schedule III is the fundamental match to this powder keg. This isn't just a regulatory headline; it is the exact systemic shift required to unlock massive institutional capital flows that have been forced to sit on the sidelines for years. It fundamentally changes the viability of the entire sector.
The Structure: The Bullish Wedge
While the broader market waits for the final official ruling, TLRY's price action has compressed into a massive, textbook bullish wedge on the macro chart. We are seeing a series of lower highs grinding down into a firm structural floor, tightening the trading range week after week. The asset is coiling tightly at the absolute apex of this wedge, structurally signaling that a violent, directional breakout is imminent.
The Footprint: Heavy Volume Accumulation
Here is where the math becomes undeniable. If you look under the hood of this tightening bullish wedge, we aren't seeing distribution or weak-handed selling, we are seeing heavy, sustained volume accumulation.
Smart money is quietly and aggressively absorbing the remaining float at these suppressed base levels. When you pair a tightening wedge with heavy accumulation volume, it tells you one thing: institutional buyers are building their core positions right before the rescheduling catalyst fully prices in.
The compression at the apex is almost over. Watch for the high-volume expansion breaking through the top resistance of the wedge.
Stay sharp and follow the volume.
— The Divergence Seeker
Bullish Recovery Structure with Multi-Level Pullback Opportuniti Overview:
On the 1-hour timeframe, gold is attempting a structured recovery after a strong bearish impulse that bottomed near the 4678 support zone. The market is now forming a sequence of higher lows, indicating a developing short-term bullish structure within a broader corrective phase.
Key Levels Identified:
Major Support Zone: 4678 – strong demand area where price showed aggressive rejection
Intraday Supports: 4704 and 4725 – minor pullback zones for continuation entries
Current Price Area: Around 4726–4732 – acting as a decision zone
Resistance / Target Zone: 4779 – key supply area and upside objective
Price Action Insight:
Price has rebounded sharply from the major support and is now consolidating below minor resistance. The chart outlines multiple bullish scenarios, all based on the idea of pullbacks into support levels followed by continuation moves toward the 4779 resistance zone.
This suggests a layered demand structure, where buyers may step in at different levels, increasing the probability of continuation if momentum sustains.
Trade Scenarios (Projected Paths):
Shallow Pullback Entry:
Retest near 4730 zone → continuation to resistance
Mid-Level Pullback Entry:
Dip into 4725–4705 zone → bullish reaction → upside continuation
Deep Pullback Entry (Best Risk-Reward):
Full retracement into 4678 support → strong rejection → impulsive move higher
Targets:
Primary target remains 4779 resistance zone
Extended move possible if breakout occurs with strong momentum
Risk Consideration:
A clean break below 4678 would invalidate the bullish setup
Current move is still corrective; confirmation is required before entries
Conclusion:
Gold is building a short-term bullish recovery with multiple entry opportunities across different support levels. The overall bias favors upside continuation toward 4779, provided that key supports hold and buying pressure remains consistent

XAUUSD – Premium Reaction | Structure Will Decide🔍 Current context
- Price tapped premium / bearish OB zone (~4725–4735).
- Clear rejection + LH formation → weakness confirmed.
- Market structure = downtrend (LH + LL).
- Reaction at 0.382 fib (~4724).
🧠 Market behavior
- Supply reaction + inducement above LH.
- No acceptance above → only wicks.
- Looks like a pullback, not reversal.
📉 Main scenario (Bearish)
- As long as price stays below 4735–4750
➡️ targets:
- TP1: 4675
- TP2: 4644
- TP3: 4616
✔️ Confirmation:
- bearish BOS lower TF
- rejection continuation
📈 Alternative scenario (Bullish)
- Acceptance above 4755–4760
➡️ opens move toward 4820+
❗ Not active yet.
🎯 Conclusion
👉 This is a pullback in a downtrend
👉 Smart Money sells premium
👉 Downside continuation remains the high-probability path

Bitcoin on track to challenge its 2025 all-time high—confirmed Bitcoin (BTCUSDT) peaked December 2024 with a price of $108,000. A double-top appeared the following month, January 2025, with a price of $109,000. This is the orthodox end of the bull-market.
2025 saw total growth amounting to 69.38%. From the low in April to a high in October.
The size of the rise from December 2024 peak price to the all-time high equals 16.47%. This is all the new ground that Bitcoin gained in 2025, not much by historical standards.
The 2025 bullish move failed to produce a major new high compared to the peak in late 2024. Resistance confirmed. Sellers were too strong. A lack of follow through from buyers resulted in a strong correction. This is the process we witnessed from October (July?) 2025 through February 2026.
There is no need to look at the past.
The correction pierced the April 2025 low that was working as support. The correction failed to move below the August 2024 low.
The ensuing recovery, the present move that started after February 2026, already moved decisively above the April 2025 low. Confirmation happens this week, today, after a session close above $74,500.
Assuming this week closes above said level, which is high probability, we can say the recovery is complete.
The length and size of this recovery disqualifies the move as a relief rally, it has been going for too long. With this weekly close, we are now in a new market phase, a bullish cycle.
Bitcoin has never closed four consecutive weeks green while being bearish, nor during a relief rally. Four weeks green in succession has always been the start of long-term growth.
This is to say that we are already deep into a new bullish wave. The main level to be challenged on this move is the last major resistance, which sits around $100,000 to $120,000. This is all based on TA.
Bitcoin is going up.
Thank you for reading.
Namaste.

XMR TO 355Luke 8:17 — "For nothing is secret, that shall not be made manifest; neither any thing hid, that shall not be known."
And yet — XMR laughs in the darkness. Still hidden. Still moving.

XAUUSD TRADE SETUPWait for retest the entry level and bullish momentum then take a trade for Buy otherwise skip this setup

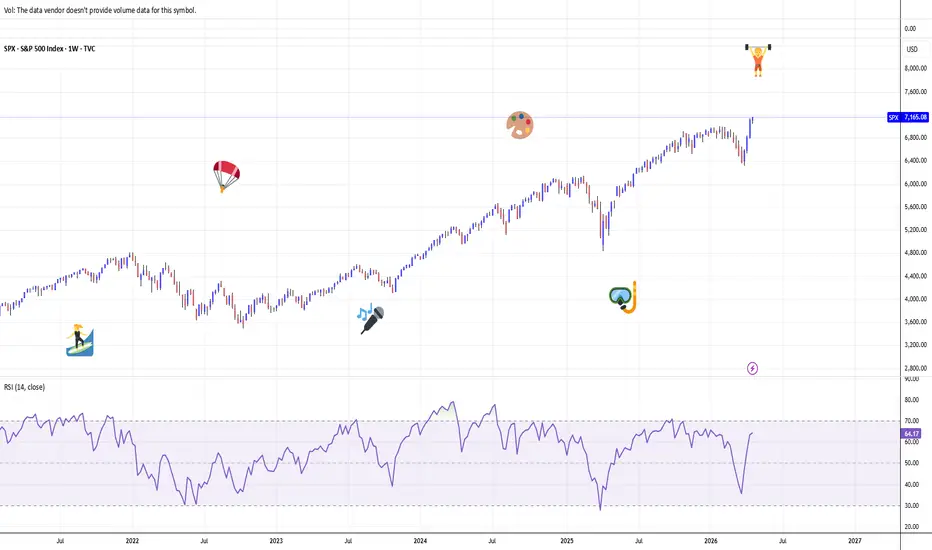
The Buffett Omen. The story where history goes to repeat itselfHistory Goes to repeat itself as Berkshire flirts with 52-Week lows while S&P 500 hits new highs.
December 1999 redux? Markets signal bubble peak as value crashes amid AI frenzy
A very rare and ominous market divergence goes to be unfolding in April 2026—one that has occurred only twice in all the modern market history.
The S&P 500 trades at its 52-week high of 7,168.59, while Berkshire Hathaway NYSE:BRK.A languishes near its 52-week low of $685,150, currently at $705,259—just 2.9% above that nadir.
This chilling parallel to late 1999 suggests we're witnessing another speculative bubble reaching its terminal phase.
The 1999 Precedent: Two Fatal Days
History provides exactly just two documented instances when the S&P 500 closed at 52-week highs while Berkshire simultaneously hit 52-week lows: December 23, 1999 and December 30, 1999:
On December 23, the S&P 500 reached 1,458.34 while NYSE:BRK.B collapsed to $34.34, near its annual low.
One week later on December 30, the divergence intensified—the S&P hovered near 1,470 while NYSE:BRK.A cratered to $52,600, its lowest point of the year.
These weren't random events.
They marked the climax of the dot-com mania, when tech stocks like Qualcomm NASDAQ:QCOM surged 2,587% in 1999 while Buffett's value-oriented empire plunged 19.86%. The annual performance gap in 1999 exceeded 40 percentage points—with the S&P 500 gaining roughly 21% while Berkshire declined nearly 20%, creating the only instance in Berkshire's history of such extreme single-year divergence.
Three months after those December lows, the S&P 500 peaked at 1,527.46 on March 24, 2000, before collapsing into a multi-year bear market.
2026: AI Bubble Mirrors Dotcom Excess
Fast forward to April 2026, and the pattern has returned with frightening precision. Over the past 12 months, NYSE:BRK.A has underperformed the S&P 500 by approximately 42 percentage points— NYSE:BRK.A down 12% while the index gained 30%.
This twelve-month divergence now exceeds even the 1999 annual gap, representing one of Berkshire's worst relative performance periods in its entire history.
The catalyst is identical: speculative mania in transformative technology. In 1999, it was internet infrastructure and e-commerce. In 2026, it's artificial intelligence. Both episodes share the same pathology—investors abandoning profitable, cash-generating businesses for momentum-driven growth stocks trading at stratospheric valuations.
Berkshire's near-record cash pile signals Buffett finds nothing worth buying at current prices—the same stance that cost him dearly in 1999 but proved prescient by 2002. The market punishes this discipline during bubble peaks, rewarding reckless speculation instead.
The Divergence Signals Peak Speculation
When the S&P 500 hits new highs while the world's most successful value investor trades near 52-week lows, it reveals extreme market bifurcation. Growth and momentum strategies dominate completely, while fundamental valuation becomes irrelevant. This configuration appeared in late December 1999, and it's reappearing now.
The setup is remarkably similar: narrow market leadership, extreme valuations in favored sectors, and value stocks left for dead. In 1999, a handful of tech darlings drove indexes higher while everything else declined. In 2026, a small group of AI-related mega-caps carries the entire market.
What Happened Next in 2000
After Berkshire hit those December 1999 lows while the S&P 500 made new highs, the index rallied another 4% to its March 2000 peak before collapsing 49% over the next 30 months. Berkshire, already depressed, held steady and dramatically outperformed during the subsequent crash. By 2003, value had reasserted itself and Buffett's patience was vindicated.
The Buffett Omen Activates
This divergence—the "Buffett Omen"—has occurred at exactly two moments in modern market history: December 1999 and April 2026. Both times preceded or coincided with major market peaks. The sample size is small, but the signal is unmistakable: when markets punish the greatest investor of all time while rewarding pure speculation, the bubble approaches its final phase.
For cynical traders and analytical minds, this isn't prophecy—it's pattern recognition. December 23 and December 30, 1999 weren't obvious inflection points in real-time. Only hindsight revealed their significance as the precise moment when speculation peaked and value capitulated before the inevitable reversion.
We may be living through April 2026's equivalent right now, watching history repeat with algorithmic precision. The Buffett Omen goes to be triggered. What followed in 2000 offers a sobering roadmap for what may come next.
Position accordingly.
--
Best wishes,
@PandorraResearch Team

Gold Presses Against Trendline Barrier After Key Support BounceGold has staged a constructive rebound after defending the 0.5–0.618 Fibonacci retracement zone, where a higher low has formed—often an early signal of shifting momentum. This recovery suggests buyers are gradually regaining control, but the structure is not fully bullish yet as price trades beneath a well-defined descending trendline.
The immediate focus is on the trendline resistance near the 4,720 region. A decisive move and sustained close above this barrier would indicate strength, potentially driving price toward the 4,739 resistance zone, followed by an extension into the 4,768 area. Such a move would confirm continuation of the short-term recovery phase.
On the downside, the 4,699–4,689 Fibonacci support remains critical. As long as this zone holds, dips may be viewed as buying opportunities within the developing bullish structure. However, a rejection at the trendline without strong follow-through could lead to another corrective move back into this support region before any renewed upside attempt.

Xauusd Gold looking bullish trend breakdown selling soon📊 XAUUSD (Gold) Trade Setup – Sell Opportunity 🔻
After a bullish trend, gold is now showing signs of structure breakdown and approaching a strong support zone. A clean break below support could open further downside momentum.
🔑 Entry Zone: 4670 – 4680
🎯 Targets:
✅ 1st Target: 4658
✅ 2nd Target: 4632
✅ 3rd Target: 4595
⏱ Timeframe: 1H
⚠️ Note: Wait for confirmation of support breakdown before entering. Avoid rushing trades.
💼 Risk Management is Key
Always trade with proper lot size and stop loss. Protect your capital first!
💬 Like | 🔁 Share | 💭 Comment for more setups

is wave X already complete on GBPUSD?if X already finish, we will get 5 wave impulsive down ( 5 wave of A of Y).
wave 2 could be running flat, and wave 3 start next week.
if not, we still need to reach 1.3710 before next leg down

bitcoin possible buy move bullish flag upwards break possible 300 pip move
use proper risk management

XAUUSD — Falling Wedge Breakout + MACD Bull Cross | Bullish BiasGold has been compressing inside a falling wedge on the 4H chart since the April 17 swing high, printing lower highs and lower lows in a tight descending channel. This kind of structure typically resolves to the upside, and that is exactly what price is signalling right now. The upper trendline has been broken with a clean candle body close above resistance.
MACD Confluence
The 4H MACD has just printed a bullish crossover as histogram bars flip from red to green, confirming that momentum is rotating in favour of buyers. The crossover is happening below the zero line, which historically produces high probability recovery moves when combined with a structural pattern break like this one.
Bias
Bullish. First target is the prior structure high around 4,800, with 4,840 and 4,895 as extended levels if momentum continues to build. Invalidation is a close back inside the wedge below 4,680. If that happens the setup is off the table.

XAUUSD BUY LONG / GOLD LTF BULLESH XAUUSD BUY LONG
- - XAUUSD / GOLD Bullesh Market structure Shift on HTF / LTF ,in LTF Market is Bullesh , IN M1 / M5 / M15 after see a Valid MSS Conformation Then Enter with Proper SL & Hold for a Long Target , Target BSL .
NOTE - IN LTF after Valid Mss then Enter , Use For BUY Entry LIKE BISI / AB / OB / PB / D Z
- Enjoy Floks .................................
--------------------ICT TRADER---------------

Near and Far Retests: What Every Trader Should Know⏱️ Reading time: 5–6 min
At first glance, all retests may look similar. Price comes back to the level, reacts, and gives the trader a potential setup. But in practice, not every retest carries the same meaning.
Sometimes price returns to a level quickly, with very little pullback, and the market keeps its pressure in the same direction. In other cases, price moves far away from the level, forms a deeper correction, and only then comes back. These two situations are not the same — and they often lead to different outcomes.
A quick return often increases the probability of a breakout and continuation. A more distant return often increases the probability of a reaction or reversal.
🔹 WHAT IS A RETEST?
A retest happens when price returns to an important horizontal level after its formation. In the previous educational post "Strongest Levels That Can Signal Reversals" we discussed the two of the most important levels in the market. This logic is explained in more detail in the educational materials linked in the Related Publications section.
For a trader, a retest is important because it helps answer a practical question: Is the market still pushing in the same direction, or is the level now more likely to produce a reaction in the opposite direction?
That is why a retest is not just a revisit to a price zone. It is a way to read market structure and understand how the market behaves when it meets an important area again. This is where the distinction between Near and Far Retests becomes useful.
1️⃣ NEAR RETEST
A Near Retest happens when price returns to the level relatively quickly after the first interaction with it.
A Near Retest can frequently be interpreted as a return within approximately 5 days on the daily chart, as a rough guideline. On lower timeframes, the same logic can be applied through bars or candles: if price returns to the level within roughly 5-10 candles , it can usually be treated as a Near Retest .
⚠️ Important: This is not a strict statistical rule. The main point is the context: price did not move far away from the level, the correction was limited, and the pressure toward the zone remained fresh.
In practice, a Near Retest often appears after:
Recent test of the level
Small pullback rather than a deep retracement
Price pressing toward the zone again
Continued momentum in the same direction
📍 WHY IS NEAR RETEST IMPORTANT?
The pullback is small, which means the opposite side has not shown strong control
Repeated pressure on the same level can gradually weaken that level
The closer the retest happens to the first interaction with the level, the higher the probability that the level may be broken and the movement may continue
If accumulation forms near the level (tight consolidation, compression to the price area), it further increases the probability of a breakout
So, a Near Retest is usually not about “the level is definitely going to hold.”
It is more about the market showing that the level is being tested again before a possible continuation.
2️⃣ FAR RETEST
As a rough guideline, a Far Retest on the daily chart can often be considered a return after 10 days or more.
Generally speaking, a Far Retest on the daily chart can frequently be regarded as a return after 10 days or longer . On lower timeframes, the same logic can be applied through bars or candles: if there are roughly 10 or more candles between the level formation and the retest, this return can usually be treated as a Far retest .
⚠️ Important: Again, this is only an approximate reference point. The real focus should be on the structure: price had more time, more space, and usually a deeper correction before revisiting the level.
In practice, a Far Retest often appears when:
Price has already made a more significant move away from the level
The correction is deeper or the return takes more time
Retest of a price area happens from a more distant part of the chart
📍 WHY IS FAR RETEST IMPORTANT?
Because the initial momentum has had more time to fade
The previous pressure into the level may no longer be active
Traders who entered earlier may start taking profits near the same zone
New buyers or sellers may use the level as an area to enter in the opposite direction
The farther the retest happens from the original level formation, the higher the probability that price may react, reject the zone, create a false breakout or reverse
If accumulation starts forming directly at the prive area during a far retest, it reduces the probability of a clean reaction and increases the risk of a breakout instead
That does not mean a Far Retest always leads to a reversal.
It means the probability of a reaction or reversal is higher in this context.
⚖️ WHAT IS THE KEY DIFFERENCE BETWEEN NEAR AND FAR RETEST?
The difference is not only about price distance .
A trader should look at:
how quickly price comes back to the level
how many candles or days passed between the first interaction and the retest
how deep the correction was
whether pressure toward the level is still present
whether accumulation is forming at the level
what the broader market structure looks like
what the higher timeframe shows
In simple terms:
🔹 Near Retest = fresh return, fewer candles, smaller pullback, more continuation pressure.
The closer the retest, the more important the continuation pressure.
🔹 Far Retest = distant return, more candles, deeper reset, stronger chance of reaction
The farther the retest, the more important the reaction or reversal potential.
🛠 HOW CAN A TRADER USE THESE RETESTS IN PRACTICE?
1️⃣ Find an important horizontal level (For more details, check the Related publications section)
2️⃣ Identify the first key interaction with that level
3️⃣ Count the approximate distance between the first interaction and the retest in days or candles
4️⃣ Watch how far price moves away from the level
5️⃣ Wait for price reaction at the level and use your own confirmation model before entering a trade
⚠️ Important: A retest is not a guarantee. Neither a Near Retest nor a Far Retest should be traded blindly. They are not automatic entry signals. They are frameworks that help you understand what kind of return to the level you are looking at and what type of reaction is more likely in that context. They only help the trader read probability more clearly.
In this educational post, we'll continue to share and analyze market situations related to Near Retest and Far Retest and show how to interpret them directly on a chart.
If this education article was useful, feel free to boost 🚀 it and share your thoughts and questions .

BTC Make It Or Break It Time!!!!No doubt about it, It is the calm before the storm. Daily EMA levels look very spread out, which can call for bearish price action.
Some say we're due for lower prices, but the legacy trend would have to break to fulfill lower prices at this point. If the Price continues sideways and up then we are most likely looking to rhyme with past cycles. Obviously with a longer wait time for the fun pumps, as this cycle seems a tad lack luster even thought it tapped 126k.
This chart should fully play out by December 2026 or early 2027. What do you think is gonna happen, I'd love to hear your honest feedback.

ALGO/USDT - Descending Trendline: Breakout or Critical RejectionOn the 1D timeframe, ALGO/USDT is still moving within a medium- to long-term downtrend structure, confirmed by a descending trendline (yellow line) that has been pressing price since the previous peak.
However, recent price action shows a recovery from the bottom area (~0.08), and now price is approaching a dynamic resistance zone (the trendline), which is a crucial point to determine the next direction.
---
📉 Pattern: Descending Trendline / Descending Structure
This pattern is characterized by consistent lower highs.
The trendline acts as a dynamic resistance.
As long as price remains below this line, the primary bias stays bearish.
However, repeated tests increase the probability of a breakout.
---
📍 Key Levels
Major Resistance:
0.1260
0.1430
0.1525
0.1740 – 0.1900 (strong supply zone)
Major Support:
0.1050
0.0950
0.0860 (previous bottom area)
---
🚀 Bullish Scenario
If price manages to:
Break and close above the descending trendline
Supported by increasing volume
Then the potential targets are:
0.1260 → 0.1430
If momentum continues:
0.1525
Even 0.1740 – 0.1900 (major resistance zone)
📌 This breakout could signal the early stage of a trend reversal from bearish to bullish.
---
🔻 Bearish Scenario
If price:
Fails to break the trendline
Gets rejected in the current area
A move back down toward:
0.1050
Then 0.0950
If selling pressure increases:
Retest of the 0.0860 low
📌 This would confirm that the bearish trend is still dominant.
---
⚠️ Key Insight
The current position is a critical decision zone
Breakout or rejection here will define the mid-term direction
Volume and candle confirmation are essential for validation
---
🏁 Conclusion
ALGO is currently at a major turning point.
Breakout = potential bullish reversal
Rejection = continuation of bearish trend
Traders are advised to wait for confirmation before entering to avoid fake breakouts.
#ALGOUSDT #CryptoAnalysis #TechnicalAnalysis #DescendingTrendline #BreakoutSetup #CryptoTrading #Altcoin #SupportResistance #Trendline #BullishScenario #BearishScenario

Gold Analysis & Trading Strategy | April 27✅ 4-Hour Trend Analysis
● Overall structure: The bearish trend remains unchanged, still in a downtrend (lower highs + lower lows). The recent rebound lacks continuity, and after a choppy rebound, it has turned weaker again.
● MA5, MA10, MA20: Bearish alignment, but short-term moving averages are starting to converge and flatten.
● BOLL: Price is running below the middle band, with the rebound unable to break above the mid-band.
✅ 1-Hour Trend Analysis
● Price rebounded from 4657 to around 4740, then fell back to 4708. This typical behavior shows a rebound without continuation (a sign of a weak market).
● MA5 is turning downward again, MA10 is flat, and MA20 is still heading down.
● MACD: Just turned bullish but quickly dropped, indicating a lack of sustained momentum.
📊 Fibonacci Key Retracement Levels:
● 0.236 (≈4702) ⚠️ Repeated battle for this level.
● 0.382 (≈4740) 🔴 Not broken yet.
● 0.5 (≈4767) 🔴 Strong resistance.
● 0.618 (≈4795) 🔴 Trend boundary.
👉 Current Structure Analysis:
● Price briefly moved above 0.236 but quickly fell back.
● This indicates the rebound is not valid or unstable.
● The market is still in a weak range-bound consolidation with a bearish bias.
🔴 Resistance Levels
● 4715–4725 (Short-term resistance) ⚠️
● 4740 (Fibonacci 0.382) 🔴 Key resistance.
● 4767 (Fibonacci 0.5) 🔴 Strong resistance.
🟢 Support Levels
● 4685–4670 (Short-term support).
● 4657 (Previous low) ⚠️ Key level.
● 4644 (Trend support).
● 4600 (Psychological level).
✅ Trading Strategy Reference
🔰 Short Strategy (Main approach)
👉 Entry Point: 4715 – 4730
🎯 Target Levels: 4685 → 4657 → 4644
📍 Logic:
● 4H trend remains unchanged.
● 1H rebound has failed.
● Fibonacci 0.236 is unstable.
🔰 Long Strategy (Only for short-term)
👉 Entry Point: Around 4660–4670
🎯 Target Level: 4700
📍 Logic:
● Previous low support may trigger a rebound.
● However, this is against the trend.
● Must use light position sizing and exit quickly.
⚠️ Trend Summary
👉 If price breaks below 4657: Bearish continuation → Testing 4644 or even a new low.
👉 If rebound fails to hold above 4725: Rebound failure → Continued choppy downtrend.
👉 If a strong breakout above 4740 occurs: Only then will a bottom be possible → Otherwise, the market remains bearish.
🔔Gold trading is not only a contest of strategy and technical skill, but also a test of your ability to read market sentiment and timing.
By capturing each wave of market movement and progressing steadily, you can achieve consistent growth even in volatile conditions.
Let’s move forward together—through precise analysis and disciplined execution—to unlock your path to profitable gold trading 💪💪

GALA/USDT — Descending Channel, Awaiting Breakout?The GALA/USDT 1D chart is clearly forming a Descending Channel, characterized by:
Lower Highs
Lower Lows
Two parallel trendlines (upper resistance & lower support)
Price continues to move within this channel, indicating that the primary trend remains bearish, although a minor rebound from the lower support area is visible.
Key levels:
Channel Resistance (red): ± 0.0037
Mid Resistance: 0.00435 – 0.00580
Major Resistance: 0.00780
Strong Support: 0.0025 – 0.0027
Currently, price is approaching the upper boundary, which is a critical area to determine the next move.
---
📊 Price Action Insight
Price experienced a sharp decline (capitulation), followed by consolidation within the channel.
Multiple rejections at the channel resistance confirm that sellers are still dominant.
However, a short-term higher low structure is starting to form, signaling a potential early-stage recovery.
---
🚀 Bullish Scenario
Bullish confirmation requires:
A breakout and daily close above the channel resistance (±0.0037) with strong volume
Upside targets:
1. 0.00435 (initial resistance)
2. 0.00480
3. 0.00580
4. 0.00780 (major target / extended breakout)
📌 Additional confirmations:
Successful breakout retest (resistance becomes support)
Increasing volume
Market structure shift from lower highs → higher highs
👉 A valid breakout could mark the beginning of a trend reversal from bearish to bullish.
---
📉 Bearish Scenario
Bearish bias remains if:
Price gets rejected again at the channel resistance
Downside potential:
Return to lower channel support
Retest 0.0027 – 0.0025 area
📌 Additional risk:
Breakdown below the channel → could lead to further downside continuation
👉 As long as price stays within the channel, the primary trend remains bearish (continuation pattern).
---
⚠️ Conclusion
Primary Trend: Bearish (Descending Channel)
Current Condition: Testing key resistance
Key Level: 0.0037
📍 This is a decisive phase:
Breakout = potential reversal
Rejection = continuation to the downside
#GALAUSDT #CryptoAnalysis #TechnicalAnalysis #DescendingChannel #BearishTrend #BullishSetup #CryptoTrading #AltcoinAnalysis #PriceAction #BreakoutSetup #SupportResistance
