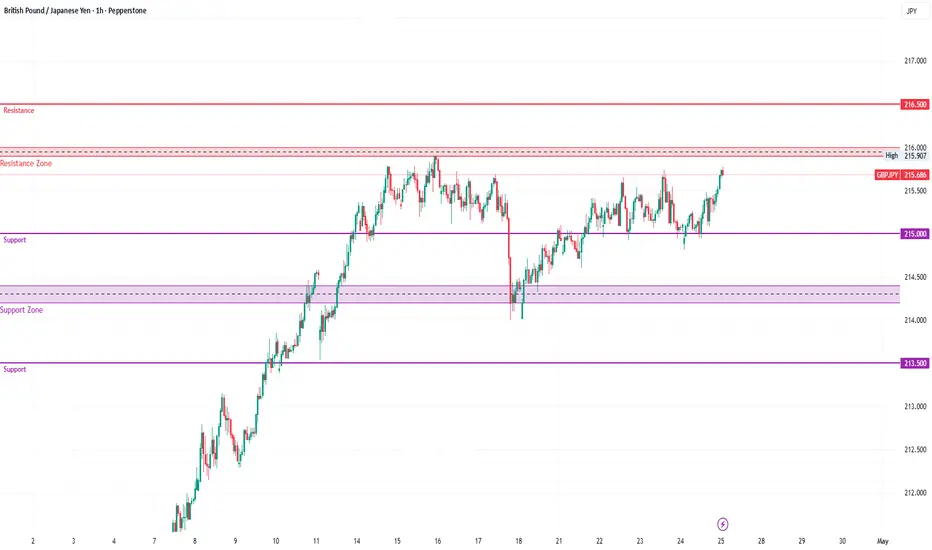
GBPJPY (1H) Breakout ya Rejection? Big Move Loading!📊 Pair: GBPJPY
⏱ Timeframe: 1H
Price is currently trading near a **major resistance zone (216) ** — this level will decide the next big move
---
Key Levels:
Resistance: 215.90 – 216.00
Support: 215.00
Strong Support: 214.20 – 214.40
---
Bullish Setup
If price gives a *clean breakout + retest above 216*
Entry: 216.00 (after retest)
Targets: 216.50 / 217.00 / 217.50
Stop Loss: 215.40
Trend is bullish → continuation likely
---
Bearish Setup
If price shows *rejection or fake breakout near 216*
Entry: 215.80 – 216 zone
Targets: 215.00 / 214.50 / 214.20
Stop Loss: 216.30
Possible liquidity grab + reversal
---
Swing Setup
Buy above 216 (strong close) → Target 217.50+
Sell below 214.80 → Target 213.50
---
Final Thought:
👉 216 = Key Decision Zone
👉 Breakout = Strong Rally
👉 Rejection = Sharp Drop
**Wait for confirmation. Avoid FOMO OANDA:GBPUSD **
---
💬 What do you think — Breakout or Rejection? Comment below 👇
❤️ Like & Follow for more trade setups!
Community ideas
April 26, 2026 KO. Continued stock growth.- Exchange: Kraken
- Instrument: KOx/USD (xStocks)
- Timeframe: Weekly
- Trade type: Buy limit order
- Price: 77.01
- Take Profit: Open
- Stop Loss: 74.55 (-3.20 %)
Idea: Long on a breakout above last week's high — bullish momentum continuation.
Entry: Buy limit order above last week’s high.
Stop-loss: Below the low of the same candle. A pullback below this level invalidates the trade.
Take Profit: Trailing stop following the lows of new weekly candles.
This is not an individual investment recommendation.

Gold weekly chart with buy and sell levels 26/04/261. The Sell Level: 4,695 (Breakdown Entry)The reason for a sell order here is the liquidity grab below the major psychological level.
Psychological Support: The 4,700 mark is a massive "round number" level. Banks and institutions often place "Buy" orders just above it and "Stop Losses" just below it.
The 1h(S) Zone: I have marked a green support zone (Demand Zone) exactly at $4,694. By placing a Sell at 4,695, I are betting that if the price breaks this floor, it will trigger a "long liquidation" (stop losses hitting), which fuels a fast move down toward the next support at 4,678 (4h S).
Trend Confirmation: The red moving average the 200 EMA is currently above the price. This indicates a bearish "sell-on-rally" sentiment in the short term.
2. The Buy Level: 4,740 (Breakout Entry)This level is placed at the 1h(R) Resistance Zone.
Resistance Reclaim: 4,740 has acted as a ceiling where sellers have repeatedly stepped in.
A "Buy" here is a momentum play; if the price can clear this hurdle, it proves that buyers have regained control.Dynamic Resistance: The red moving average is currently acting as a "roof" around the 4,750–4,760 area. Reaching $4,740 puts the price in a position to challenge that trendline.Targeting Supply:
If 4,740 breaks, the next logical magnet for the price is the red supply zone at 4,764, where previous selling pressure originated.
Summary Buy4,7401h Resistance (R)Breakout: Entry above the immediate "ceiling" to target the next supply at 4,764.
Sell 4,6951h Support (S)Breakdown: Entry below the 4,700 floor to catch a flush toward the 4,678 4h support.
Critical Note:
We are currently in a Consolidation Phase (the price is bouncing between these two levels). In Gold trading, this is often referred to as a "no-trade zone." The most successful move is usually waiting for the price to hit one of the marked "trigger" levels rather than guessing the direction while it's in the middle.

WTL ProjectionsThe stock declined approx 56% and has already given a gain of 42%.
Now needs to sustain the Grey Zone to be able to move to the upper marked projection zone(s). Lets c how the stock moves....

Silver Rejection From Trendline, Building MomentumThe chart shows a clear reaction after interacting with a descending trendline, followed by a steady upward push. Price is now forming higher lows, indicating improving structure.
A controlled retracement could provide stability before the next move higher. The highlighted resistance area above may act as a reaction zone, but sustained movement could lead to continuation.
Important Zones:
Pullback Area: 75.4 – 75.9
Key Resistance: 77.0 – 78.0
Projected Targets:
77.2
78.0 – 78.8
79.8

QUARTER 1 THE TARGETcurrently price Looks as if it will reach Quarter 1 open before a retest so am in this Move already incase the market decides to do so as we don't control the market, This is just one Trade if it is a losing Trade then it will be a small loss, if it is a winning Trade then the Profits will be Massive, however this Trade will take days to weeks before Tp

US30 4H – Liquidity Grab Before Final Leg Higher?The index has pushed strongly to the upside, but the recent price action is no longer impulsive, it’s starting to stall and compress near highs. This shift matters. Strong trends don’t slow down without a reason.
The current structure suggests a potential short-term pullback to clear out late buyers before continuation. This type of move is designed to create doubt, shake confidence, and reset positioning before the next expansion phase.
If that liquidity sweep plays out, it sets the stage for a cleaner move higher but if buyers fail to step back in after the pullback, the structure starts to weaken and opens the door for a deeper unwind.
Right now, this isn’t a trend to chase, it’s a setup being built.
Disclosure: We are part of Trade Nation's Influencer program and receive a monthly fee for using their TradingView charts in our analysis.

AUDCHF ShortTrade Description (AUDCHF – 4H)
This setup is based on a Smart Money Concept (SMC) reversal model combining accumulation, manipulation, and liquidity targeting at higher timeframes.
🧠 Market Context
Price formed a clear accumulation phase after a downtrend, indicating institutional positioning.
This was followed by a manipulation move (liquidity sweep) to trap sellers and induce late buyers.
Market then broke a key structure level, confirming a shift in order flow (bullish intent).
🎯 Entry Logic
Price is currently reacting at a high-probability supply zone aligned with:
Weekly High
Monthly High
This area represents a liquidity pool, where institutions are likely to distribute positions.
The rejection from this zone suggests potential short opportunity.
📉 Trade Idea
Type: Sell (Reversal Setup)
Entry Zone: Near Weekly/Monthly High resistance (highlighted supply zone)
Stop Loss: Above the supply zone (above liquidity highs)
Take Profit: Toward lower liquidity / imbalance zone (previous demand area)
⚡ Confluences
Accumulation → Manipulation → Distribution model (AMD)
Liquidity sweep above highs
Reaction from higher timeframe supply
Structural shift (break of key level)
Institutional order block interaction
🔥 Key Insight
This trade targets liquidity engineered above equal highs, expecting smart money to reverse price after completing distribution.
⚠️ Risk Note
This setup requires confirmation (e.g., rejection candle, lower timeframe shift) before execution to avoid false breakouts above highs.

SILVER: Growth & Bullish Continuation
Looking at the chart of SILVER right now we are seeing some interesting price action on the lower timeframes. Thus a local move up seems to be quite likely.
Disclosure: I am part of Trade Nation's Influencer program and receive a monthly fee for using their TradingView charts in my analysis.
❤️ Please, support our work with like & comment! ❤️

EURGBP Weekly Outlook: Hunting for the Next Order BlockBased on current market conditions as of April 26, 2026, your specified levels for EURGBP align closely with the current technical structure. The pair is currently trading near 0.8664, showing a bearish lean below key moving averages.
Here is a technical analysis of your breakout scenarios:
Current Market Context
Trend: Short-term bearish. Price is holding below the 100-day and 200-day SMAs (located near 0.8699 and 0.8705).
Sentiment: The British Pound (GBP) remains resilient due to firm UK inflation data (3.3% YoY), while the Euro (EUR) is facing pressure from weakening consumer confidence.
Scenario 1: Bullish Breakout (Resistance)
Trigger: Price breaks and sustains above 0.8686.
Target: 0.8703
Analysis: This zone is critical. A break above 0.8686 would signal a recovery from the recent multi-week lows. However, the path to 0.8703 will face heavy "overhead supply" because the 200-day SMA sits exactly at 0.8705.
Confirmation: Watch for a 4-hour candle close above 0.8686 with an RSI rising above 50 to confirm momentum.
Scenario 2: Bearish Continuation (Support)
Trigger: Price breaks below 0.8633.
Target: 0.8611
Analysis: The level 0.8633 acts as a major psychological and structural floor. If this support fails, there is very little historical "noise" to prevent a slide toward 0.8611. This would represent a fresh bearish leg in the descending channel.
Confirmation: A break of 0.8633 would likely be triggered by further "hawkish" sentiment from the Bank of England or continued Euro weakness.
Trading Note
The EURGBP is known for low volatility (averaging 40–70 pips daily). Your targets (17–22 pips from the triggers) are highly realistic for intraday scalping or short-term swing trades. Since the pair is currently in a "choppy" phase, look for volume expansion during the London session overlap for the most reliable breakout signals.

DXY Correction in Progress Before Potential Bullish ContinuationThe chart shows an overall bullish structure following an accumulation phase in February, which led to a strong impulsive move in early March and a break above previous resistance. Since then, price has been consolidating within a higher range, with the 99.0–99.2 zone acting as a key pivot level, confirmed by multiple reactions. Recently, price faced rejection around this area and is now pulling back toward a lower demand zone near 97.7–98.0, which could act as a foundation for a potential rebound. As long as this support holds, the most likely scenario remains a short-term correction followed by a bullish continuation toward the upper liquidity zone around 100.5. However, a clear break below 97.7 would invalidate this bullish outlook and could lead to a deeper bearish move.

TMUS | Weekly | Fibonacci StructurePrice did exactly what it was supposed to do.
Hit the top of the range, got rejected, and sold all the way back down to the bottom. Clean. If you understand how ranges work, none of this was a surprise.
Every stock moves between two zones **Wholesale** and **Retail**. Same concept as shopping. You want to buy where it's cheap, not where it's expensive.
- $180 — Wholesale.** Bottom of the range. Where the deal is.
- $215 — First checkpoint.** Buyers need to prove themselves here.
- $237 — Middle of the range.** This is where momentum either builds or dies.
- $272 — Retail.** Top of the range. Where it was overpriced before it dropped.
- $328 — Extension target.** Where this goes if everything plays out.
Right now price is at $189. Just above the deal zone. Looks attractive on the surface.
But here's what most people miss cheap doesn't mean ready. A stock can sit at the bottom and keep going lower. The price being low is not a reason to buy. A confirmed reaction is.
I'm not interested until I see a weekly close above $215. That tells me buyers actually showed up not just visited.
The map is drawn. Most people just can't wait long enough to use it.

Bitcoin could drop nowHi traders,
Last week Bitcoin reached the target into the bearish Monthly FVG and completed the bigger (overlapping) complex WXYXZ-correction (grey).
So now this pair is ready to drop.
But we could see a retest of the bearish Monthly FVG so wait for price to close below the bullish Daily FVG to confirm the bearish reversal.
Let's see what the market does and react.
Trade idea: Wait for price to close below the bullish Daily FVG. After a move down, a small correction up and a change in orderflow to bearish, you could trade shorts.
This shared post is only my point of view on what could be the next move in this pair based on my technical analysis.
But I react and trade on what I see in the chart, not what I've predicted or expect.
Manage your emotions, trade your edge!
Eduwave

$BTC in distribution patternIf you trade the Wyckoff method you'll see that we're possibly forming a UT in Phase B. Once price breaks below $76100 we can confirm this distribution stage. What would invalidate this distribution is a solid candle closing above $79500. Price dropping to 36K is a real possibily after this 50% retracement

LONGThe price is moving in an upward direction. Looking to enter the trade after a clear confirmation within the coming week

GBPUSD 4H – Compression Before Breakout, Expansion LoadingAfter a strong impulsive move higher, price is now consolidating in a tight range, showing signs of controlled compression rather than weakness. This type of structure typically builds liquidity before the next expansion phase.
The key mistake here is assuming direction too early. This range is designed to trap both breakout buyers and early sellers before the real move unfolds. If buyers maintain control, continuation higher becomes the path of least resistance. If not, the unwind could be sharp.
Right now, it’s not about prediction, it’s about letting the market reveal intent after this compression phase. The next move is likely to be aggressive.
Disclosure: We are part of Trade Nation's Influencer program and receive a monthly fee for using their TradingView charts in our analysis.

GBP/NZD H4 OutlookGBP/NZD has broken out of a descending channel on H4, signalling a bullish shift in structure. Holding above the trendline supports continuation. Look for pullbacks as buy opportunities if they meet your rules. Clean breakout = momentum higher, but a fake out could trigger short-term downside.

Trade idea Gold sell 26/04/26Here's something I am l am looking at for the next day or so.
Am seeing an opportunity for a sell back down to another key level.
Would wait for gold to retrace to previous 4 hour resistance which I have marked at 4764.
If rejected I will enter a sell and hold until 4556 for 2k pips.
If following along please use sensible lot size and risk management .
Gold trading these last few months has been very volatile fast long moves are practically an everyday thing now so be carful
This is the second chart I have posted this will check out my gold weekly chart below

A little bit more upside for S&P500Hi traders,
Last week SPX500USD made a a correction down and went up again as I've said in my previous outlook.
So next week we could see a little bit more upside for this pair to finish (orange) wave 5.
Let's see what the market does and react.
Trade idea: Wait for a correction down. And after a change in orderflow to bullish on a lower timeframe you could trade longs.
This shared post is only my point of view on what could be the next move in this pair based on my technical analysis.
But I react and trade on what I see in the chart, not what I've predicted or expect.
Manage your emotions, trade your edge!
Eduwave

EURUSD 4H – Pullback Before Continuation?Price pushed aggressively to the upside before running into exhaustion, followed by a controlled pullback. The current move looks corrective rather than impulsive, hinting that buyers may still be active beneath the surface.
However, this is exactly the type of structure where traders get caught early, assuming continuation without confirmation. If momentum rebuilds from this zone, the market could transition into the next expansion phase. But failure to do so opens the door for a deeper retracement.
This is a decision point. Either continuation builds from here, or the entire move starts to unwind. Patience and confirmation will separate disciplined traders from emotional ones.
Disclosure: We are part of Trade Nation's Influencer program and receive a monthly fee for using their TradingView charts in our analysis.

#UAI#UAI broke out from its falling wedge pattern and is now consolidating. The 0.3800 target is key for further upward momentum. 📈
#UAI #UAIUSDT #crypto

Double bottomCoreweave has formed a big double bottom pattern with a neckline around $110 current level.
The pattern price target would be around $190 wich means all time high.

RAYUSDT Forming Bullish MomentumHere’s the clean, corrected version for **RAYUSDT** in the same style:
---
RAYUSDT is currently forming a clear bullish momentum pattern, a classic wave structure that often signals an upcoming breakout. The price has been consolidating within a narrowing range, indicating that selling pressure is gradually weakening while buyers are beginning to regain control. With consistent volume supporting accumulation at lower levels, the setup suggests a potential bullish breakout in the near term.
If the price breaks above the wedge resistance, the projected move could be moderate yet rewarding, with a potential gain of around 20% to 30%. This type of bullish momentum pattern is typically seen at the end of downtrends or corrective phases, signaling a possible shift in market sentiment from bearish to bullish.
Traders closely monitoring RAYUSDT are noticing strengthening momentum as it approaches a key breakout zone. The presence of solid trading volume adds confidence to this setup, indicating that market participants may be positioning early in anticipation of a reversal.
Growing investor interest in RAYUSDT reflects rising confidence in its technical structure and overall potential. If the breakout is confirmed with sustained volume, it could mark the beginning of a fresh bullish leg. This setup may offer a valuable opportunity for medium-term traders as momentum builds and the pattern completes.
✅ Show your support by hitting the like button
✅ Leave a comment below (What is your opinion about this coin?)
Your feedback and engagement keep me motivated to share more insightful market analysis with you!
