Tesla Facing Heavy Resistance Near $382 – Short Setup This WeekCurrent Price: 376.3
Direction: SHORT
Confidence level: 62%(Several professional traders describe Tesla as being in a short-term downtrend with repeated resistance around $381-$382 and downside targets around $370-$368 and $352. Social sentiment is mixed but slightly supportive of upside, lowering confidence somewhat.)
Targets
Target 1: 368
Target 2: 352
Stop Levels
Stop 1: 382
Stop 2: 388
Wisdom of Professional Traders:
This analysis synthesizes insights from thousands of professional traders and market experts, combining what traders are saying across platforms to identify solid setups. When several experienced traders independently highlight the same price levels and structure, it often reveals where institutional positioning and liquidity are concentrated.
Key Insights:
Here's what's driving this setup. Several professional traders consistently described Tesla as being in a short‑term technical downtrend despite the long‑term AI narrative around the company. What caught my attention is how many traders pointed to the same resistance band around $381–$382. Price has tested this area repeatedly but hasn't been able to reclaim it convincingly.
At the same time, multiple traders highlighted downside levels around $370–$368 as the immediate support zone. When I look at the chart structure described by these traders — lower highs, price below key EMAs, and weak relative strength compared with the broader tech index — it suggests sellers are still active on rallies.
Another thing worth noting: several traders also mentioned a potential gap target around $352. That level shows up across multiple analyses and lines up with a logical liquidity pocket if the $368 support breaks this week.
Recent Performance:
Tesla has been lagging the broader tech rally. While the Nasdaq pushed higher recently, TSLA only posted small gains and continues forming a pattern of lower highs. The stock traded between roughly $370 and $382 recently, which reinforces that $382 ceiling traders are watching closely.
Volume hasn't exploded either, which suggests the move upward lacks strong institutional conviction. In other words, buyers aren't stepping in aggressively yet.
Expert Analysis:
This move has traders talking. Several professional traders pointed out that Tesla is still trading below key moving averages, which usually signals short‑term weakness until reclaimed.
What's interesting is that many traders agree momentum only shifts if price decisively breaks above $381–$382. Until that happens, rallies into that zone tend to attract sellers. The same traders also flagged downside levels at $370–$368 as the key breakdown area.
And if that support cracks, the next magnet mentioned by multiple traders is the $352 gap region. That's why I'm using it as the second downside target for this week.
News Impact:
Recent headlines are a mixed bag. Tesla continues pushing big AI and autonomous ambitions — including robotaxi development and chip partnerships — but investors are still reacting to rising capital expenditures and slower EV growth.
Regulatory pressure around Full Self Driving is another wildcard. If negative headlines emerge around that investigation, it could accelerate downside momentum quickly.
Trading Recommendation:
Putting it all together, I'm taking a SHORT position on Tesla this week while price trades below the $382 resistance cluster. The risk‑reward looks reasonable because the stop is clear while downside targets align with levels many traders identified.
Entry around the current range ($374–$378) offers a move toward $368 as the first objective. If that support breaks, the trade could extend toward $352 where a gap fill becomes likely.
Risk management matters here. I’d cut the trade if TSLA reclaims $382 and especially if it pushes through $388, because that would invalidate the bearish structure traders are watching.
Community ideas

Apple Holding $267 Support – Traders Eye $280 Break This Week:Current Price: 271.06
Direction: LONG
Confidence level: 68%(Several professional traders highlighted $267 as key support with upside targets at $280 and $288. X sentiment also shows significantly more bullish than bearish signals, though earnings volatility lowers conviction slightly.)
Targets
Target 1: 280
Target 2: 288
Stop Levels
Stop 1: 267
Stop 2: 263
Wisdom of Professional Traders:
This analysis synthesizes insights from thousands of professional traders and market experts, combining what traders are saying across platforms to identify strong setups. The collective wisdom of traders often surfaces key levels earlier than individual analysis because experienced market participants repeatedly highlight the same support and resistance zones in Apple.
Key Insights:
Here’s what’s driving this setup right now. Several professional traders repeatedly pointed to the $267 level, which aligns with a 61.8% Fibonacci retracement and has become the key line in the sand. As long as Apple holds above that level, traders expect momentum to shift back upward.
Multiple traders also mentioned $280 as the first upside magnet. That level represents the February high and sits just above the current consolidation range. If price pushes through that area, the next level traders consistently highlighted is $288, which lines up with Apple’s previous all‑time high zone.
What’s interesting is the broader market context. Mega‑cap earnings week puts Apple in the spotlight alongside Microsoft, Amazon, Meta, and Alphabet. Several traders believe Apple has lagged other Magnificent Seven names recently, which creates the possibility of rotation into Apple if sentiment improves.
Recent Performance:
Apple recently rebounded from a $245 swing low and has been stabilizing in the $267–$272 range. Price action shows buyers repeatedly stepping in near support while sellers have struggled to push the stock meaningfully lower. The stock did finish one recent session as the only red name among the Magnificent Seven, which actually caught traders’ attention because lagging leaders often become short‑term catch‑up trades.
Expert Analysis:
Traders focusing on technical structure keep returning to the same idea: hold $267 and the bullish structure remains intact. Several traders said that if Apple maintains this support after earnings volatility, the stock has room to test $280 quickly.
Another interesting perspective from the trading community comes from options positioning. Multiple traders highlighted strategies selling deep out‑of‑the‑money puts around $215, noting the extremely high probability of expiring worthless. That doesn’t give us a short‑term price target, but it shows traders see limited downside risk relative to the current price.
Meanwhile, X sentiment analysis shows 27 bullish vs only 2 bearish signals out of 64 trading tweets, which reinforces the idea that market participants are leaning toward upside continuation.
News Impact:
The upcoming Apple earnings release in late April 2026 is the major catalyst this week. Expectations are roughly $1.93 EPS and about $109B revenue, with traders focusing heavily on iPhone demand and services growth. Another development drawing attention is Apple’s move to allow in‑app crypto payment integrations, potentially exposing over a billion users to crypto transactions. That’s not an immediate earnings driver, but traders view it as a long‑term ecosystem expansion.
Trading Recommendation:
Here’s my take. As long as Apple stays above $267, the risk‑reward favors a LONG position targeting $280 first and $288 if momentum accelerates. I’d treat $267 as the primary stop and $263 as the fail‑safe support level. The setup works because the downside risk is relatively small compared to the upside potential toward prior highs.
If price breaks above $275–$276, momentum traders will likely step in quickly, which could push Apple toward the $280 target within days. But if $267 fails, the bullish structure breaks and I’d exit immediately.

GBPAUD bearish sideways consolidation The GBPAUD continues to display a bearish outlook, in line with the prevailing downward trend. Recent price action suggests a sideways consolidation, potentially setting up for another move lower if resistance holds.
Key Level: 1.9030
This zone, previously a consolidation area, now acts as a significant resistance level.
A failed test and rejection at 1.9030 would likely resume the bearish momentum.
Downside targets include:
1.8800 – Initial support
1.8760 – Intermediate support
1.8700 – Longer-term support level
Bullish Scenario (breakout above 1.9030):
A confirmed breakout and daily close above 1.9030 would invalidate the bearish setup.
In that case, potential upside resistance levels are:
1.9070 – First resistance
1.9120 – Further upside target
Conclusion
GBPAUD remains under bearish pressure, with the 1.9030 level acting as a key inflection point. As long as the price remains below this level, the bias favours further downside. Traders should watch for price confirmation around that level to assess the next move.
This communication is for informational purposes only and should not be viewed as any form of recommendation as to a particular course of action or as investment advice. It is not intended as an offer or solicitation for the purchase or sale of any financial instrument or as an official confirmation of any transaction. Opinions, estimates and assumptions expressed herein are made as of the date of this communication and are subject to change without notice. This communication has been prepared based upon information, including market prices, data and other information, believed to be reliable; however, Trade Nation does not warrant its completeness or accuracy. All market prices and market data contained in or attached to this communication are indicative and subject to change without notice.

Sliver daily swing long Sliver up trending disrespecting premium pd arrays daily swing highs. Gold doing the same thing.

GBPUSD bullish continuation pattern breakout supported at 1.3480The GBPUSD currency pair continues to display a bullish outlook, in line with the prevailing trend. Recent price action suggests a sideways consolidation, potentially setting up for another move higher if support holds.
Support Zone: 1.3480 – a key level from previous consolidation. Price is currently testing or approaching this level.
A bullish rebound from 1.3480 would confirm ongoing upside momentum, with potential targets at:
1.3630 – initial resistance
1.3656 – psychological and structural level
1.3682 – extended resistance on the longer-term chart
Bearish Scenario:
A confirmed break and daily close below 1.3480 would weaken the bullish outlook and suggest deeper downside risk toward:
1.3457 – minor support
1.3430 – stronger support and potential demand zone
Outlook:
Bullish bias remains intact while the GBPUSD holds above 1.3480. A sustained break below this level could shift momentum to the downside in the short term.
This communication is for informational purposes only and should not be viewed as any form of recommendation as to a particular course of action or as investment advice. It is not intended as an offer or solicitation for the purchase or sale of any financial instrument or as an official confirmation of any transaction. Opinions, estimates and assumptions expressed herein are made as of the date of this communication and are subject to change without notice. This communication has been prepared based upon information, including market prices, data and other information, believed to be reliable; however, Trade Nation does not warrant its completeness or accuracy. All market prices and market data contained in or attached to this communication are indicative and subject to change without notice.

#OPEN/USDT Bulls are back on $OPEN#OPEN
The price is moving in a descending channel on the 1-hour timeframe. It has reached the lower boundary and is heading towards breaking above it, with a retest of the upper boundary expected.
We have a downtrend on the RSI indicator, which has reached near the lower boundary, and an upward rebound is expected.
There is a key support zone in green at 0.2207. The price has bounced from this zone multiple times and is expected to bounce again.
We have a trend towards consolidation above the 100-period moving average, as we are moving close to it, which supports the upward move.
Entry price: 0.2300
First target: 0.2361
Second target: 0.2432
Third target: 0.2530
Don't forget a simple principle: money management.
Place your stop-loss order below the support zone in green.
For any questions, please leave a comment.
Thank you.

MSFT - Microsoft Corp.Microsoft Corp engages in the development and support of software, services, devices, and solutions. It operates through the following business segments: Productivity and Business Processes; Intelligent Cloud; and More Personal Computing. The Productivity and Business Processes segment comprises products and services in the portfolio of productivity, communication, and information services of the company spanning a variety of devices and platform. The Intelligent Cloud segment refers to the public, private, and hybrid serve products and cloud services of the company which can power modern business. The More Personal Computing segment encompasses products and services geared towards the interests of end users, developers, and IT professionals across all devices. The firm also offers operating systems; cross-device productivity applications; server applications; business solution applications; desktop and server management tools; software development tools; video games; personal computers, tablets; gaming and entertainment consoles; other intelligent devices; and related accessories. The company was founded by Paul Gardner Allen and William Henry Gates III in 1975 and is headquartered in Redmond, WA.

#TONUSDT : Bullish Wave Still In Progress#TON
The price is moving within a descending channel on the 1-hour timeframe and has reached the lower boundary. It is now poised for a bounce and is expected to retest this boundary.
The Relative Strength Index (RSI) indicates a downward trend, which is likely to continue given the overbought conditions.
There is a key support zone (in green) at 1.250, and the price has bounced off this zone several times, making it a strong support level.
The price is trending towards the 100-period moving average, which we are approaching. This trend supports an upward move.
Entry Price: 1.295
Target 1: 1.319
Target 2: 1.338
Target 3: 1.360
You can stop at the first and second targets and close the price, or continue towards the third target. Stop Loss: At the resistance zone (in green).
Remember this simple rule: Money Management.
Any questions? Please leave a comment.
Thank you.

HBAR Wave 2 bottom playCRYPTOCAP:HBAR could also be putting in a major wave 2 bottom hinting at a strong wave 3 rally to all-time high and beyond ahead.
Breaking out above the R1 daily pivot will flip the local structure bullish

Decoding General Dynamics: Strategy & TechMacroeconomics and Geostrategy
Global instability drives massive European rearmament initiatives today. Nations aggressively expand their defense budgets to counter emerging threats. General Dynamics capitalizes heavily on these urgent macroeconomic shifts. Rapid geopolitical realignments force NATO allies to modernize aging military fleets. This aggressive geostrategy creates sustained demand for advanced combat systems. Robust global defense spending fuels undeniable economic growth for top contractors. Supply chains adapt swiftly to meet escalating international orders. Investors closely monitor these macroeconomic indicators for long-term stability. Consequently, General Dynamics secures highly lucrative, multi-year government contracts worldwide.
Management and Business Models
Assertive management directly drives General Dynamics' recent financial successes. Leaders prioritize a highly resilient, diversified business model. They secure vital revenue streams through continuous Pentagon contracts. Recently, the company secured a $450 million Marine Corps reconnaissance vehicle contract. Furthermore, Abrams tank support revenues recently surpassed $1 billion. These strategic wins validate management's aggressive corporate vision. Industry trends heavily favor proven, reliable military contractors over risky startups. Agile leadership adapts resource allocation to meet rapid government demands. This proactive culture ensures steady cash flow and soaring investor confidence.
Technology and Cybersecurity
General Dynamics leads the high-tech defense sector aggressively. The GDIT division recently certified autonomous surveillance towers for the US borders. These high-tech systems utilize advanced sensors and artificial intelligence. Autonomous border monitoring represents a critical technological leap forward. Furthermore, robust cybersecurity protocols protect these vulnerable data networks. Hackers constantly target critical national security infrastructure. General Dynamics deploys elite cyber defenses to neutralize digital threats instantly. This technological superiority guarantees reliable intelligence gathering for government agencies. Modern warfare demands unbreachable, automated surveillance networks.
Science, Innovation, and Patents
A dynamic company culture fosters relentless scientific innovation. Engineers prioritize applied science to develop next-generation combat capabilities. Rigorous patent analysis reveals a massive portfolio of autonomous systems. General Dynamics fiercely protects its proprietary defense technologies. This aggressive intellectual property strategy stifles market competition effectively. Groundbreaking high-tech research continuously improves heavy armor survivability. Researchers focus intently on enhancing battlefield lethality and troop protection. Relentless innovation ensures the company maintains its dominant industry position. Ultimately, scientific superiority guarantees General Dynamics' sustained global influence.

USDCAD TRADE IDEA S01 forex trade idea
Mock 25k
Bullish trend
Dollar index is falling
Making of LLs and LHs

CAUTION in Bitcoin this week, certainly for the next 3 days
Bitcoin has been in a lovely rising channel and the longer this happens, the odds of PA falling out of channel increase. But the best way to look at this, is that it remains in channel until it doesn't...
There are a few reasons why PA may fall out of channel this week,,,,,we need to pay attnetion this week.
Firstly, we have the FED this weekk on 28-29 , Tuesday and Wednesday.
It is widely expected that rates will remain uncganged. And so that may not trigger a fall but it depends w aht Mr Powell says after.
But what is also happening is that thr RSI is getting over bought.
If we zoom out to the Daily charts we can see what happened last time.
Bitcoin Daily chart
And here is that RSI chart, with the same Dashed lines.
The Bold Vertical lines are were the daily RSI is oberbought. And while we are a little below that previous line, we have bumped into current zone 3 times on the RSI chart
See what happened previously on the left.
We may not see the same level of drop as that would take us out of the New channel and THAT would not build confidence at all ..............But, anything is possible right now.
If we do drop out of channel that Red Bar is where I woud expecty us to stop falling, in the 57K-54K range
So, as we get near the end of Month, I am increasingly cautious.
I remind you of the monthly Candle color sequences in recent months.
We had 5 Red ina Row.
This month was expected to be Green and the likelyhood for next month is a return to RED>
So, Caution levels up and lets see what happens over the next few days.

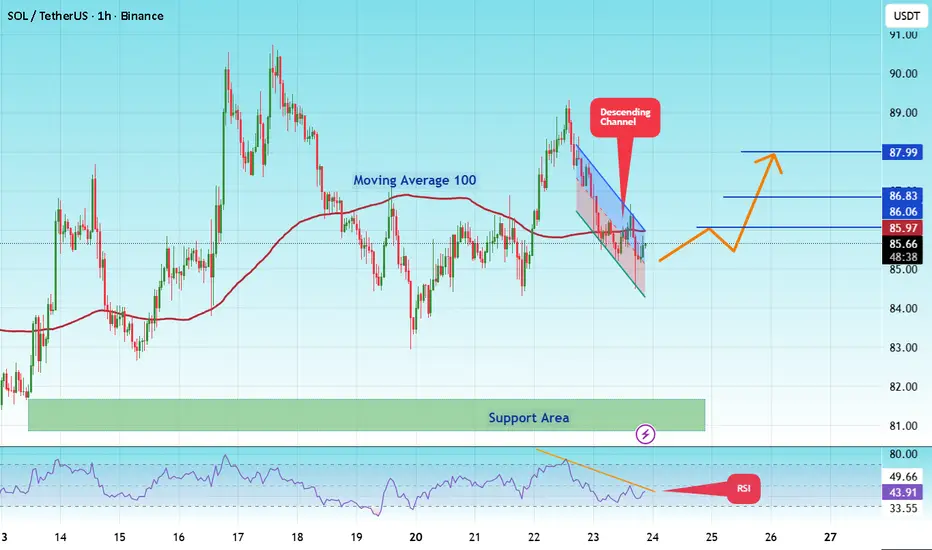
#SOLUSDT Final Liquidity Zone Before Expansion ?#SOL
The price is moving within a descending channel on the hourly timeframe. It has reached the lower boundary and is trending towards a bounce. A retest of this boundary is expected.
The Relative Strength Index (RSI) indicates a downward trend, and this trend is likely to continue due to the overbought condition.
A key support zone (in green) was found at 80.80, and the price has bounced off this zone several times, making it a strong support level.
The price is trending towards the 100-period moving average, which we are approaching. This trend supports an upward move.
Entry Price: 85.21
First Target: 86.00
Second Target: 86.83
Third Target: 88.00
You can close at the second target or wait for the third target to be reached. The choice is yours.
Stop Loss: At the resistance zone (in green).
Remember this simple rule: Money Management.
Any questions? Please leave a comment.
Thank you.
Why I’m NOT Buying This Bitcoin Rally Right NowBitcoin is looking seriously overextended right now, and chasing this pump could be a massive trap. 🚩 While we’ve successfully broken out of that significant accumulation range and seen a powerful rally, the price action is currently screaming "exhaustion." 🛑
In this video, I break down why I’m keeping my capital on the sidelines for a moment. I’m not interested in buying the local top; instead, I’m hunting for a deep retracement into high-consequence liquidity zones. 🎯 I’ll show you exactly which Market Structure Shift (MSS) I need to see on the lower timeframes to confirm a bullish reversal before I even think about going long. 📊
Inside this market breakdown:
Analysis of the previous accumulation range and the breakout momentum. 📈
Why the current rally lacks the fuel for an immediate continuation. ⛽
My specific "Buy Zone" and the structural confirmations I require. ✅
Risk management strategies for a volatile BTC environment. 🛡️
Don't get caught FOMO-ing at the highs. Let the market come to you. 🧘♂️

AUDCAD LongWe are in a bullish trend. we have a fair value gap. hoping to buy to th said level. We join the market at the current rate

US100 BUY 27000On the daily chart, the US100 continues to rise, with a clear bullish trend. Currently, attention should be paid to the support level around 27,000, near the upward trendline. A pullback and stabilization after this level presents a buying opportunity, with an upside target around 28,000.

We in the middle of bear market BTC 20264-Year Cycle Analysis (Halving Cycle) — Is It Still Repeating?
Yes, the 4-year Bitcoin cycle remains highly consistent and continues to repeat so far.
April 2024 Halving → Bull market peak expected around 17 months later (October 2025), which perfectly matches previous historical cycles (2013, 2017, 2021).
2026 is likely to be the classic bear market year, similar to 2018 and 2022.
Historically, market bottoms tend to form 12–15 months after the cycle peak.
If the peak occurs in October 2025, the most probable bottoming zone would be September–December 2026.
My cycle-based projection:
The highest probability bottom is around October 2026 (±1–2 months).
Estimated Bottom Range:
$48,000 – $58,000
Base Case: $52,000 – $55,000

Krypton Nerdz Weekly Trade SignalStrategy: ROCK/PAPYER/ SCISSORS
Broke out of ROCK TRADE
Timeframe Markup: 1HR
POSITION: WAITING FOR SELL
Price broke out of our rock trade Leading us to take profit 1. And then pulled back allowing us to look for a 2nd opportunity to get into a SELL position. Currently waiting for the market to retest and close below the white 50% line @ 186.988 for a sell
Still being mindful it is in the middle of consolidation. We need an alert of the top @ 186.874 and the bottom @ 186.439. If it does break above and enter the top consolidation box we are still in safe zone as long as it doesn't break past this box but instead giving up a higher entry point for a sell.
Lastly we need an alert at our Earth 186.313
After price breaks out we will use the FIB tool to locate our TAKE Profit 1 and 2.

The Ultimate Bull Signal: Can Bitcoin Rally Without Saylor’s BidBitcoin has spent the past month trading as if one buyer, Strategy, matters more than everyone else. When Strategy is in the market, BTC finds support. Conversely, when Strategy steps back, the tape softens quickly.
Last week, the company bought 34,164 BTC for $2.54bn, taking its total holdings to 815,061 BTC. Strategy’s Time-Weighted Average Price (TWAP) was real spot demand landing into a market that is still trying to decide whether this move can stand on its own at a critical resistance level near $80k.
In March, post ex-dividend week, Strategy significantly slowed down with its BTC purchasing, simultaneously dragging down BTC’s price. BTC has held its price because Strategy was there, and the next move depends on whether that bid is still there once the ex-dividend window has passed.
March already showed the risk. Strategy bought hard into the window, then backed off, and BTC lost altitude almost immediately. April is the same setup going into the post-ex-dividend weeks. The real question is whether Strategy keeps buying once the dividend window closes.
If April avoids the post-dividend fade we saw in March, the bull case for BTC becomes much stronger. If not, then this was simply a larger version of the same pattern.
TLDR:
Strategy is the largest margin buyer in the market, heavily driving Bitcoin returns in the last month proven by recent US-hours rallies.
The March Pattern: Strategy bought BTC heavily heading into the NASDAQ:STRC ex-dividend window, but BTC prices saw a sharp drop in the following two weeks.
The April Difference: So far, BTC has not suffered the post-dividend fade, holding strong around $77.5k as of 22 April.
The Signal: The upcoming 8-K filing (due 27 April) is crucial in determining whether Strategy actually keeps buying after the ex-dividend window closes.
The Long-Term Risk: Strategy’s 11.5% dividend rate is expensive. If capital markets tighten, they may eventually be forced to sell BTC or dilute stock to fund it.
Bitcoin's Biggest Marginal Buyer: Strategy
In the past month, almost all BTC returns were generated during US trading hours – partially coming from Spot ETFs, but mostly from Strategy’s buy pressure. The cleanest way to read this move is not as a vague “risk-on” rally, but as a concentrated US bid supported by ETF flows. Farside’s daily data show net inflows of about $1bn, highlighting meaningful demand.
However, this still doesn’t fully explain the tape on its own. Strategy’s $2.54bn buy in the week ending 19 April was larger than those ETF net inflows, lending support to the idea that the better read is not that “ETFs were absent,” but that both ETFs and Strategy were buying. Strategy’s bid was large enough to be one of the most important marginal bids in the market, which also fits the session chart. With almost all the returns landing in US hours, and one of the largest US buyers putting $2.54bn to work, Strategy’s relevance to BTC’s price is hard to understate.
The True Rally Test Comes After Ex-Dividend
In March, Strategy heavily bought into the NASDAQ:STRC ex-dividend window, but BTC’s price saw a sharp drop in the two weeks after. In the week ending 22 March, NASDAQ:STRC demand collapsed from $1.18bnto just $76.5m. MSTR’s common ATM activity dropped to zero as well. In the week ending 29 March, combined ATM proceeds fell to zero. Strategy bought no BTC at all for the first time in 13 weeks.
The two-week silence from Strategy accompanied by BTC dropping during the same time, remains the clearest example of why Strategy is instrumental to BTC’s price action. BTC drifted down into the low $70k region, printing roughly $70.4k on 20 March and $70.6k on 23 March. The tape reflected the reality: when STRC stops and MSTR common doesn’t backfill the gap, the bid weakens materially.
As such, the key question now is whether April repeats March’s hangover or breaks the pattern.
The next 8-K, due 27 April, covers the week ending 26 April. If STRC issuance drops again to a rounding error and MSTR common ATM stays near zero, April remains a larger version of March, not a regime change. However, if STRC remains active and MSTR common ATM comes in at a meaningful level — north of $150m — then the script has changed.
BTC Has Not Broken Yet: Why April Matters
15 April 2026 marked the NASDAQ:STRC ex-dividend date for April, with STRC dividends still running at an annualised rate of 11.50%. In the week ending 19 April, Strategy raised $2.5bn and bought 34,164 BTC, acting as an enormous burst of demand. However, the real narrative is what has happened to BTC since then: unlike March, BTC has not seen immediate price drops.
It can be argued that Strategy has changed the market dynamic. However, the upcoming filing matters a lot more than the previous one. If the usual post-dividend fade appears, then April may just be a replay of March price action. If not, then the market has to seriously consider that Strategy is not just buying into the window, but supporting BTC beyond it.
Will the BTC Buying Continue?
This is the part that actually matters for traders.
Nobody gets paid for noticing that Strategy bought a lot of BTC last week. What matters is whether that buying continues once the clean ex-dividend setup is gone.
March tells us that a huge ex-dividend week, by itself, is not enough. Strategy bought 22,337 BTC in the reporting period ending 15 March, then effectively vanishing for the next two weeks. BTC weakened accordingly.
April tells us that the door is still open for a different outcome, because Strategy bought 34,164 BTC, and the BTC tape has not yet followed March lower.
The setup here is straightforward. If the next 8-K shows meaningful post-ex-dividend buying, the market will have to assume the bid is still alive. If it shows another sharp drop in issuance, then March was the operating pattern and not an accident.
Why This Is Bullish Now — But Raises Concerns In The Future
As of April 2026, STRC is running at an annualised dividend rate of 11.50%, which is fine while the market is happy to fund the structure and while BTC is cooperating, but becomes much less comfortable if BTC stalls and the capital markets stop being generous.
While this is a medium-term issue, and not the immediate trading setup, it is still real. The flywheel works best when BTC is rising and investor appetite is strong.
As such, the cleanest framing is: Strategy is bullish for BTC while it is buying, but that does not mean the structure is risk-free. For now, the market only needs to care about the first half of that sentence.
Final Take
BTC has recently traded like a market with one unusually large marginal buyer driving it: Strategy. March was an example of what happens when that single buyer disappears. April’s price action is likely to follow a similar path when Strategy’s NASDAQ:STRC halts capital raise for the first two weeks after ex-dividend.
So the right way to read this market is not to obsess over the last headline purchase number, but to ask a much simpler question: is Strategy still bidding BTC once the obvious window is over? If the answer is yes, BTC likely keeps finding support. If the answer is no, then BTC is about to find out what it looks like without its biggest visible marginal buyer underneath it.

# TSLA — Intraday Preview for 04-27
Heading into Monday's session, TSLA closed Friday at 373.63 and the premarket quote sits at 375.27 — essentially flat, with a gap of just -0.02% off the prior close. No meaningful overnight gap to navigate, which means the first 15 minutes will be the tell. Friday's session left price below VWAP (376.09) and below both EMAs, with the bias reading bearish-leaning. We're in negative GEX territory with the zero gamma flip sitting well above at 410 — that framing matters a lot for how Monday trades. Forget fading moves; this is a trending environment, and momentum setups are the play.
There's enough structure here to work with. Prior session carved out a clean range with defined walls. The job Monday is to identify which direction breaks and ride it — not pick a side before the open and hope.
---
## 1. Session Context — Where We Left Off
Friday opened at 373.55, essentially flat relative to the prior close of 373.63. The opening range (first 15 minutes) was wide: 370.73 low to 382.63 high, a span of nearly 12 points. Price pushed up to a session high of 382.76, then faded and closed at 373.63 — back at the bottom of that range and below VWAP at 376.09.
The 9 EMA closed at 375.27 and the 20 EMA at 375.31 — nearly converged, sitting right at current premarket price. Price ended the session below both. Premarket had ranged 373.55 to 378.00 on Friday, and the prior day high/low bracket sits at 386.00 and 368.39. Friday's close near the lower portion of a wide opening range, below VWAP, and below both EMAs is not a strong hand heading into Monday. The burden of proof is on the bulls to reclaim 376.09 VWAP early.
---
## 2. GEX (Gamma Exposure) — Negative GEX Regime, Trend Day Risk
Total GEX for TSLA sits at approximately 26,882,611 — and critically, spot is below the zero gamma flip at 410. That puts us firmly in a negative GEX environment. In this regime, dealers are short gamma, meaning they hedge in the direction of price movement rather than against it. The mechanical effect is amplification: up moves get pushed further up, down moves get pushed further down. Fades are dangerous. Ranges can expand. Mean reversion setups are low-probability.
The call wall lands at 400 (heaviest call GEX concentration at 548.53), which is the upper resistance target for any bullish momentum. Secondary call concentration at 390 (332.95) and 380 (310.65) provides a stacked resistance structure on the way up — these aren't clean breakout points, they're likely slow-down zones. The put wall sits at 370 (352.94 put GEX), with notable put concentration also at 375 (253.62). That 370 level is the gamma-defined floor — a clean break below it removes dealer hedging support and accelerates downside.
The GEX-implied working range is 370 to 400, with 375 and 380 as internal friction points. Don't expect smooth sailing between any of these strikes in a negative GEX regime.
---
## 3. Key Intraday Levels
**Above price (375.27):**
* 375.31 — 20 EMA, immediate overhead resistance, near-term momentum ceiling
* 376.09 — VWAP (prior session), primary pivot; bulls need this reclaimed to shift bias
* 378.00 — Premarket high, first meaningful overhead test
* 380.00 — Call GEX concentration strike, intraday resistance
* 382.63 — Opening range high (prior session), major structural resistance
* 382.76 — Prior session high / initial balance high
* 386.00 — Prior day high, upper structural resistance
* 390.00 — Secondary call wall, significant resistance
**Below price (375.27):**
* 375.00 — Round number and GEX put concentration near 375 strike, first support
* 373.55 — Prior session open / premarket low, support base
* 373.63 — Prior session close, key reference
* 370.73 — Opening range low / initial balance low (prior session), major breakdown level
* 370.00 — Put wall, heaviest put GEX concentration; losing this opens downside
---
## 4. Scalp Setups — What to Watch at the Open
**Long scalp: VWAP reclaim and hold**
If Monday opens near current levels and price pulls back to test 373.63 to 373.55 (prior close and session open) and holds, then rallies to reclaim VWAP at 376.09 with a clean green 5-minute close above it, that's the long trigger. Entry around 376.20 on the confirmed VWAP reclaim.
Stop: 374.90 — below the 375 put concentration zone, keeps the loss contained if VWAP reclaim fails.
Target 1: 378.00 (premarket high), take partial there.
Target 2: 380.00 (call GEX concentration / friction zone), trail stop to VWAP on the way.
R:R: approximately 1:1.5 to T1, 1:3 to T2.
Skip this trade if: price opens and immediately gaps above VWAP without giving the pullback entry — chasing into a negative GEX tape is how you get chopped out. Also skip if the 370 put wall breaks pre-market or early session; the setup premise changes entirely.
---
**Short scalp: Opening range low breakdown**
If price opens and can't hold 373.55 (prior session open), sells off through 373.00, and then puts in a failed bounce back toward 373.55 to 374.00 that stalls with a red 5-minute close, that's the short entry. Enter short around 373.00 on the breakdown confirmation.
Stop: 375.35 — above both EMAs; if price reclaims that zone, the short thesis is broken.
Target 1: 370.73 (opening range low / initial balance low), take partial.
Target 2: 370.00 (put wall); in negative GEX, momentum can carry through to the wall cleanly.
R:R: approximately 1:1.5 to T1, 1:2.5 to T2.
Skip this trade if: price reclaims VWAP (376.09) on the open with conviction — the long setup takes precedence and the short side loses its structural case. Also skip if there's no clear rejection candle on the failed bounce; don't short into free air.
---
## 5. Risk Levels — Where the Framework Breaks
The most important level for Monday's overall framework is the zero gamma flip at 410. Price is a long way from it, which means the negative GEX regime is not in question for this session — we're trending, not mean-reverting, and that should stay the base assumption all day.
Within the session, the 370 put wall is the critical downside risk level. A clean 5-minute close below 370.00 removes put dealer support and shifts the day into potential acceleration lower, where the 360 put concentration (236.97) becomes the next magnet. At that point, don't fight it — trail stops and let momentum work.
On the upside, if price reclaims 382.76 (prior session high) with volume, the bull case opens toward 386.00 and potentially the 390 call concentration. That scenario requires VWAP reclaim first, then opening range high reclaim — it's a two-step process, not one clean move.
---
## Bottom Line
Negative GEX regime, bearish-leaning close, and a wide prior-session range that resolved lower — Monday opens with the burden on bulls to reclaim VWAP, and with momentum-amplifying conditions that can make either direction run further than expected. Trade the break, not the prediction.
No hype. No bias. Just levels.
Trade safe. Plan ahead. Win together.

MSFT This Week TA - April 27Microsoft is pushing higher off a multi-week low, but it's doing so inside a developing bear flag — and that rally is now running directly into a wall of moving average resistance. Price is at 423.88, sitting between two meaningful levels, and the next few sessions are going to clarify whether this is a genuine recovery or just a setup for another leg down.
This is a critical juncture. The bounce off the lows looks constructive on the surface, but the macro structure is still broken until MSFT can reclaim levels it's meaningfully below. The range here is tight, and the resolution matters.
**1. Context — Bearish Until the Weekly 50 Is Reclaimed**
The bias is bearish, and the reason is straightforward: MSFT is trading at 423.88, well below the weekly 50 SMA at 468.99. That's the line that defines the macro trend. Below it, this is a stock in a bearish structure, regardless of how the daily action looks on any given week.
The weekly 21 SMA sits at 427.19 — that's only about three dollars above current price, and it's the first overhead moving average that needs to be dealt with. The daily 200 SMA is even further out at 470.10, essentially converging with the weekly 50 as a zone of major supply. Until MSFT gets above those levels and holds, the trend is down. The daily 21 and daily 50 — at 390.73 and 394.06 respectively — are both below price, which gives the near-term structure a floor, but the bigger picture remains compromised.
**2. Pattern and Setup — Bear Flag in Progress**
On the daily timeframe, MSFT is tracing out a bear flag. The prior impulsive move took price from the mid-400s all the way down to a recent pivot low of 356.28. What's followed is a controlled, multi-week consolidation and bounce — the kind of grinding, orderly recovery that often resolves back to the downside rather than marking a genuine reversal. The recent pivot high came in at 413.05, and current price at 423.88 has pushed through that level, which is worth watching. But the flag structure is still intact, and the broader overhead is formidable.
This is a setup where the burden of proof is on bulls. The bounce needs to become a breakout and hold above meaningful resistance — not just retrace into it.
**3. Key Resistance — The Levels Bulls Need to Clear**
The first problem for buyers is right overhead. The weekly 21 SMA at 427.19 is just above current price. That level will likely act as an immediate friction point, and a failure to hold above it after any initial tag would be a clear warning sign.
If price can push through the weekly 21, the next meaningful cluster becomes the VAH from the volume profile at 475.25, which lands in the same general zone as the first hard resistance level at 483.74. That's where price ran into sellers before, and that confluence of volume profile and price structure resistance makes it a high-conviction zone to watch on any extended rally. Just above that sits 489.70, the outermost resistance level — clearing and holding that would represent a significant structural shift, but it's a long way from here with the weekly 50 at 468.99 standing in between as the macro line in the sand.
**4. Key Support — Where the Downside Gets Defined**
Below current price, the first support worth noting is 392.32. That level is close to the POC at 399.64 and essentially right on top of the daily 50 SMA at 394.06 and daily 21 at 390.73. That 390–400 area is a meaningful cluster — a lot of structure is converging there, and if price pulls back to that zone, the reaction will tell us a lot about whether buyers have any real conviction.
Below that, the VAL from the volume profile sits at 384.08, and there's a listed support at 381.71 which also aligns with the weekly 200 SMA at 381.00. That convergence makes the 381–384 zone a significant higher-timeframe support. A break below it would remove the last real structural floor before the pivot low at 356.28, which is both the recent low and the deepest listed support. That level is the line where bear flag continuation starts pointing at an extended move lower.
**5. Targets**
If the bear flag resolves lower, the measured targets lean toward the 356.28 pivot low initially, with the weekly 200 SMA at 381.00 as an intermediate support test. A clean break of 381 opens the door toward the weekly 300 SMA at 342.18 on an extended bear case.
On the upside, a confirmed break above the weekly 21 at 427.19 sets up a run toward the VAH and 483.74 cluster. Reclaiming the weekly 50 at 468.99 and holding it is the only scenario that structurally shifts the bias from bearish to neutral or better.
**6. Indicator Confluence — Mixed Signals, No Clean Read**
The daily RSI at 63.46 is elevated but not yet at extreme overbought territory. It's the kind of reading you see during a strong relief rally — momentum is there, but the room to run without a reset is getting smaller. The weekly RSI at 48.59 is neutral, which reflects the broader indecision in the bigger picture.
On the Stochastic RSI, the daily shows K at 78.03 and D at 86.02 — K has crossed below D, which is a near-term caution signal. That crossover, combined with an already-elevated RSI, raises the risk of a short-term pullback from current levels. The weekly Stoch RSI is at 100, which means the weekly momentum has fully reset and extended to the upside — worth noting as a potential short-term exhaustion signal at the weekly level.
There's no confirmed bearish RSI divergence on the daily, so this isn't an outright sell signal from momentum alone. But the combination of extended daily stochastics and a K/D cross warrants attention if you're managing a long position through this resistance zone.
**7. Levels at a Glance**
Resistance / Upside (above price):
* 427.19 — Weekly 21 SMA, immediate overhead moving average resistance
* 468.99 — Weekly 50 SMA, macro trend line and primary bull/bear divider
* 470.10 — Daily 200 SMA, converges with weekly 50 as major supply zone
* 475.25 — VAH, volume profile resistance
* 483.74 — First hard resistance level, aligns with VAH zone
* 489.70 — Outer resistance, significant structural ceiling
Support / Downside (below price):
* 399.64 — POC, high-volume support node
* 394.06 — Daily 50 SMA, near-term structural floor
* 392.32 — Listed support, clusters with daily SMAs and POC
* 390.73 — Daily 21 SMA, base of the near-term support cluster
* 384.08 — VAL, volume profile support
* 381.71 — Listed support, converges with weekly 200 SMA
* 381.00 — Weekly 200 SMA, major higher-timeframe support
* 356.28 — Recent pivot low and deepest listed support, bear continuation trigger
**Final Thoughts**
The structure here is bearish at the macro level, but there's a real short-term setup developing. Price has bounced hard off the lows and is pressing into resistance. How it handles the weekly 21 at 427.19 in the next session or two will be the near-term tell.
Bull case: MSFT clears the weekly 21 at 427.19 and holds it, builds momentum toward 468.99, and eventually reclaims the weekly 50 SMA. That's the scenario that changes the bias and opens up a genuine structural recovery toward 483.74 and beyond.
Bear case: Rejection at or just above current levels, loss of the 390–400 cluster on any pullback, and a breakdown below the weekly 200 SMA at 381.00. That confirms bear flag continuation and puts the 356.28 pivot low back in play as the next major test, with 342.18 beyond it if that level gives way.
**Bottom Line**
MSFT is in a bear market structure until it reclaims 468.99 and holds it. Everything between here and there is noise unless price can prove otherwise level by level.
No hype. No bias. Just levels.
Trade safe. Plan ahead. Win together.

NIFTY: Breakdown → Pullback at Pivot ZoneNIFTY is currently reacting after a sharp breakdown, now testing the 24,800–25,000 pivot zone.
Structure remains weak as long as price stays below this zone.
Key observations:
• Breakdown followed by pullback
• Reaction at pivot
• No confirmed strength yet
Key zones:
– 25,700–26,400 → Resistance
– 24,800–25,000 → Pivot
– 23,100–23,300 → Immediate support
– 21,700–22,200 → Support zone
Insight
Breakdowns often retest before continuation or transition.
Disclaimer
This analysis is for educational purposes only.
It reflects market structure, not financial advice.
#NIFTY #Nifty50 #MarketStructure #PriceAction #TechnicalAnalysis #TradingView #StockMarketIndia #EWAVESJOURNAL

Mask Network · The Start is Not the End!This is what I am talking about. From the recent low in late March, MASKUSDT is up almost 100%, recovering three months of bearish action already, and it will only go higher. You've seen nothing yet.
The start is never the end.
The recovery process (rounded bottom) and bullish breakout is the start of the bullish market phase. It is not like we get some growth and because there is some growth the market must move down. Better yet, the growth we are seeing shows the world coming back to Crypto, it shows whales and smart money accumulating at the bottom, it shows the bottom is in, it shows the bear market is over and the start of a new market phase.
The small growth we've been experiencing in the past three months is only the start. We have yet to experience the actual bullish wave. This process can take a while to fully unfold.
Remember when the market crashed in October 2025? This wasn't necessarily the end.
Many projects started to drop in May 2025, others in June while still others in August and so on. Then, after the flush, many projects continued to move lower for months. It is the same but in reverse.
We have some bullish action now but it will take months for the full process to fully unfold. Some projects will peak first, that's for certain, but hundreds more will follow. One after the other and many at once until the entire market is affected.
MASKUSDT shows plenty of room left open for additional growth. Some of these targets can yield more than 300% short-term. There can be much more long-term. Buy and hold.
Namaste.
