XAU/USD-15M Sunday, April 26, 2026The Sunday sweep just gave us our entry. Structure confirmed. Levels defined. Time to execute.
MULTI-TIMEFRAME BIAS
H4 — Bullish from macro sweep lows at 4,100 in March. Currently in corrective phase but HTF bias intact.
H1 — Range between 4,660 and 4,880 all week. Price defending the floor.
15M — HH printed, then LH confirmed bearish structure. Sunday sweep at 4,660 followed by CHoCH. Structural shift to bullish confirmed.
TRADE BREAKDOWN
Step 1 — HH to LH structure. Price printed a Higher High early in the week then failed to continue, printing a Lower High. First warning — momentum was shifting.
Step 2 — EOH identified. Equal Highs formed before the Sunday drop. Retail stops clustered above. Smart money used that liquidity before the move down.
Step 3 — Sunday sweep at 4,660. Price spiked aggressively sweeping all sell-side liquidity below that key level. Classic pre-week institutional accumulation. The fuel for the move up is now loaded.
Step 4 — CHoCH confirmed. After the sweep, price printed a Change of Character to the upside on 15M. Bearish structure is broken. Buyers in control.
Step 5 — Pullback to OB 5M at 4,706. Price retracing to institutional demand. This is our entry. Not before, not after.
TRADE PARAMETERS
Entry (BUY) 4,706
Stop Loss 4,673
TP1 4,743
TP2 4,777
TP3 4,811
R/R 1:3
TRADE MANAGEMENT
Entry at 4,706 — OB 5M confluence zone. At TP1 (4,743): Take partials, move SL to breakeven. Let remainder run to TP2 (4,777). Final target TP3 (4,811) — FVG-4H and buy-side liquidity above. Risk 33 pips. Reward 105 pips.
CONFLUENCE
Sunda y sweep at 4,660 — sell-side liquidity taken. CHoCH post-sweep — structural shift confirmed on 15M. EOH liquidity trap identified before the drop. OB 5M at entry zone 4,706. FVG-4H pointing to targets above. Buy-side liquidity at 4,777 and 4,811.
EXECUTION NOTES
Wait for pullback to 4,706 — do not chase. Confirm with bullish 1M or 5M candle before entering. If price moves above 4,725 without retesting 4,706 — stay out. Invalidation: 15M close below 4,673. Pre-FOMC week — keep position size disciplined.
Community ideas

Rectangle Pattern SetupThe price is currently consolidating within a Rectangle Pattern. This sideways movement shows a balance between buyers and sellers, and I am waiting for a definitive Breakout to determine the next trend direction.
Trade Trigger: Breakout of the Rectangle boundary
Risk Management: 0.75% per trade
Risk/Reward (RR): 1:1

EURNZD 27/04/2026Weekly:
-Bearish W pattern.
-50% Retracement of the previous weekly candle.
Daily:
-Bearish W pattern.
4H:
-Bearish W pattern.
-IC.

Australian Dollar Edges Towards BreakoutTaking a look at AUD/USD and several Aussie pairs and market positioning, I outline why dips could remain favourable for bulls and why we could be on the brink of a move towards 75c.
MS

btc crossroadsbtc volatility has been hard
so, let's take a simple look at Elliott wave
we are at a crossroads
we will see a test of the resistance line and even a small break thru
with a 5 wave down in a bigger picture 5th wave macro.
so, we imo a breakdown or break above resistance to retest the trend line.
look for support 1&2 for bear
look for wave 3 to play out for bull
totally neutral on btc

New Week Opening Gap+Previous Day High+Support and RestistanceThese two confluences printed wonderfully; price action is so interesting
the same thing happens over and over and over again
its like a loop thats not consistent
like its inevitable that the market will do the same thing multiple times but you only know when you see it happening again
this exact same trade played out for me last week and here it is again

XAUUSD — Ending Diagonal Completing, Reversal PotentialGold appears to be completing an ABC corrective structure, with wave C developing into a possible ending diagonal. Price action is showing compression and overlapping structure, which is typical behavior in terminal patterns.
We are currently tracking wave 5 of the diagonal, which is now in development. If this structure holds, we could see the completion of the pattern soon, opening the door for a short-term move to the upside.
From a structural perspective, this area is key. A reaction from the lower boundary of the formation would support the scenario of a completed correction.
📍 Expectation: Short-term bullish reaction once wave 5 completes
❗ Invalidation: A clean breakdown below the structure would weaken the setup
As always, we focus on scenarios, not certainties — let the market confirm.

Gold Intraday Trading Plan 4/27/2026As explained in my weekly post, I am bearish in gold at least for the first few days. Therefore, I will look for selling opportunity either from 4760 or if 4650 is broken and upon retest. My daily target is 4550.

CRUDE OIL (WTI)Price is currently sitting within a key demand/consolidation zone around the 94.00 – 95.00 region, which has been acting as a critical decision point. This zone aligns perfectly with our dotted support line and the highlighted grey consolidation block on the chart.
Our projected scenario for the week plays out in two phases:
Phase 1 — Bearish Dip & Sweep:
Before any meaningful upside, we are anticipating price to dip lower toward 92.286 — sweeping liquidity below the current consolidation zone and tapping into the ascending trendline support. This move will shake out weak hands and reload the market for the real move.
Phase 2 — Bullish Reversal & Major Rally:
Once the sweep at 92.286 is complete and price confirms a bullish reaction off the trendline, we are projecting a strong impulsive rally targeting 104.409 — a major resistance level sitting just above the 101.531 key horizontal resistance. Price is expected to retest the 101.531 zone before pushing higher toward the final target.
Key Levels to Watch This Week:
📌 Consolidation Zone: 94.00 – 95.00
🔻 Sweep / Dip Target: 92.286
🚀 Bullish Target 1: 101.531
🎯 Bullish Target 2: 104.409
📈 Bias: Bearish short-term → Strongly Bullish medium-term
Trade Plan:
Watch for a clean liquidity sweep below 94.00 followed by a bullish confirmation candle on the 4H before positioning long. Risk management and exact entry details have been shared separately in the signals section.
Patience is the edge this week. Let price come to your level — do not chase. 📊

GBPJPY LOCAL SHORT|
✅GBPJPY expands into an ICT supply zone after a bullish leg, showing signs of exhaustion and potential liquidity sweep above recent highs. Anticipate bearish reaction with displacement targeting lower imbalance and internal range lows. Time Frame 4H.
SHORT🔥
✅Like and subscribe to never miss a new idea!✅

#TON LONG Back in IVZ support zone🟢 LONG #TON Back in IVZ support zone
Coin has been ranging for 83 days. Looks like a large player is accumulating position. While they accumulate — we can profit from the range.
🟢 Entry zone: 1.2512–1.1746
🔴 Stop: 1.0889
🎯 Targets: 1.4775 / 1.7897
#TON #Altcoins #Crypto #Long #TechnicalAnalysis #CryptoSignals #TradingSignals #CryptoTrading
📌 My profile: Wall Street Levels
🔗 www.tradingview.com

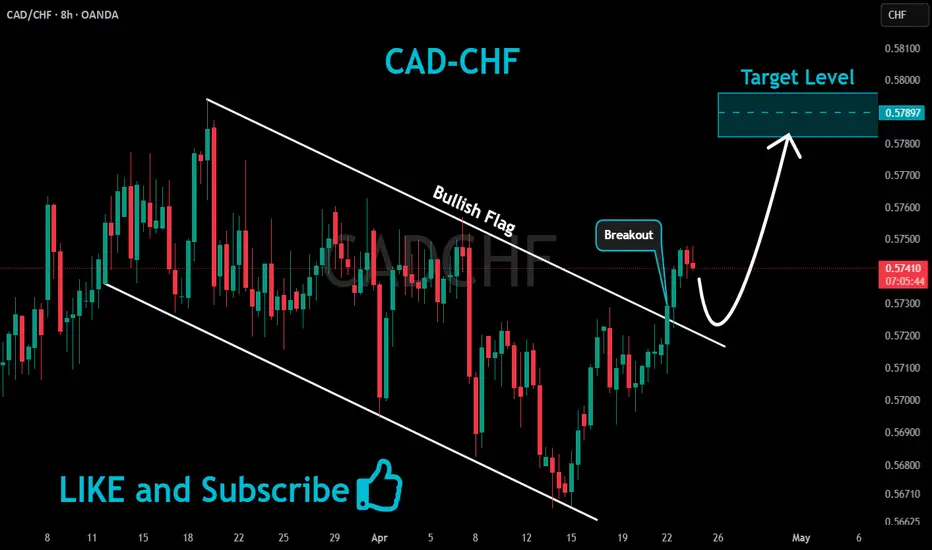
CADCHF Bullish Bias!
HI,Traders !
#CADCHF is trading in an
Uptrend and the pair has
Formed a bullish flag
Pattern so as the pair
Is breaking out we
Are bullish biased
And we will be expecting
A further move up !
Comment and subscribe to help us grow !
Continue buying in the 4690-4710 rangeContinue buying in the 4690-4710 range
Gold at $4700 is key! This week's decisive battle is the Fed meeting (with precise chart)
My weekend recommendation of the "$4685-$4695 bottom-fishing zone" has been perfectly triggered! Gold prices rebounded quickly after hitting a low of $4676 in the morning, and are currently at $4709—those who followed my advice have already gained over 200 points of floating profit, more than $2000 per lot.
If you haven't entered the market yet, don't rush, the real show is just beginning.
This week's focus is on the Fed interest rate meeting and the uncertainty of US-Iran negotiations; market volatility is about to erupt.
Below is the real-time updated :
I. News: Three major events will determine the fate
1. Today's biggest variable: A turning point in US-Iran negotiations?
Iran has just submitted a three-stage negotiation plan to the US through intermediaries. The first stage focuses on "completely ending the war." However, at the same time, Trump ordered the sinking of minelayers in the Strait of Hormuz, and the two sides remain deadlocked.
My interpretation: This "fighting while negotiating" market environment is the most difficult, and gold is waiting for a clear signal. The plunge of gold prices to $4676 during the Asian trading session is the best proof—some were selling, and some were buying.
2. This week's key news: The Federal Reserve interest rate meeting (Wednesday). The market generally bets that interest rates will remain unchanged (around 4.5%). Two key points are worth noting:
Powell's last press conference: Will his wording be hawkish or dovish?
Successor Warsh: What signals will the hearings release?
My prediction: Market expectations for rate cuts have bottomed out; the worst-case scenario may have already been priced in by the market. If Powell softens his stance, gold prices will rebound sharply!
3. Funds: Are institutions quietly increasing their holdings?
The SPDR Gold ETF fell for four consecutive days last week, but it is worth noting that the price decline was not significant. This indicates that during the ETF sell-off, someone absorbed the selling pressure, something that retail investors could not do.
II. Technical Analysis: Trend Reversal Has Occurred! (Real-time Updates)
4-Hour Signals:
RSI: Rebounded from 40 last Friday to around 45, momentum is strengthening.
MACD: A golden cross pattern is forming (fast and slow lines are about to cross).
Candlestick Pattern: Today's candlestick shows a long lower shadow and a bullish candle, basically confirming the "Morning Star" pattern.
New Support Level: 4685-4695. Today's second pullback confirmed this level, upgrading it from "weak support" to "strong support."
Key Price Level: 4720. A break above this level would indicate that the bears have given up.
First Resistance Level: 4740-4745. The 4-hour moving average and last week's high form resistance.
Second Resistance Level (Breakthrough Target): 4765-4780. A break above this level will target 4880.
My Technical Analysis: The price level of 4676 in the early morning was today's "golden position."
The bottoming process is complete, and we are currently in a rebound phase, but a break below 4745 is needed to confirm a reversal.
Monday may see consolidation within the 4690-4740 range.
Wait patiently for market performance after the US market opens.
Main Strategy: Establish long positions in support areas (optimal risk-reward ratio)
Buy 1: 4690-4700 (Buy on a pullback, don't wait for lower prices)
Buy 2: 4680-4685 (Light position, guard against breakout)
Stop Loss: 4675 (A break below 4675 indicates this strategy has failed)
Take Profit 1: 4735
Take Profit 2: 4760 (Bet on a breakout)
Asian Trading Session (End): After a sharp drop to 4676, a V-shaped rebound occurred, validating the effectiveness of the 4685 support level. ✅
European Trading Session: Trading range is 4695-4725. Mainly observe, add to positions near 4695.
US Trading Session: Determine the direction; a break above 4720 indicates a long position; a break below 4690 warrants extreme caution.
Regarding today's market performance, I solemnly declare:
4676 is this week's low!
Those who bought at 5400 but sold at a loss at 4600 will never understand the true meaning of "be greedy when others are fearful."
Meanwhile, my followers successfully bought at the bottom of 4685.
The most timely warning online: The early morning plunge to 4676—most retail investors panicked, but I had already told you that this was a "golden opportunity."
A pragmatic approach, rejecting empty talk: all strategies are precise down to price levels; never resort to tricks like "buy low, sell high."
Like and follow, and I will bring you all the latest developments in the Fed-related markets this week!
See how many people entered at 4685!

Gold(XAUUSD)Testing Key Support Potential Bullish Reversal SetupOn the 1H timeframe, Gold is currently trading within a short-term consolidative structure after a broader corrective move. Price has approached a well-defined horizontal support zone around 4643–4660, which has historically acted as a demand area, showing signs of buyer interest.
The recent price action indicates weakening bearish momentum as the market forms smaller-bodied candles near support, suggesting potential exhaustion of sellers. If this level holds, a bullish reaction is likely, with an initial move toward the 4700 psychological level, followed by continuation toward the 4720–4740 supply zone.
However, this setup remains conditional. A clean breakdown below 4640 would invalidate the bullish bias and expose further downside.

CAD-JPY Risky Short From Supply Level! Sell!
Hello,Traders!
CADJPY taps into a strong supply area after an extended bullish leg, showing signs of exhaustion and potential liquidity grab above highs. Weak continuation suggests bearish pressure building toward lower imbalance zones. Time Frame 4H.
Sell!
Comment and subscribe to help us grow!
Check out other forecasts below too!

ETH TIME TO SHINE!Ethereum is currently trading within a well-defined higher timeframe structure, where price continues to respect a major area of interest / demand-turned-resistance zone that has been repeatedly tested. This prolonged consolidation suggests compression of volatility and accumulation of liquidity on both sides.
Price action is showing clear behavior of range equilibrium, with multiple rejections from the upper boundary and consistent defense of the lower structural support. This type of structure often precedes a strong expansion phase.
From a market structure perspective, ETH remains in a broader decision zone:
Failure to reclaim the upper resistance would keep price vulnerable to a downside liquidity sweep into lower support zones.
A clean breakout and acceptance above the current resistance would signal continuation of the macro uptrend and likely trigger momentum-driven expansion.
Volume profile suggests significant trading activity clustered within the current range, reinforcing the importance of this level as a high-liquidity battleground between buyers and sellers.
Momentum indicators are neutral-to-compressed, reflecting indecision rather than trend continuation — typically a precursor to volatility expansion.
Key Bias: Neutral until breakout confirmation
Bullish trigger: Acceptance above resistance + retest hold
Bearish trigger: Breakdown + retest failure of support
Outlook: Ethereum is coiling. A break-and-retest structure is likely to define the next major directional move.

Gold (XAU/USD): Market Context:
Gold has been cooling off after a recent peak, finding itself back at a critical historical support zone near the 4,670 - 4,680 level. The price action suggests a "Double Bottom" or a "Stop Hunt" might be playing out right at the floor.
🔍 Technical Breakdown
1. The Support Floor .
Price is currently resting in a high-interest Support Zone (highlighted in red). We’ve seen multiple rejections from this level recently, proving that buyers are stepping in to defend this area.
2. Liquidity Targets (The "$" Signs) 💸
Above the current price, we have a series of "Equal Highs." In Smart Money Concepts (SMC), these are considered buy-side liquidity.
Target 1: 4,750
Target 2: 4,765
Target 3: 4,775
3. The Projected Path 📈
The plan anticipates a strong impulse move out of the support zone.
Phase 1: Break above the immediate minor resistance (~4,720).
Phase 2: A brief retest of the "Order Block" (the small blue box) to pick up remaining buy orders.
Phase 3: A moonshot through the liquidity levels toward the 4,800+ psychological level.
🛡️ Trade Setup
Bias: Bullish 🟢
Entry Zone: 4,675 - 4,685 (Current Support)
Take Profit (TP): 4,775 (Liquidity Sweep)
Stop Loss (SL): Below 4,660 (Invalidation of the support zone)
Final Thought:
Gold is at a "make or break" point. If support holds, we are looking at a massive squeeze to the upside as short-sellers get forced out. Watch for a strong 1H or 4H bullish engulfing candle for confirmation!

No caption full actionXauUSD buy. It's been unsure for a while now but it's over now and if you know you know


Descending Trendline Compression Toward Key Support1) Market Structure
Price is forming lower highs under a descending trendline, indicating short-term bearish pressure.
However, the downside is being absorbed at a strong support zone (~4679), creating a compression pattern (triangle-like behavior).
2) Key Zones
Resistance Zone (Supply): 4725 – 4732
Multiple rejections here → strong seller interest.
Mid-Level Resistance: ~4705
Acts as a pivot; price is currently struggling around this area.
Support Zone (Demand): 4678 – 4680
Clearly defended multiple times → high-probability reaction zone.
3) Current Price Context (~4699)
Price is below the mid resistance (4705) and still under the descending trendline → bearish bias until breakout.
But it’s also holding above support, meaning sellers are losing momentum.
4) Scenario Outlook
Bullish Scenario (Preferred if confirmed):
Break above 4705 + trendline
Retest holds → continuation higher
Targets:
4725
4732 (major supply zone)
Bearish Scenario:
Failure to break trendline + rejection near 4705
Breakdown below 4678 support
Could trigger a sharper sell-off (liquidity below support)
5) What the drawing suggests
The projected path shows:
Short-term dip toward support
Then a trendline breakout
Followed by a move toward the upper resistance zone
6) Key Insight
This is a compression setup (lower highs into strong support). These often lead to explosive moves, so the breakout direction is crucial.

RELIANCE - Bullish Engulfing📊 Reliance Industries Ltd – STWP Equity Snapshot
Ticker: NSE: RELIANCE
Sector: Energy / Conglomerate
CMP: 1365 ▲ (+2.86%)
Learning Rating: ⭐⭐⭐⭐☆ (Early Recovery Near Resistance Cluster)
Chart Pattern Observed: Downtrend → Base Formation → Early Recovery Attempt
Candlestick Pattern Observed: Bullish Engulfing + Follow-through Strength
Key Levels – Daily Timeframe
Support Areas: 1327 | 1288 | 1266
Resistance Areas: 1387 | 1410 | 1448
These are zones where price has paused or reacted earlier.
Intraday
Reference: 1371.60
Invalidation: 1309.40
Upside Zones: 1433.80 → 1495.95
Swing
Reference: 1372
Invalidation: 1281
Upside Zones: 1552 → 1687
Pullback Zones
1st Pullback: 1327 → 1290
2nd Pullback: 1288 → 1266
Below 1266: Weakness may resume
STWP View
Momentum: Strong | Trend: Up | Risk: High | Volume: Moderate
🔼 Boost | ✍️ Comment | 🔁 Share with a learner
👉 Follow STWP for clean chart-reading insights
Stay Calm. Stay Clean. Trade With Patience.
⚠️ Disclaimer
This analysis is generated strictly for educational and analytical purposes only.
This does NOT constitute investment advice, trading advice, or a recommendation to buy or sell any security or derivative instrument. Readers are advised to exercise independent judgment and consult a SEBI-registered financial advisor before taking any trading or investment decisions. STWP assumes no responsibility for any financial loss arising from the use of this analysis.
– STWP

U.S Dollar IndexDXY Index
- Bearish Channel as an corrective pattern in Short Time Frame
- Fair Value Gap
- Demand Zone
- Sell Side Liquidity
- Completed " 12345 " Impulsive Waves and " A " Corrective Waves

XAUUSD 1H -- DESCENDING WEDGE BREAKOUT SETUPGold on the 1H timeframe has been forming a clear descending wedge, with price consistently printing lower highs — a classic compression structure signaling weakening bearish momentum.
Price has recently pushed above the wedge resistance trendline, suggesting a potential short-term shift in market structure.
However, the breakout is still in its early stage, and the current price action appears to be moving into a retest phase — a critical area to determine whether buyers can maintain control.
---
🧠 Market Psychology
Throughout the wedge formation:
Sellers were gradually losing strength
Buyers were not fully committing yet
This created a compression environment.
Post-breakout:
Late sellers are likely trapped
Smart money typically waits for the retest
Retail traders often chase the breakout (high risk zone)
If the retest holds, it confirms that buyers are stepping in with intent — increasing the probability of continuation.
---
📈 Trade Plan
Bias: Bullish above structure
Entry Zone: Retest of broken trendline / support
Target: 4770 (liquidity / previous resistance area)
Invalidation: Strong close back inside the wedge
---
⚠️ Risk Consideration
This is not a confirmed breakout yet.
Gold is highly volatile, and false breakouts are common. Proper confirmation should include:
Strong bullish candle close
Follow-through momentum
Clean reaction from retest zone
