XAUUSDHello Traders! 👋
What are your thoughts on Gold?
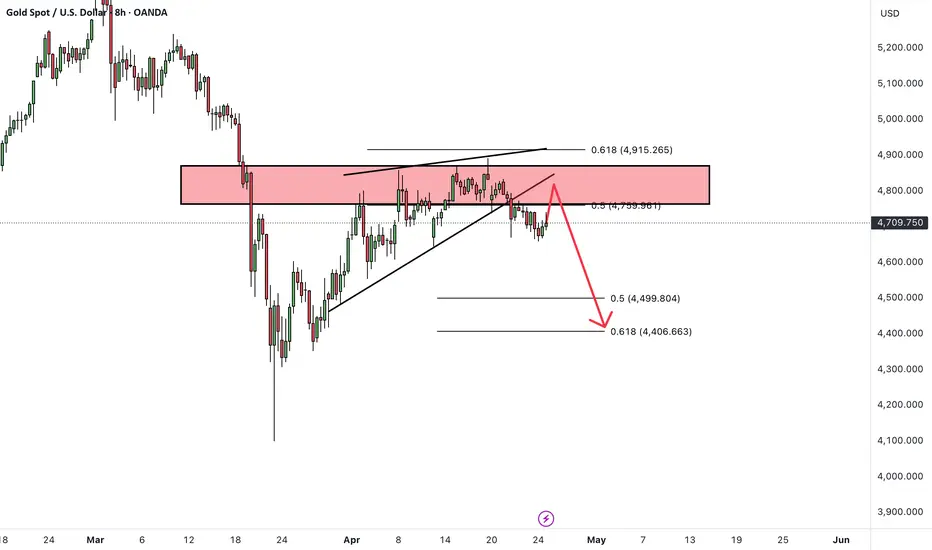
The Gold (XAUUSD)chart is currently flashing significant signs of a trend reversal. After a prolonged period of consolidation within a corrective structure, the price has failed to clear a major resistance zone and is now confirming a bearish breakout.
A decisive break has occurred below the lower boundary of the Rising Wedge pattern.
The red box remains a heavy supply zone. Multiple rejections at this level have formed a Lower High structure, indicating that sellers are now firmly in control of the market.
The path of least resistance is now to the downside. As long as the price remains below the broken ascending trendline and the supply zone, the bearish outlook remains intact.
A strong breakout and acceptance above the supply zone would weaken the bearish outlook.
What is the next move for Gold? Share your thoughts and analysis in the comments! 👇
Please like and support if this analysis helps your trading! ❤️
Community ideas
GOLD - Technical AnalysisICMARKETS:XAUUSD bounced off the 4668 support level toward the end of Friday’s session following a long squeeze, thereby breaking the local bearish structure. The market’s next move depends on geopolitical developments.
The dollar closed Friday in the red, and technically, the index looks poised to continue its decline. Oil is stagnant. Gold, technically, is still under pressure from bears, but Friday’s session closed above Thursday’s close, which gives us positive signals, provided that the fundamental and geopolitical backdrop supports the market. (The previous idea—a break below 4668—remains valid, provided gold returns to that level.) This coming week, all eyes are on the U.S.-Iran negotiations, as well as fundamental data: the Fed’s rate decision, the regulator’s meeting, and GDP and inflation figures.
Resistance levels: 4740, 4795
Support levels: 4668, 4644, 4600
Technically, at the moment, I expect a bounce from 4700 (4688) and a retest of the 4740 liquidity zone. A close above 4740 will open the door for continued growth toward 4800.
However, if the price fails to react at 4700 and retreats to 4668, the likelihood of a further decline will resume.
Best regards, R. Linda!

Uptrend channel hints at 5% move to $82k for BTCHi,
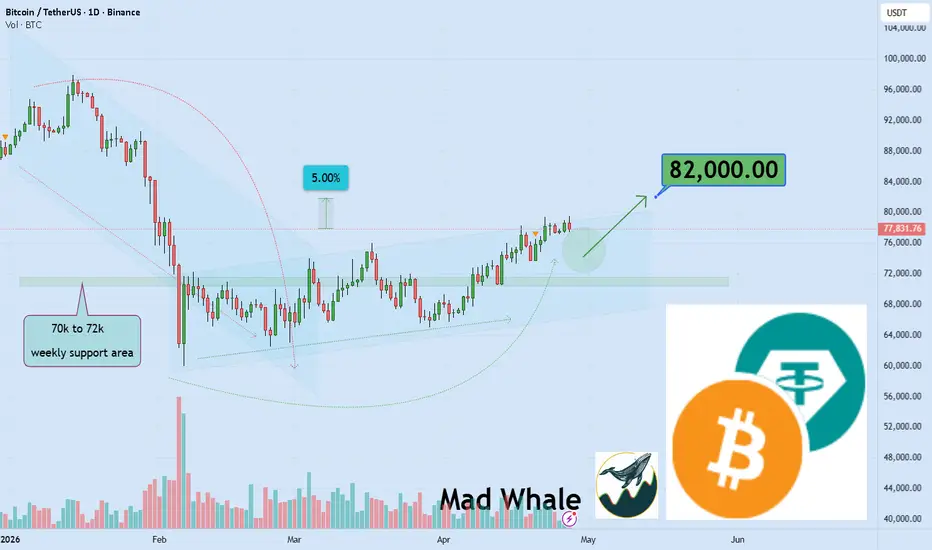
Technically speaking, we’ve got a clean uptrend channel and a seriously strong weekly support holding things together, so I’m eyeing at least a 5% move up with a target around $82,000 📈🚀. Fundamentally though, there’s some weird-but-good stuff bubbling under the surface that makes me feel the market wants to climb higher 🤔✨. And yes, I said feel don’t laugh just yet 😄. It’s that oddly reliable “trader instinct” you get after staring at charts and candles day and night for years 👀. Sounds a bit mystical, sure, but it’s really just experience in disguise so if this target hits, don’t just celebrate, start training that instinct of yours too.
Need a little love!
We pour love into every post your support keeps us inspired! Don’t be shy, we’d love to hear from you on comments. Big thanks
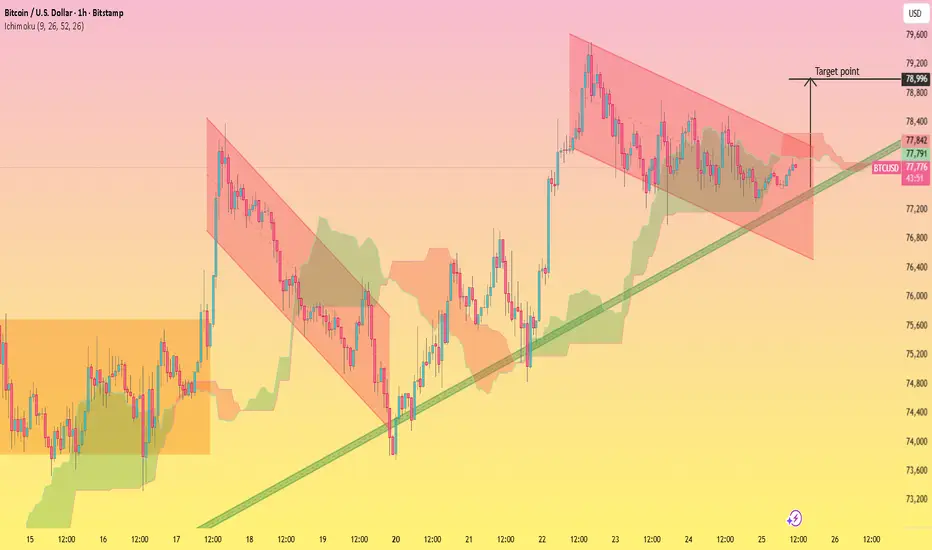
BTCUSD Descending Channel Breakout with Bullish Trendline..This 1H BTCUSD chart shows price previously respecting a **descending channel** (marked in red), indicating short-term bearish pressure. However, the structure shifted after a strong bullish impulse from the lower support area, where price bounced off a **rising trendline** (green).
Currently, price is consolidating inside a range while holding above the ascending trendline and partially supported by the Ichimoku cloud. The descending resistance is still in play, but momentum is slowly favoring buyers as higher lows are being formed.
A breakout above the descending channel resistance would confirm bullish continuation, especially if price sustains above the cloud and trendline confluence.
**🎯 Target:**
* **Primary Target:** 78,900 – 79,000 zone
* This aligns with the projected breakout move and prior resistance area.
**⚠️ Key Levels to Watch:**
* Support: 77,200 – 77,400 (trendline + cloud support)
* Resistance: 78,400 → 79,000 (channel top + target zone)
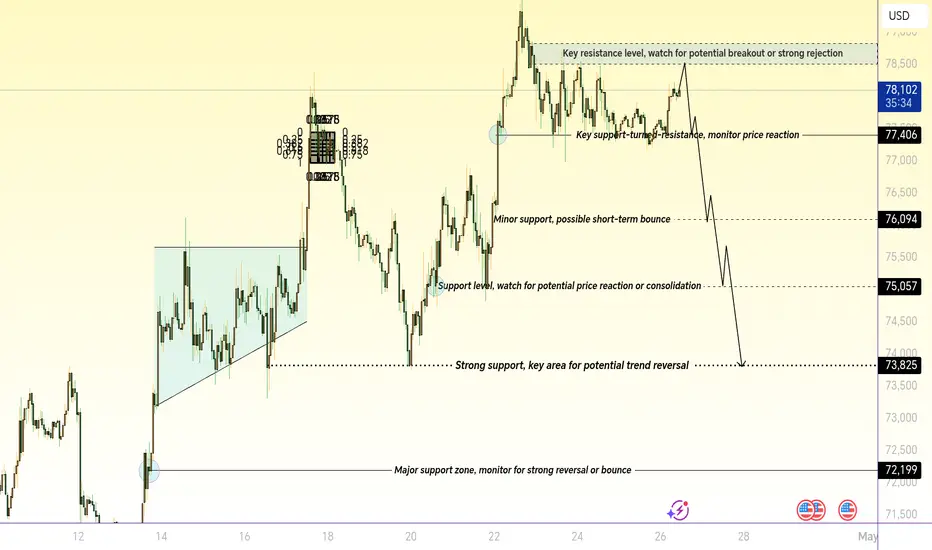
Descending Trendline Compression into Demand — Potential BullishThis chart shows a market that has been in a clear short-term downtrend, defined by a descending trendline connecting lower highs. Price has now compressed into a key horizontal demand zone (~4700 area) while simultaneously interacting with that trendline — this is where things get interesting.
What’s happening:
Downtrend structure: Lower highs and lower lows respected the red descending trendline.
Demand zone: Price repeatedly reacts around the highlighted zone, suggesting buyers are active there.
Confluence: The latest touch combines trendline support + horizontal demand, increasing the probability of a reaction.
Bullish scenario (your drawn path):
A bounce from the demand zone holds.
Price breaks back above the descending trendline.
Reclaims the 4,742–4,754 resistance zone.
If that level flips to support, continuation higher becomes likely.
Bearish risk:
Clean breakdown below the demand zone invalidates the setup.
That would likely lead to continuation of the broader downtrend with new lows.
Key levels:
Support: ~4700 (demand zone)
Resistance: 4,742 → 4,754
Trend trigger: Break and hold above the descending trendline
Read on structure:
Right now this is not yet bullish — it’s a potential reversal zone. Confirmation comes only after:
Trendline break
Higher low formation
Resistance reclaim

Silver Rally with Incoming with Big TargetsXAGUSD is showing a strong potential bullish reversal after forming a clear inverse head and shoulders pattern, signaling a shift in market structure 📊. Price has respected the descending channel and is now attempting a breakout, indicating growing buyer momentum 🚀. The right shoulder formation suggests accumulation, while recent candles show rejection from lower levels, adding confidence to bullish continuation.
If momentum sustains, the first target at 75.62 looks achievable as immediate resistance turns into support 🎯. A clean breakout above this zone could push price toward the second target at 78.58, where stronger resistance may appear. Continued bullish pressure may drive price further to the third target at 80.40, completing the projected move 📈.
Overall, buyers are stepping in with strength, and trend reversal confirmation is building. Proper risk management remains key while following this bullish setup ⚡
If you found this analysis helpful, don’t forget to LIKE 👍 and COMMENT 💬!

Descending Trendline Breakout – Bullish Targets Ahead Price has decisively broken above a strong descending trendline that had been acting as dynamic resistance for an extended period, indicating a clear shift in market structure. This breakout suggests that sellers are losing control while buyers are stepping in with increased momentum.
Before the breakout, price was consolidating near a well-defined demand zone, showing signs of accumulation. The move above the trendline confirms bullish intent, especially as price is now attempting to hold above this level—potentially turning previous resistance into new support.
If this structure holds, the market is likely to continue its upward move toward the next key resistance levels marked as targets at 187.311 and 187.707. These zones represent areas where price may face reactions, but a strong bullish push could lead to continuation beyond them.
Overall, as long as price maintains support above the broken trendline and continues forming higher lows, the bullish outlook remains valid. Any rejection or breakdown below the trendline, however, could signal a false breakout and shift the market back into consolidation or bearish pressure.

BTC/USD Key Levels & Trend OutlookBTC/USD is currently testing a critical resistance zone around 76,666. Traders should monitor for potential breakout or pullback. Strong support lies at 66,812, providing a key area for trend reversal. Upside targets include 91,117 and 104,163, representing major resistance and potential profit-taking zones. This analysis highlights key levels for tactical entries, exits, and risk management in the current market structure
Gold Key Levels & Trend OutlookThis chart highlights key support and resistance levels for Gold, indicating potential areas for price bounce, pullback, or breakout. Key levels: 4659–4683 (strong support), 4701–4733 (minor
resistance / watch zone), 4768–4797 (key resistance / target), 4831–4880 (major resistance / top target). Traders can use this analysis for planning entries, exits, and managing risk.

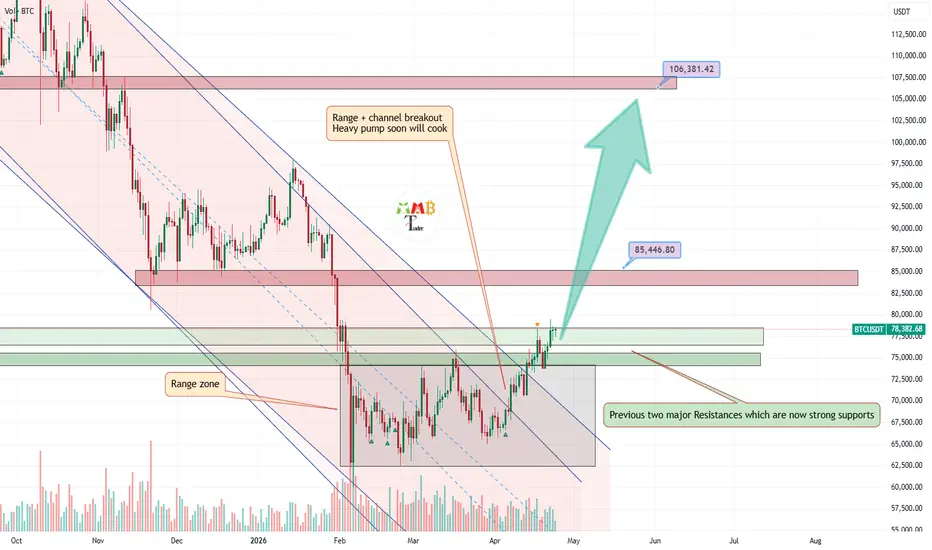
Bitcoin–Descendng Chanel and Trendline Broken, Bull Market aheadBitcoin has achieved a significant technical breakout. Both the daily descending channel and the d escending trendline resistance have now been broken to the upside. This is a major structural shift, as these two confluent resistance levels had been capping price action for an extended period.
Following the breakout, the price has also completed a valid retest of the broken resistances. In technical analysis, a successful retest occurs when the price returns to the broken resistance level (which now acts as support) and holds above it, confirming that the breakout is genuine rather than a false move. Additionally, a period of range-bound consolidation after the breakout further strengthens the new support zone.
Now that the former resistances have been transformed into strong support levels, the path of least resistance is to the upside. The next major psychological and technical target is the 80,000 level. Once Bitcoin is able to break and close above 80K, it is expected to trigger the next phase of the bull market.
This anticipated bull market comes after approximately one year of ranging and dumping, during which Bitcoin consolidated, shook out weak hands, and built a base for the next leg higher.
✍🏼Author's word: Like & comment(your thoughts) if you found it helpful.🩷
XAUUSD BREAKOUT CONFIRMED — GOLD READY TO EXPLODE UP!XAU/USD is showing a clean breakout and retest from the falling trendline while holding firmly above a major demand/support zone. Price reaction from the red key zone suggests buyers are defending this level aggressively, increasing the probability of a bullish continuation. If momentum sustains above current structure, gold could push toward the next resistance zones marked above. A confirmed bounce from support often signals smart money accumulation before expansion higher. OANDA:XAUUSD
🔑 Key Levels:
Major Support Zone: 4653 – 4675
Immediate Resistance: 4810
Psychological Resistance: 4848
Bullish Invalidation: Break below 4650
📌 Trading Insight:
As long as price remains above the support zone, bias stays bullish. Rejection candles and higher lows near demand can trigger the next upward move.
👍 Support This Analysis If you found this idea useful:
👍 Like this analysis
💬 Drop your view in the comments – Bullish or Bearish?
🔔 Follow for more high-probability setups
Your support helps grow and share valuable trading insights 🚀
⚠️ Disclaimer
This content is for educational purposes only

EURUSD Bearish Reversal at Resistance – Shorts FavouredEUR/USD is currently experiencing a bearish trend, confirmed by both technical indicators and fundamental factors chart shows price within a descending channel, forming lower highs and lower lows, indicating sellers are in control.
EURUSD the trend remains bearish, with the EMA50 providing dynamic resistance. The Elliott Wave pattern and price action point to a further drop below 1.1700, confirming the downward momentum. If 1.1700 breaks, the pair could quickly head toward 1.1625, which is a crucial support level. on the fundamental side, the US Dollar remains strong due to ongoing inflationary concerns and hawkish Fed expectations, delaying rate cuts into late 2026. This is keeping US yields elevated, further pushing the dollar up and applying pressure on EUR/USD. Additionally, geopolitical tensions in the Middle East are fueling a risk-off sentiment, where the dollar benefits as a safe haven. On the euro side, Germany's growth forecast has been downgraded, and overall Eurozone growth is slowing, adding further bearish pressure to the EUR.
Moreover, the European Central Bank (ECB) remains uncertain about future rate hikes, which is making investors cautious about the euro, despite rising inflation from energy costs linked to the ongoing conflict in the Middle East. The ECB's indecision about further tightening contrasts with the Fed’s clear stance, creating further divergence between the euro and dollar.
Tecnically the combination of strong US fundamentals, weak Eurozone outlook, and bearish technical signals all suggest that EUR/USD will likely continue to trend lower, targeting 1.1660 and 1.1625. A break below these levels could lead to further downside, with key levels around 1.1600 to watch closely.
You may find more details in the chart,
Trade wisely best of luck buddies.
Ps; Support with like and comments for better analysis Thanks for Supporting.

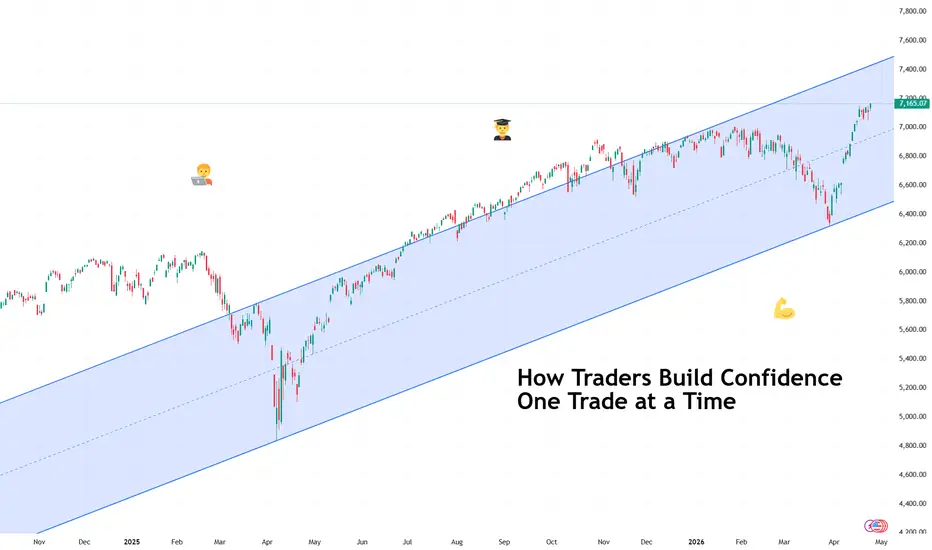
How Traders Build Confidence One Trade at a TimeAnd how you can too.
🧭 Confidence Starts Smaller Than You Think
Confidence in trading rarely arrives as a dramatic breakthrough moment. It usually begins quietly, somewhere between a well-timed entry and a disciplined exit that followed the plan exactly as intended.
Many traders expect confidence to appear after a winning streak. In practice, it grows from consistency rather than excitement. One correctly executed trade builds trust. Two reinforce it. Ten start to feel like structure instead of luck.
Confidence forms when your process begins to feel familiar.
📊 The First Ingredient Is a Repeatable Plan
A repeatable plan means knowing what conditions justify entering a trade and what conditions suggest waiting. Traders sometimes call this a ‘setup,’ which simply describes a recognizable pattern or environment that increases probability.
When traders follow setups consistently, outcomes become easier to interpret. A losing trade feels manageable because it still followed the rules. A winning trade becomes meaningful because it confirms the approach.
Confidence grows faster when decisions feel intentional rather than improvised. (And yes, that includes no revenge trading .)
🧠 Small Wins Train the Mind
Early confidence rarely comes from large profits or the hot trade of the day . It develops through smaller moments that prove discipline works. Waiting patiently for a setup. Respecting position size. Closing a trade according to plan instead of emotion.
These actions build psychological stability. Stability is a big one because markets constantly test patience, timing, and expectations. Sometimes, more than most people can handle.
Over time, repetition turns uncertainty into familiarity, and familiarity makes decisions calmer.
⏳ Reviewing Trades Builds Real Clarity
Professional traders treat review as part of the strategy rather than an afterthought. Looking back at past trades helps identify patterns that charts alone cannot reveal.
A trading journal, which could simply be a record of entries, exits, and reasoning, often becomes one of the most powerful confidence tools available. It transforms memory into evidence. Evidence strengthens conviction.
Confidence feels stronger when supported by observation rather than guesswork.
📉 Losses Still Play a Role
Losses contribute to confidence when they occur inside a structured plan. A controlled loss confirms that risk management is working as intended. Risk management refers to limiting how much capital is exposed on any single idea so that no individual trade can cause lasting damage.
Traders who manage risk effectively begin trusting their ability to stay consistent across changing market conditions (think a wild earnings season or surprise economic data ).
🚀 Confidence Changes How Trades Feel
As confidence grows, hesitation begins to fade. Entries feel clearer. Position sizes feel more appropriate. Decisions arrive with less urgency and more perspective.
Confidence isn’t predicting the market correctly every time — no one can do that, not even your favorite hedge fund bro. It means understanding your approach well enough to execute it without second-guessing each move.
🎁 OK, But How?
Confidence develops through repetition, structure, and reflection rather than dramatic breakthroughs. Each disciplined trade adds another layer of trust between the trader and the process.
Over time, those layers become something powerful: the quiet certainty that you can navigate uncertainty one decision at a time.
Off to you : How do you know you’ve developed enough confidence to be a successful trader? Share your approach in the comments!
GOLD Price Update – Clean & Clear ExplanationGold market is currently in a broader bearish structure, with price respecting a descending trendline and forming consistent lower highs. This confirms that sellers have been in control over the past sessions. However, in the short term, price is showing signs of a potential bullish retracement from a key demand zone.
Recently, price tapped into a strong support area around 4,690 – 4,700, where buyers stepped in and pushed the market upward. This reaction suggests liquidity was taken from the downside, and now the market is attempting to rebalance.
At the moment, price is trading near an internal structure zone, where we can expect some consolidation or minor pullback before the next move. The highlighted setup shows a possible buy opportunity, but only after a clean reaction or confirmation from this zone.
If buyers maintain control, the next target is the major resistance zone around 4,780 – 4,785, which aligns with the higher timeframe supply and descending trendline. A break above this resistance would signal a potential shift in structure and continuation toward higher levels.
On the downside, if price fails to hold the current zone and breaks below 4,690, it would invalidate the bullish idea and likely lead to a continuation of the bearish trend, targeting lower liquidity levels.
Ps; Support with like and comments for better analysis Thanks for Supporting.

GBP/USD: The Big Squeeze! Bullish Breakout Incoming?Cable is showing some serious high-voltage action on the 4-hour chart. We are currently witnessing a massive battle at the Strong Resistance Line, and the bulls look like they are winning the war of attrition.
The Current Tape 📽️
After a period of heavy volatility, the price has settled into a very tight Triangle Pattern right under the major diagonal ceiling. In trading, when a pair consolidates at the very top of a range rather than rejecting it, it usually suggests that big players are absorbing the selling pressure to prepare for a breakout.
Why I’m Watching 1.3550 🔍
The Accumulation: Notice the sequence of higher lows within the triangle. Every dip is being bought faster than the last one.
The Resistance: We have touched this macro line multiple times. The more a level is tested, the weaker it becomes.
The Projected Path: I’m expecting a brief liquidity hunt—maybe a quick wick lower to grab some stops—followed by a sharp impulsive move above the resistance.
The Roadmap 🎯
Trigger Zone: A clean 4H candle close above 1.3550 is the green light.
Primary Target: 1.3650 (The next major structural peak).
The Safety Net: As long as we hold above 1.3480, the bullish thesis remains the dominant play.
Summary 💡
Don't get chopped up in the sideways movement. The real money will be made on the breakout confirmation. If the bulls can flip this "Strong Resistance" into a new floor, we could see a very fast run toward the 1.3700 handle.
What’s your take? Are you waiting for the 1.3550 break or are you already positioned? Drop your thoughts below! 👇

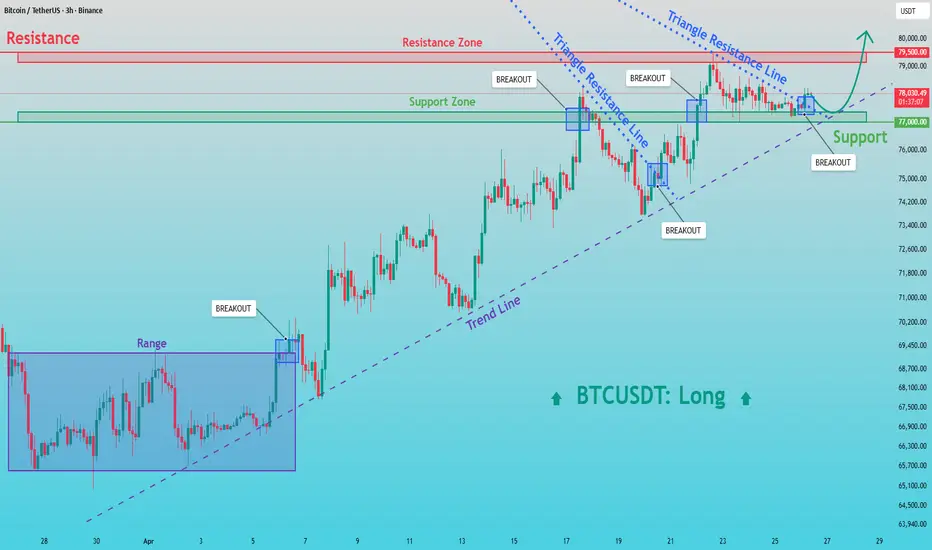
BTCUSDT: Respects Trendline - 79.5K Breakout in FocusHello everyone, here is my breakdown of the current BTCUSDT setup.
Market Analysis
Bitcoin previously traded inside a range. After the breakout, price continued higher and formed an ascending trend with consistent higher lows along the trendline. Later, the market entered a triangle structure, where multiple breakouts and retests confirmed strong buyer control.
Currently, BTCUSDT is consolidating below the 79,500 resistance zone. A recent pullback and reaction from support indicate that buyers are still active, while resistance remains the main barrier.
My Scenario & Strategy
As long as BTCUSDT holds above the 77,000 support and respects the ascending trendline, the bullish scenario remains valid. A bounce from this zone could push price toward the 79,500 resistance (TP1).
However, if price breaks below 77,000 and loses the trend structure, a deeper correction may follow.
That’s the setup I’m tracking. Thank you for your attention, and always manage your risk.
XRP Price Accumulation Signals Potential ReversalXRP is currently consolidating at a major support zone, sitting at the higher timeframe range low. This area is acting as a critical foundation for price, and the ongoing consolidation here could be an early sign of accumulation.
Key Highlights:
- Price holding high timeframe range low support 🔺
- Consolidation suggests potential accumulation phase 📊
- Strong reaction zone increases odds of a structural reversal 🚀
From a technical perspective, this region is a high-probability reversal zone. The range low on the higher timeframe has historically acted as a strong support level, where demand tends to step in. The current consolidation at this level indicates that sellers may be losing momentum, while buyers are gradually absorbing supply.
This type of price action often precedes a shift in market structure. If XRP continues to build a base here and begins to form higher lows on lower timeframes, it would signal growing strength and increase the probability of a reversal.
A confirmed bounce from this support zone could open the path for a rally toward higher resistance levels. However, holding this level remains crucial. As long as price maintains support and continues consolidating, the bullish case for a structural reversal remains valid.

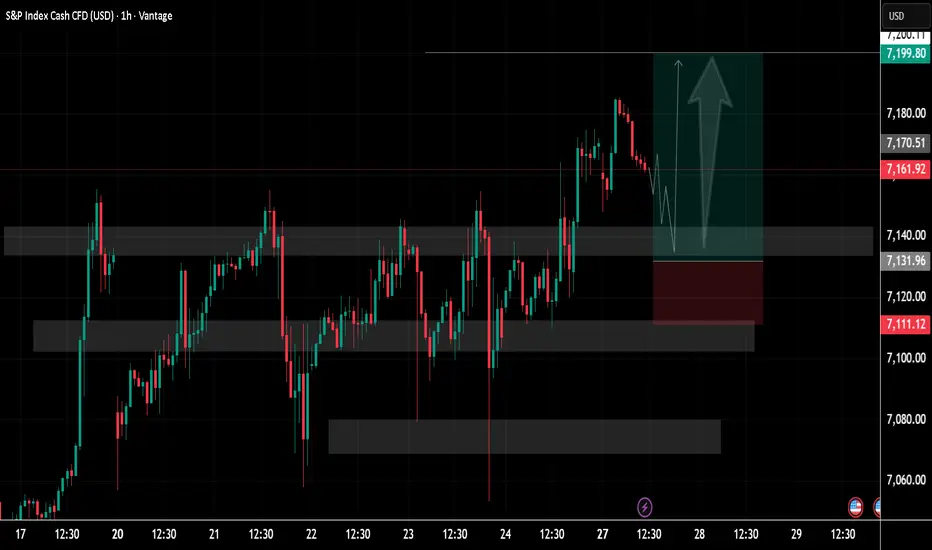
SP500 Price Update – Clean & Clear ExplanationS&P 500 in a structured bullish setup forming after a period of consolidation.
Price action has been ranging between multiple clearly marked zones, with repeated reactions from both demand and supply areas. Earlier sessions show choppy movement, but the market gradually builds higher lows and higher highs, signalling a shift toward bullish control.
A strong impulsive move upward breaks above the mid-range resistance, followed by a modest pullback. The highlighted grey zones represent key support and resistance levels, with the current price hovering just above a previously tested resistance—now acting as potential.
The projected path shows a temporary dip (liquidity grab or retest) before a continuation upward, aligning with a classic break-and-retest bullish structure.
Ps; Support with like and comments for better analysis Thanks for Supporting.
Gold: The Trap is Sprung! Target $4,540 as Rejection ConfirmedThe Macro Context 🛰️
Gold remains under immense pressure as the macro landscape favors the Greenback. With the US Dollar Index (DXY) hitting fresh 2026 highs and Fed Chair nominee Kevin Warsh maintaining a hawkish tone regarding persistent energy-driven inflation, the "opportunity cost" of holding non-yielding Gold is rising. While geopolitical tensions remain, the market is currently treating the Iran-Israel stalemate as a long-term economic drag rather than an imminent kinetic explosion, prompting a rotation out of bullion and into USD cash.
The Setup: Nested Wedges & Structural Exhaustion 🧩
The 1-hour chart reveals a high-precision bearish roadmap:
The Macro Structure: Gold is trapped within a massive Descending Broadening Wedge. This pattern indicates that while volatility is expanding, the bears are successfully defending every major relief rally.
The Rejection: Notice the "Sell area" near $4,730. This level acted as a brick wall over the weekend, flushing out buyers who were hoping for a breakout above the macro resistance.
The "Retest": Price is currently in a local "Retest" phase (around $4,700 – $4,710). This is the underside of the local wedge support that was broken earlier. In technical terms, old support has been successfully flipped into new resistance.
The Roadmap: Destination $4,540 🎯
Following the purple projection, the path of least resistance points to a deep liquidity hunt:
Immediate Resistance: The $4,725 – $4,735 zone (Sell area) must hold to keep the bearish thesis intact.
The Forecast: We expect the current "Retest" to fail, leading to an impulsive leg lower as stop-losses below $4,680 are triggered.
Primary Target: $4,540 (The macro Support line).
Invalidation: A clean 4H close above $4,760 would negate this setup and suggest a neutral consolidation phase.
Bottom Line 💡

WTI Crude Oil Price Analysis – Key Support and Resistance LevelsThis chart provides a professional overview of WTI Crude Oil (US Dollar) price action, highlighting critical support and resistance levels. Key resistance at 108.80 USD suggests potential price rejection, while support
at 93.22 USD offers a strong foundation for possible bullish reversals. The trend line indicates overall bullish momentum, guiding price movement upwards, and traders should monitor for possible price action near these levels.
With target resistance at 113.53 USD, the market may continue to push higher, but price action at these critical zones will dictate the next move. Keep an eye on the support zone at 83.03 USD and 80.00 USD for potential reversals.

ETH/USDT: Symmetrical Triangle Breakout in Progress!Hi!!!
Ethereum has finally squeezed out of its consolidation phase on the 15M chart. After days of tightening price action, the Symmetrical Triangle has resolved to the upside, signaling a return of bullish momentum.
The Technical Setup:
The Breakout: Price has decisively cleared the upper resistance of the triangle. This move marks the end of the "indecision" phase and the start of a fresh expansion.
Market Structure: We are seeing a clean push away from the apex. The immediate price action suggests buyers are aggressively stepping in to front-run the next leg up.
Resistance Flip: The previous supply zone around $2,335 is now acting as an immediate floor for this move.
Targets in Sight:
🎯 Target 1: $2,351 (The primary measured move of the triangle).
🎯 Target 2: $2,360

EUR/CAD: Strong Bearish Pressure📉EURCAD is currently experiencing significant bearish pressure this morning.
A bearish breakout of the support line of a flag pattern, observed within a clear intraday downtrend on an hourly timeframe, provides strong confirmation of this movement.
I anticipate that the price will soon reach the 1.5967 level.

XAU/USD | Gold at a Key Decision Level – Waiting for Direction!By analyzing the #Gold chart on the 4H timeframe, we can see that price opened the week with a bearish gap down to around $4672, but buyers quickly stepped in and pushed it back up toward $4739. However, this move lacked continuation and price is now trading around the $4692 region, sitting right at a critical support area.
From a structural perspective, the $4680 – $4700 zone is currently acting as a key demand area. As long as price manages to hold and stabilize above this level, we can expect another bullish attempt toward the nearest supply zones at $4725 – $4750, followed by $4780 – $4820 as the next major resistance cluster. In this case, short-term upside targets would be $4725, $4750, and then $4780.
On the other hand, if price fails to hold above this demand zone and we see a clean breakdown, the market could enter another bearish leg toward lower liquidity levels. In that scenario, the next downside targets would be $4665, followed by $4640, and potentially $4600 as selling pressure builds.
Overall, this is a key reaction zone where the next directional move will likely be determined. Keep in mind that the market remains highly sensitive to geopolitical developments, and any shift in tensions between Iran and the US could quickly change the direction of Gold.
Please support me with your likes and comments to motivate me to share more analysis with you and share your opinion about the possible trend of this chart with me !
Best Regards , Arman Shaban
