Down for goldHi traders,
Last week gold retested the bullish Daily FVG again but on Tuesday it closed below the Daily bearish FVG and started to drop.
So next week we could see another move down to finish the (red) ABC-pattern.
Let's see what price does and react.
Trade idea: Wait for a change in orderflow to bearish on a lower timeframe to trade shorts.
This shared post is only my point of view on what could be the next move in this pair based on my technical analysis.
But I react and trade on what I see in the chart, not what I've predicted or expect.
Manage your emotions, trade your edge!
Eduwave
Community ideas

Liquidity Sweep Into Support – Potential Bullish Reversal SetupThis setup is leaning toward a short-term bearish continuation into a support reaction, not an immediate clean buy.
What’s happening:
Market formed a lower high structure after the earlier push up.
Then a strong bearish impulse (displacement) came in — that red drop you circled.
That move likely grabbed liquidity below minor lows and created imbalance.
Price is now approaching a key support zone.
Key zones:
Support: ~4675–4670 (your marked zone)
Stop-loss zone: below ~4663 (liquidity under support)
Target (if bounce holds): ~4705–4710
Scenario 1: Preferred (More Probable)
Liquidity sweep → bounce
Price taps into support
Forms a double bottom / W pattern
Then pushes up toward imbalance fill
👉 This aligns with your drawn path.
Scenario 2: Bearish continuation
If support breaks cleanly with strong candles
No rejection / no structure shift
Then price likely continues lower → 4650s
Entry logic (important refinement):
Don’t blindly buy at support.
Wait for:
Rejection wicks
Break of minor structure (higher low + BOS)
Volume/impulse confirmation
Verdict:
Bias: Short-term bearish → potential bullish reaction at support
Best trade: Confirmation-based buy from support
Invalidation: Clean breakdown below 4663

HOOD: Massive Bull-Flag-Breakout, Next Expansion Ahead!Hello There,
welcome to my new analysis about the Robinhood (HOOD) stock on the weekly timeframe perspective. The stock already, in the past, emerged with massive bullish upthrusts, always leading to higher highs. Since it surged past the 100 level and formed new all-time highs, the bullishness has just heavily accelerated.
When looking at my chart, we can watch there how the stock has formed several bull flags within this huge uptrend acceleration dynamic. The stock already formed three bull flags, which were always origins of massive bullish expansions towards the upside. Right now the next bull-flag formation is forming, which is likely to lead to a similar bull-flag breakout.
Also, the support structure is looking really solid. The stock has strong support within the horizontal support area, which was previously resistance. Also, it has a major support within the 100-MA marked in green in my chart. This strong support confluence area is preparing the next bullish wave. Once a golden MA crossover happens as marked in my chart, this will fuel additional confirmation.
The next times will be highly important. Currently, the signs for the next expansion are really strong. With the next acceleration of bullishness, the stock is likely to expand upward and approach the upper levels of this massive formation.
Thank you a lot for watching!
What do you think about the stock?
Let us know in the comments!
VP

AUDUSD Reacting to Daily Resistance | Bearish Setup (4H)Price is currently reacting to a key daily resistance zone after multiple structure shifts (BoS).
Analysis:
- Market showing lower highs after rejection from higher levels
- Price tapped into a strong supply/resistance zone
- Weak bullish momentum → potential continuation to the downside
Bias: Bearish
Trade Idea:
- Entry: Around current resistance zone (~0.7140 – 0.7160)
- Stop Loss: Above daily resistance
- Targets:
TP1: Daily Support (~0.7110)
TP2: Lower demand zone (~0.7080)
TP3: Extended move towards 0.7040
Patience is key — waiting for confirmation before entry.
Not financial advice. Always manage your risk.
What do you think — will this level hold or break? 👀

BTCUSD Liquidity Sweep Bounce – Counter-Trend Move Toward 77.7KKey Zones
Support (Demand): 76,100 – 76,600
Resistance / Target: 77,700 – 78,000 (prior consolidation + imbalance)
Invalidation (SL): Below 76,100
💡 Trade Idea (Your Setup)
Entry: ~76,600 zone after support tap
Stop Loss: ~76,100
Target: ~77,700
🔍 Price Behavior Insight
Sharp sell-off → likely liquidity grab + exhaustion
Small base forming at support suggests:
Absorption of selling pressure
Potential short-term reversal / pullback
BUT:
Overall structure still bearish
This is a counter-trend bounce, not a confirmed trend shift
⚠️ What to Watch
If price:
Holds above 76.1K → bounce toward 77.5K–78K likely
Breaks below 76.1K → continuation toward 75K zone
Watch for rejection around 77.7K (sell zone)
🧩 Verdict
✔️ Clean support-based bounce setup
✔️ Good RR (~1:2+)
⚠️ Lower probability than trend trades (counter-trend)

XAUUSD Scalp Short / Sell Setupentered from 4707 must use SL. It's a scalp so book some on 1:1 and rest till tp, don't hold for long. Best Of Luck

XAUUSD 4H Elliott Wave Bearish Wedge Breakdown OutlookThe XAUUSD 4H chart shows a completed impulsive structure followed by a corrective phase forming a contracting wedge (A–B–C–D–E). After the strong decline into wave (5), price began a corrective rally labeled (A), then pulled back to (B), and pushed again to (C). The structure now appears to be developing waves (D) and (E) within a narrowing channel, indicating weakening bullish momentum. This pattern typically signals exhaustion before a continuation move in the dominant trend, which in this case remains bearish.
Wave (E) is expected to test the upper trendline resistance, likely around the 4700–4720 zone. If rejection occurs, it confirms the completion of the corrective structure and opens the path for a strong impulsive drop. The projected move suggests a breakdown below recent lows near 4660, with potential extension toward the 4580 area or lower.
Volume and momentum indicators would likely show divergence during wave (E), reinforcing the bearish outlook. Traders should be cautious of false breakouts near resistance and wait for confirmation signals before entering positions.
Entry & Exit Points:
Sell Entry: 4700–4720 (near wave E completion)
Stop Loss: Above 4740
Take Profit 1: 4660
Take Profit 2: 4580

Bullish Breakout in #WALCHANNAGBullish cross in MACD new 52week high, falling wedge breakout with volume , looks sound and strong

bitcoin btcusdtTHE CURRENT BTC PRICE IS 78,200.
Bitcoin lacks buy momentum in this season, sell bias still very much strong.
the structure of the market on weekly and daily have upside potential but limited by monthly chart ,technically sellers are holding and looking for another sell opportunity to sell,pls dont be a victim.
what is bitcoin??
Bitcoin is the world's first decentralized digital currency, often called "digital gold," that enables peer-to-peer transactions without banks or governments. Created in 2008 by the pseudonymous Satoshi Nakamoto, it operates on a public blockchain ledger.
Core Concept
Bitcoin (BTC) functions as a form of money stored and transferred digitally via cryptography. Unlike traditional currencies, no central authority controls it—transactions are verified by a global network of computers (nodes) using proof-of-work consensus. New bitcoins are "mined" through this process, with a fixed supply cap of 21 million coins
How It Works
Every transaction records on the blockchain—a tamper-proof chain of blocks containing details like sender, receiver, amount, and timestamp. Miners compete to solve complex puzzles to validate blocks, earning bitcoin rewards while securing the network against fraud. Wallets store private keys for access, but bitcoin itself lives on the blockchain.
History and Adoption
Launched in 2009, Bitcoin gained traction as an alternative to fiat money post-2008 financial crisis. El Salvador briefly made it legal tender from 2021-2025. Today, it's the largest cryptocurrency by market cap, used for payments, investments, and as a hedge against inflation.
#bitcoin #btc
Goodluck

Descending Wedge Breakout Price has been consolidating within a descending wedge pattern for an extended period, forming lower highs while holding above a rising support trend line. After a prolonged compression, price has broken out to the upside, signaling a potential trend reversal.
Key Levels:
Current Price: 0.63926
Resistance: 0.92888 — first major hurdle to watch
Target: 1.20663 — upon successful breakout and resistance flip
The breakout from the wedge structure suggests bullish momentum is building. If price sustains above the breakout zone and clears the 0.92888 resistance, the next target is 1.20663, representing a significant upside move.

EURUSD H1 | Bearish Reversal Off Key ResistanceMomentum: Bearish
Price is currently below the ichimoku cloud.
Sell entry: 1.17679
- Swing high resistance
- 78.6% Fib retracement
- 78.6% Fib projection
Stop Loss: 1.17912
- Swing high resistance
Take Profit: 1.17402
- Overlap support
High Risk Investment Warning
Stratos Markets Limited (fxcm.com/uk), Stratos Europe Ltd (fxcm.com/eu):
CFDs are complex instruments and come with a high risk of losing money rapidly due to leverage. 69% of retail investor accounts lose money when trading CFDs with this provider. You should consider whether you understand how CFDs work and whether you can afford to take the high risk of losing your money.
Stratos Global LLC (fxcm.com/en): Losses can exceed deposits.
Please be advised that the information presented on TradingView is provided to FXCM (‘Company’, ‘we’) by a third-party provider (‘TFA Global Pte Ltd’). Please be reminded that you are solely responsible for the trading decisions on your account. Any information and/or content is intended entirely for research, educational and informational purposes only and does not constitute investment or consultation advice or investment strategy. The information is not tailored to the investment needs of any specific person and therefore does not involve a consideration of any of the investment objectives, financial situation or needs of any viewer that may receive it. Past performance is not a reliable indicator of future results. Actual results may differ materially from those anticipated in forward-looking or past performance statements. We assume no liability as to the accuracy or completeness of any of the information and/or content provided herein and the Company cannot be held responsible for any omission, mistake nor for any loss or damage including without limitation to any loss of profit which may arise from reliance on any information supplied by TFA Global Pte Ltd.
Stratos Trading Pty. Limited (fxcm.com/au):
Trading FX/CFDs carries significant risks. FXCM AU (AFSL 309763), please read the Financial Services Guide, Product Disclosure Statement, Target Market Determination and Terms of Business at fxcm.com/au

NAS100 Trade Set Up Apr 27 2026Price is in a overall uptrend making HL/HH on all time frames so i would like to see a sweep of SSL followed by 1m-5m IFVG/CISD to trade higher to Asia high BSL

XAUUSD Bullish Continuation: Consolidation Holding Above SupportXAUUSD (Gold) Intraday Analysis – Bullish Setup from Consolidation
Price is currently reacting off a well-defined support zone (~4702) after forming a tight consolidation range. This structure suggests accumulation before a potential breakout.
Key Observations:
Market Structure: After the sharp bullish move from the demand zone, price transitioned into consolidation rather than reversing — a sign of strength.
Support Holding: The 4700–4702 area is acting as a strong base. Multiple rejections indicate buyers are defending this level.
Compression Phase: The range is tightening, which often precedes expansion (likely bullish given prior momentum).
Trade Idea (Bullish Bias):
Entry Zone: Around 4702–4705 (post minor pullback or confirmation)
Stop Loss: 4689.9 (below structure support)
Targets:
TP1: 4713
TP2: 4720
TP3: 4724
Final Target: 4730 (near supply reaction)
Why Bullish?
Higher low formation after breakout
Consolidation above support (not below it)
Momentum leg remains intact unless support breaks
Risk Factor:
If price breaks and closes below 4690, the setup invalidates and could lead to a move back toward the demand zone.
Conclusion:
This looks like a continuation setup, not a reversal. Watch for a clean breakout from consolidation or a liquidity sweep into support before the next push up.

EURUSD Facing Selling Pressure - Downside To Trend Line in FocusHello traders! Here is my technical forecast based on the current EURUSD (2H) chart structure. The EURUSD pair was previously moving down, showing bearish pressure. After forming a bottom, the price reversed and broke the key range, entering a bullish phase. Following this, EURUSD reclaimed the 1.1650 buyer zone, confirming it as a strong support level, and continued moving within an ascending structure with higher lows. Currently, price has shown a rejection of the 1.1760 resistance level (seller zone) and is facing pressure from the descending resistance line. The recent rejection confirms the weakness and increases the likelihood of a downward move. As long as EURUSD remains below 1.1760, the bearish scenario stays valid. A breakdown of the local support and ascending trendline could push price toward the 1.1650 buyer zone (TP1). Please share this idea with your friends and click Boost 🚀

ETH/USD 4H Market Analysis📊 ETH/USD 4H Market Analysis – Bullish Structure with Pullback Opportunity 🚀
🧠 Market Overview
Ethereum is maintaining a clear bullish market structure, printing higher highs and higher lows after a strong impulsive move. Price is currently in a controlled retracement phase, not a reversal.
🔍 Key Technical Insights
📈 Bullish Momentum
Strong upward impulse confirms buyers are in control
Structure remains intact above previous higher low
📦 Demand Zone (Support)
Highlighted zone around 2,240 – 2,280 acting as a key institutional demand area
Price is reacting near this zone → potential accumulation
🔝 Resistance / Liquidity
Major high around 2,480
This level is likely holding liquidity (target for bullish continuation)
🎯 Trading Scenario
🟢 Bullish Setup (Preferred)
Expect a dip into demand zone → liquidity sweep
Followed by strong bullish reaction
Target: 2,480 (previous high / liquidity zone)
🔻 Bearish Risk
If price breaks and closes below demand zone
Structure weakens → possible deeper retracement
⚖️ Conclusion
Market is bullish overall, current move looks like a healthy pullback into demand.
As long as price holds the zone, probability favors a continuation to the upside.

Trade Plan: RDDTTrade Plan: RDDT
• Direction: Long
• Entry: 154.90
• Stop Loss:134.50
• TP1: 206.80
• TP2: 265.00
• TP3: 385.00
Take partial profits at each target, then trail stop to protect profits.
Analysis based on market structure, volume profile and harmonic pattern.
Not financial advice.

Gold Likely Topped in the Short-termThe daily chart for XAU/USD indicates a shift from a recovery attempt to a potential bearish continuation.
1. Resistance Confluence
The area between $4,870 and $4,900 has established itself as a ceiling. The price experienced multiple rejections at this level, which is reinforced by the 50-day SMA ($4,870). This failure to reclaim the moving average confirms that sellers are in control of the medium-term trend.
2. Support Failures
The technical outlook is supported by two key breaks:
Short-term Support: The horizontal level at $4,772 was breached, signaling an end to the recent consolidation.
Dynamic Support: The price has fallen below the 100-day SMA ($4,741), which typically acts as a indicator of trend health. Trading below this level suggests the path of least resistance is now downward.
3. Downside Objectives
With the breakdown confirmed, the following levels are the primary targets for the current move:
Immediate Support: $4,668.
Downside Targets: A deeper correction toward the $4,602,$4,553, then $4,400
Bottom Line : The chart is starting to look more bearish. Unless price can reverse to reclaim the 100-day SMA ($4,741), the momentum favors a continued slide toward the $4,550–$4,600 range.

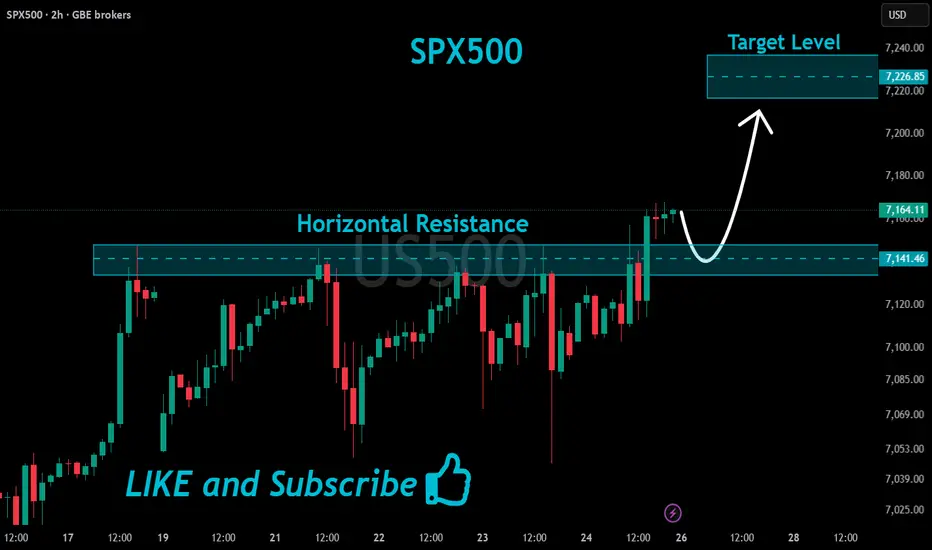
SPX500 Will Keep Growing!
HI,Traders !
#US500 is trading in an
Uptrend and the price
Made a bullish breakout
Of the key horizontal
Level of 7141.46 and the
Breakout is confirmed so
We are bullish biased
And we will be expecting
A further bullish continuation !
Comment and subscribe to help us grow !

CAD/JPY: Strong Buy Levels from Volume Profile(115.71 & 116.40)CAD/JPY offers two strong long opportunities at 115.71 and 116.40, both based on Volume Profile. The lower level comes from a sharp rejection of lower prices, showing where buyers stepped in aggressively. The higher level is built on heavy volume accumulation within an uptrend, signaling position building by buyers. Wait for a pullback into these zones—buyers are likely to defend them and push price higher.


NZDJPY The Target Is DOWN! SELL!
My dear friends,
Please, find my technical outlook for NZDJPY below:
The price is coiling around a solid key level - 94.156
Bias - Bearish
Technical Indicators: Pivot Points High anticipates a potential price reversal.
Super trend shows a clear sell, giving a perfect indicators' convergence.
Goal - 93.892
About Used Indicators:
The pivot point itself is simply the average of the high, low and closing prices from the previous trading day.
Disclosure: I am part of Trade Nation's Influencer program and receive a monthly fee for using their TradingView charts in my analysis.
———————————
WISH YOU ALL LUCK

GBP/USD Range-Bound Consolidation and Resistance TestThe pair is currently navigating a period of relative stability after a sharp rally earlier in the month. Key technical and fundamental details include:
Current Action: The price is trading at 1.35594, attempting to push back into a blue Supply Zone between 1.3600 and 1.3650.
Price Structure: After a significant vertical rally (marked by the large blue box on the left), the market has entered a broad consolidation phase. The price is currently reacting to the "upper-middle" portion of this range.
Key Levels: To maintain the bullish momentum, the Pound needs a clean daily close above 1.3600. Failure to break the overhead resistance could lead to a retest of the recent support floor near 1.3400.
The Outlook: The market is in a "wait-and-see" mode ahead of a critical week for central banks. Expect increased volatility surrounding the BoE press conference on April 30 as policymakers weigh the inflationary impact of the ongoing conflict against potential economic slowdown
