Long Consolidation Breakout.TICL Analysis
Closed at 893.24 (27-04-2026)
Long Consolidation Breakout.
Also, Cup & Handle formation can be seen on bigger tf.
Retested its breakout level around 600 - 650.
Still has potential to touch 1050 - 1100
However, it should not break 580 now.
Community ideas

GBPUSD is new setup📊 GBPUSD TRADE SETUP 💷🚀
GBPUSD is maintaining a strong bullish trend on the 1H timeframe 📈 with buyers pushing price toward the key resistance zone. A breakout could open the door for further upside momentum.
🔴 Resistance Area: 1.37100
🔹 Entry: Buy on breakout confirmation / retest of resistance
🎯 Technical Targets:
🥇 1st Target: 1.37200
🥈 2nd Target: 1.37400
🥉 3rd Target: 1.37600
🏆 4th Target: 1.37800
💡 Trend remains bullish — watch for a clean breakout above resistance for continuation.
⚠️ Always use proper risk management & wait for confirmation before entering.
👍 Like | 💬 Follow | 🔁 Comment | 📢 Share for more setups

DOTUSDTDOT/USDT – 4H Range Support Hold | Intraday Buy Setup
DOT/USDT on the 4H timeframe is currently trading within a well-defined range structure, with price reacting multiple times from a strong horizontal support zone around 1.23–1.24.
After a recent pullback, price has once again tapped into this support and is showing signs of stabilization, suggesting a potential short-term bullish move from this demand area.
Confluence Factors:
Strong horizontal support tested multiple times
Range-bound market structure (accumulation phase)

#ETHUSDT Buy Trade Setup.Here’s an up-to-date #ETHUSDT Buy trade outlook (technical + fundamental) to help you assess whether positioning for a Downside makes sense right now. Thank You....

BULLISH MOVEAfter a breakout of the trend and supply zone. Buyers continue the momentum to higher highs

# Adani Total Gas“ATGL has formed a base and is now compressing below a key supply level (650), with declining volume indicating a potential expansion move. Decision lies at the breakout or failure levels.”

WTI Oil Ready to Drop? Major Rejection Zone at 100–102Oil (WTI) is currently trading inside a corrective bullish structure after a strong impulsive move from the 86.99 support zone. Price has formed a rising trendline and is now approaching a key confluence resistance between 98.70-100.70 which aligns with a descending higher timeframe trendline. The market is showing signs of exhaustion near this resistance with slowing momentum and potential liquidity sweep above recent highs before a reversal. The projected path suggests a short-term push into the 100-102 zone (liquidity grab) followed by a strong bearish rejection targeting lower imbalance zones. Overall bias is bearish below 102-104 unless a strong breakout and hold occurs as the higher timeframe structure still favors continuation to the downside toward deeper liquidity levels.
Trade Plan – Sell Setup
Sell Zone: 100 – 102
Targets: 95.00, 91.20, 81.00
Invalidation: H1 close above 104.50
Trade Plan – Buy Setup
Buy Zone: 91 – 92 (strong support + demand zone + liquidity area)
Trigger: Strong bullish rejection
Targets: 98.50, 101.00
Invalidation: Break and close below 90.00
Note
Please risk management in trading is a Key so use your money accordingly. If you like the idea then please like and boost. Thank you and Good Luck!

Buy level euraud Currently trading in a down parallel channel
And more sell expecting
Buy when it comes to our demand level

USDJPY*SHORTS*30tfsell sell sell lol
OB mitigated on the 2 hr chart
seeking sells to the downside
THATS ALL FOLKS
GL TRADERS
GHOSTFX OUT

EUR/CHF — Short at Resistance, Same Pattern That Delivered Last EURCHF
Context:
EUR/CHF has been in a grinding range between 0.9160 and 0.9280 for over three weeks. The chart shows a familiar pattern repeating. Back on April 12th, a Sell signal fired at the 0.9250 zone and delivered a full drop to 0.9160. Now, after a slow recovery from the lows, price has pushed back up to 0.9210 and a fresh Sell signal has fired.
Why this setup works — three confluences:
Signal history — same setup delivered before — the previous Sell signal on this chart fired near the top of the range and played out cleanly to the downside. When the same signal fires at the same structural zone in the same range, and it already worked once — that's pattern repetition you can trade with confidence
Lower high forming — the first Sell fired at 0.9250. This second Sell is firing at 0.9210 — a lower level. That means sellers are getting more aggressive and stepping in earlier. Lower highs in a range are the precursor to a breakdown
Range ceiling rejection — price pushed into the upper half of the range and immediately got rejected. The candles approaching resistance are small and corrective. The rejection candle is impulsive. That's the signature of a distribution zone — weak buying into strong selling
A Sell signal fired at 0.92108. We took it.
Trade management:
Entry: 0.92108
Stop Loss: 0.92350 — above the resistance zone
TP1: 0.91800 — mid-range support, 50% off, stop to breakeven
TP2: 0.91500 — range low for 100% exit
R:R: ~1:1.3 to TP1, ~1:2.5 to TP2. Strong asymmetry — tight stop, deep targets.
Invalidation: Close above 0.92350 — the range resistance breaks and the bearish structure is over.
The lesson:
Forex ranges are where patience gets paid. EUR/CHF isn't going to give you a 40% move — but it gives you structure, predictability, and clean risk-to-reward. When you see the same signal fire at the same zone and it already worked once, the trade almost writes itself. The edge in forex isn't in finding exotic setups — it's in recognizing when the market is doing the same thing twice.
Signal fired. We took it. Update coming.

GBP/USD Sell Trade Setup.Here’s an up-to-date #GBP/USD Sell trade outlook (technical + fundamental) to help you assess whether positioning for a Downside makes sense right now. Thank You...

Crude Oil Support at 81.90: Volume Profile Buyers Step InCrude Oil is approaching a key support at 81.90, built from a strong rejection of lower prices.
Heavy buying volume entered this zone, showing where institutions stepped in and reversed the move. This makes it a high-probability reaction area on a pullback. Watch for a bounce, but stay cautious around Iran-related news that could spike volatility.

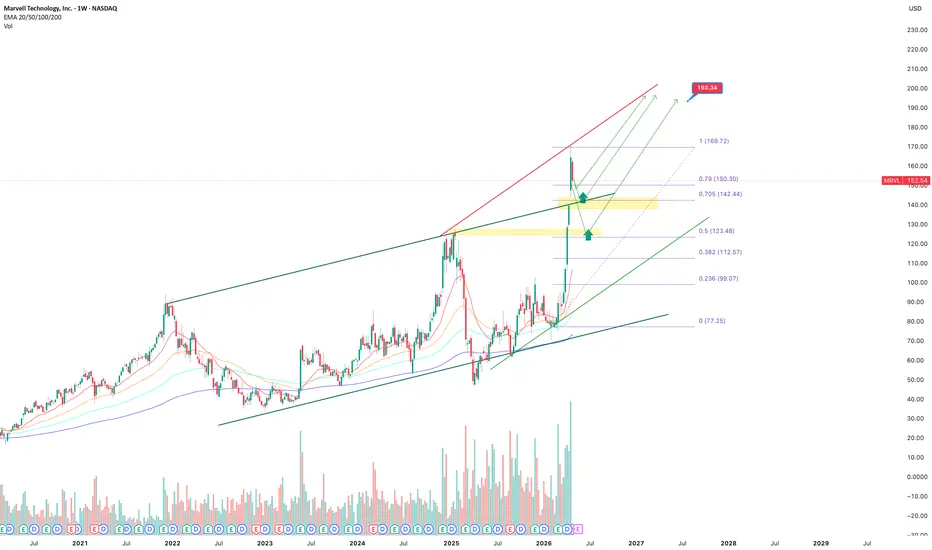
Marvell Technology maintains upside potential after correctionThe stock is forming a bullish structure following a strong upward impulse and a current pullback into a demand zone. Price is holding key levels and remains above long term trend support, indicating continued buyer control.
The trading plan is to consider long positions in the 145-140 zone with additional accumulation near 125. Upside targets are located around 170 and 190.
From a technical perspective, the asset is forming a higher low after the impulse, confirming trend continuation. Price remains above moving averages, while the current pullback appears to be a healthy correction before the next upward move.
Fundamentally, the company benefits from strong demand in artificial intelligence and data center solutions. Increasing investments in AI infrastructure and cloud technologies continue to support revenue growth expectations. This creates a favorable environment for further upside.
As long as the current structure holds, the bullish scenario remains the priority.
GER30 SHORTSell side shift on the monthly TF, strong W1 FVG, D1 Shift to the downside now looking to sell toward the weekly support level. It's a good swing setup..

AUDUSD uptrend breakout targeting 0.7220 resistanceThe AUDUSD remains in a bullish trend, with recent price action showing signs of a corrective pullback within the broader uptrend.
Support Zone: 0.7110 – a key level from previous consolidation. Price is currently testing or approaching this level.
A bullish rebound from 0.7110 would confirm ongoing upside momentum, with potential targets at:
0.7220 – initial resistance
0.7260 – psychological and structural level
0.7300 – extended resistance on the longer-term chart
Bearish Scenario:
A confirmed break and daily close below 0.7110 would weaken the bullish outlook and suggest deeper downside risk toward:
0.7080 – minor support
0.7030 – stronger support and potential demand zone
Outlook:
Bullish bias remains intact while the AUDUSD holds above 0.7110. A sustained break below this level could shift momentum to the downside in the short term.
This communication is for informational purposes only and should not be viewed as any form of recommendation as to a particular course of action or as investment advice. It is not intended as an offer or solicitation for the purchase or sale of any financial instrument or as an official confirmation of any transaction. Opinions, estimates and assumptions expressed herein are made as of the date of this communication and are subject to change without notice. This communication has been prepared based upon information, including market prices, data and other information, believed to be reliable; however, Trade Nation does not warrant its completeness or accuracy. All market prices and market data contained in or attached to this communication are indicative and subject to change without notice.

ATRL 1D | Break Above 1000 Can Trigger Next Rally LegATRL is in a strong uptrend and has recently broken key resistance near 950. Holding above 900–920 keeps the bullish structure intact, while a breakout above 1000 can push the price toward 1040–1100.
Bullish Scenario
If price holds above 920 and sustains breakout:
Targets:
1000
1040
1100
📈 Momentum continuation → trend followers entering
🔴 Bearish Scenario
If price loses 900 support:
Targets:
850
800
📉 Healthy correction inside uptrend
🟢 Smart Entry Plan
Option 1: Pullback Buy
930 – 900 zone
SL below 880
Option 2: Breakout Entry
Above 1000 confirmation

AUDUSD: Bearish Continuation is Highly Probable! Here is Why:
The charts are full of distraction, disturbance and are a graveyard of fear and greed which shall not cloud our judgement on the current state of affairs in the AUDUSD pair price action which suggests a high likelihood of a coming move down.
Disclosure: I am part of Trade Nation's Influencer program and receive a monthly fee for using their TradingView charts in my analysis.
❤️ Please, support our work with like & comment! ❤️

XAUUSD - H4 - Elliott Wave Analysis📌 Last week we said the X wave was complete.
The invalidation was 4,890.967. Price never touched it. Gold is now at 4,709.
Here is something most traders miss:
👉🏻 A wave count is not a prediction. It is a map. Every map has a point where you know you took the wrong road. That point is called invalidation.
Without it, you are just guessing.
This is how we read the market every day. Clear counts, clear invalidation, clear bias.

MU - Micron Technology, Inc.Micron Technology, Inc. engages in the provision of innovative memory and storage solutions. It operates through the following segments: Compute and Networking Business Unit (CNBU), Mobile Business Unit (MBU), Embedded Business Unit (EBU), and Storage Business Unit (SBU). The CNBU segment includes memory products and solutions sold into client, cloud server, enterprise, graphics, and networking markets. The MBU segment is involved in memory and storage products sold into smartphone and other mobile-device markets. The EBU segment focuses on memory and storage products sold into automotive, industrial, and consumer Markets. The SBU segment consists of SSDs and component-level solutions sold into enterprise and cloud, client, and consumer storage markets. The company was founded by Ward D. Parkinson, Joseph Leon Parkinson, Dennis Wilson, and Doug Pitman on October 5, 1978 and is headquartered in Boise, ID.

PLTR Breakout Setup: Traders Eye $150 If Momentum Holds:Current Price: 143.09
Direction: LONG
Confidence level: 62%(Professional trader commentary points to a consolidation with higher lows and potential breakout. Social sentiment leans slightly bullish with more positive than negative signals, but mixed signals and nearby resistance reduce confidence.)
Targets
Target 1: 148.00
Target 2: 152.00
Stop Levels
Stop 1: 136.00
Stop 2: 124.00
Wisdom of Professional Traders:
This analysis synthesizes insights from thousands of professional traders and market experts, combining what traders are saying across platforms to spot actionable opportunities. When multiple traders independently highlight similar technical structures and catalysts, it often points to areas where market participants are focusing their capital and attention in Palantir Technologies Inc.
Key Insights:
Here’s what’s driving this setup right now. Palantir is sitting just above short‑term moving averages while consolidating after a pullback inside a broader tech rotation. Several professional traders mentioned a pattern of higher lows forming while the stock presses against overhead resistance. That type of structure often precedes a breakout attempt if buyers keep defending dips.
Another factor I’m watching is the social momentum building around government contracts and AI demand. Multiple traders pointed out that new federal contracts — including the USDA and IRS deals — strengthen Palantir’s revenue pipeline. When those headlines appear during a consolidation phase, they often act as the spark that pushes price through resistance.
Finally, sentiment across trading discussions leans slightly bullish. Many traders highlighted potential upside into the mid‑$140s and $150 region if momentum returns ahead of earnings. The real story here is that buyers continue stepping in on dips instead of letting the stock break down.
Recent Performance:
You can see this tug‑of‑war clearly in the chart. PLTR has been moving sideways around the $140 area after a decline from earlier highs. Despite the broader software pullback earlier in April, the stock is holding above its short‑term averages and repeatedly bouncing before reaching deeper support. That kind of price behavior usually signals accumulation rather than distribution.
Expert Analysis:
Traders are paying close attention to the structure forming between roughly $136 and the low $140s. Several professional traders highlighted this as the key zone where buyers have consistently stepped in. As long as that area holds, the probability of a push toward the next resistance band increases.
At the same time, multiple traders pointed out that resistance around $143–$145 is the immediate hurdle. A clean break above that area could open the door toward the $148–$152 range this week. That’s why I’m leaning LONG here — the chart shows compression beneath resistance while sentiment improves.
News Impact:
Recent news flow is quietly supportive. Government contracts tied to agriculture and financial crime monitoring add credibility to Palantir’s long‑term AI narrative. At the same time, analysts are looking ahead to the upcoming early‑May earnings report, which could drive positioning this week. Traders often build positions ahead of these events if momentum starts improving.
Trading Recommendation:
Putting it all together, I’m taking a LONG stance on PLTR while it holds above the $136 support zone. My base case is a push into the $148 area first, with $152 as the stretch target if buyers break through the $145 resistance cluster. Risk management matters here — if the stock loses $136, momentum likely fades and the deeper $124 support becomes the next magnet. With improving sentiment, strong contract news, and a compression pattern forming on the chart, the risk‑reward currently favors a bullish position into this week.

Intel rally looks exhausted near $85 resistance — short-term puCurrent Price: 82.54
Direction: SHORT
Confidence level: 58%(Professional traders highlight strong bullish momentum but also repeatedly note overbought indicators and resistance near $85. With price closer to resistance than support, a short-term pullback setup is more likely this week.)
Targets
Target 1: 79.72
Target 2: 76.87
Stop Levels
Stop 1: 85.32
Stop 2: 88.70
Wisdom of Professional Traders:
This analysis synthesizes insights from thousands of professional traders and market experts, combining what traders are saying across professional analysis and social sentiment. When many experienced traders independently highlight the same technical levels and catalysts, it often gives a clearer picture of where the market may move next. In Intel’s case, trader consensus highlights strong momentum but also clear signs of short‑term exhaustion.
Key Insights:
Here's what's driving this setup. Intel just experienced one of the most aggressive rallies in the semiconductor sector. Several professional traders described a massive gap‑and‑go breakout after earnings, with the stock jumping roughly 23–24% in a single session and pushing toward record territory. That kind of move usually attracts momentum traders quickly.
But the real story is the technical stretch. Multiple traders pointed out that Intel is trading above nearly every major moving average — 9‑day, 20‑day, 50‑day, 100‑day, and 200‑day. At the same time, momentum indicators such as RSI were reported around 82, which is firmly in overbought territory. Historically, moves like that often pause or retrace before continuing higher.
Another interesting point is where price currently sits relative to key levels. Several traders repeatedly highlighted $85.32 as near‑term resistance and $88.70 as the next major ceiling. On the downside, the same trader consensus identified $79.72 and $76.87 as the closest support zones. When I look at the chart with those levels, price is sitting much closer to resistance than support — which tilts the short‑term probability toward a pullback.
Recent Performance:
Intel has been one of the strongest semiconductor movers recently. The stock closed around $82.57 after a roughly 23.6% surge triggered by strong earnings and AI‑related optimism. Some reports cited gains exceeding 100% since earlier market lows, and even larger multi‑month runs tied to the broader AI trade. That explosive upside move is impressive, but rallies of that size often trigger profit‑taking during the following week.
Expert Analysis:
Traders across several analyses described Intel’s move as a breakout from a long accumulation range with heavy volume and strong sector leadership. Semiconductor stocks overall have been leading the market higher, and Intel helped push the entire chip sector upward.
That said, multiple traders also highlighted risk factors. A few pointed to valuation concerns and institutional profit‑taking following the earnings surge. Others noted that the semiconductor index itself is trading dramatically above its long‑term trend — in some cases nearly 48% above its 200‑day average — which historically increases the odds of short‑term corrections.
So the trader consensus isn't questioning the broader bullish story around AI demand and data‑center growth. Instead, the concern is timing: after a vertical rally, the market often needs a cooldown before continuing higher.
News Impact:
The main catalyst behind the move was Intel’s strong earnings surprise and improved AI outlook. Reports highlighted a massive EPS beat and stronger margins, which reignited confidence in the company’s turnaround narrative. AI infrastructure demand and government support for domestic semiconductor production also continue to fuel investor optimism.
However, markets often follow a “buy the rumor, sell the news” pattern after big earnings spikes. Institutional traders frequently lock in profits after large single‑day gains, which can create short‑term retracements even when the longer‑term outlook remains positive.
Trading Recommendation:
Putting it all together, I’m leaning SHORT for this week’s trade. The price is pressing into a clearly defined resistance zone near $85 while technical indicators show overbought momentum. That combination often leads to a retracement toward the nearest support levels.
My approach would be watching for weakness below the $83 area while targeting $79.72 as the first downside level. If selling pressure accelerates, the next support sits around $76.87. Risk management matters here — a clean breakout above $85.32 invalidates the short‑term pullback idea, and $88.70 would be the hard stop.
This is essentially a momentum cooldown trade rather than a long‑term bearish call on Intel.

ScalpMaster’s MarkVANTAGE:NAS100 Price reacted clean from discount PD array (27,280–27,300) where OG FlowMaster showed buyer activity and sell-side liquidity was taken.
We now have bullish displacement + higher low, supported by +BB signal, indicating continuation.
CAPITALCOM:US100 I’m expecting price to push toward 27,420, aligning with premium PD array and stacked OG supply zones above.
Target: 27,420
Invalidation: Below 27,266
Model: sell-side liquidity → discount reaction → expansion into premium
Disclaimer: This is not financial advice. Always manage your own risk.

USDCAD: Major Trendline Break & Support LossKey Technical Details
Trend Reversal : The chart features a steep black trendline that tracked a long-term rally. The price has clearly broken below this line, signaling that the previous bullish momentum has ended. 📉
💹 Support Breakdown: There are two horizontal white lines marking key price zones. The price has just sliced through the upper support level (around 1.3650). 🔓
💹 Price Target: A large white arrow points downward from the broken support toward the lower support level (near 1.3550), suggesting a bearish target for the current move. 🎯
💹 Current Price: The red horizontal dashed line shows the current price at 1.36150, confirming the breakout is active. 📍
Analyzing the Move
💹To understand what might happen next, we should look at the "how" and "why" of this price action. Where would you like to start our exploration?
💹Market Structure: We can look at the "Lower Highs" forming at the top of the chart and what they tell us about the shift from buyers to sellers. 🏗️
💹Support & Resistance: We can discuss why that 1.3650 level was so important and what happens to a "floor" once the price falls through it. 🧱
💹Risk/Reward: We can explore how a trader might use the target at 1.3550 to plan a potential trade. ⚖️
