NVDA arrows pointing to $214+ TodayNVDA arrows pointing to $214+ Today
*This is Not Financial Advice
Community ideas

NZDUSD - Channel Resistance RejectionHello Trading Fam! 👋
Price is in a rising channel and approaching a strong resistance zone.
👉 Idea:
Look for shorts near resistance
Expect a rejection → move back to channel low
📉 Bias: Short at top of channel + resistance confluence
Don’t forget to like and share your thoughts in the comments! ❤️

50% Fib resistance ahead?US Dollar (DXY) is rising towards the pivot, which is a pullback resistance that aligns with the 50% Fibonacci retracement and could reverse towards the 1st support, which is an overlap support.
Pivot: 99.14
1st Support: 98.00
1st Resistance: 100.51
Disclaimer:
The opinions given above constitute general market commentary and do not constitute the opinion or advice of IC Markets or any form of personal or investment advice.
Any opinions, news, research, analyses, prices, other information, or links to third-party sites contained on this website are provided on an "as-is" basis, are intended to be informative only, and are not advice, a recommendation, research, a record of our trading prices, an offer of, or solicitation for, a transaction in any financial instrument and thus should not be treated as such. The information provided does not involve any specific investment objectives, financial situation, or needs of any specific person who may receive it. Please be aware that past performance is not a reliable indicator of future performance and/or results. Past performance or forward-looking scenarios based upon the reasonable beliefs of the third-party provider are not a guarantee of future performance. Actual results may differ materially from those anticipated in forward-looking or past performance statements. IC Markets makes no representation or warranty and assumes no liability as to the accuracy or completeness of the information provided, nor any loss arising from any investment based on a recommendation, forecast, or any information supplied by any third party.

Weekly Bias — 27 AprilThis week offers a perfect volatility cocktail
Mag7 earnings + FOMC + PCE + energy shock (Mid-East) = stacked event risk
This is exactly when IV lifts into the event → then compresses post-event
Market has been oscillating between positive gamma (pinning) & risk of gamma flip → trend acceleration
Early week = mean-reverting, trapped price action
Post-event = expansion (likely directional)
NASDAQ:QQQ (leader – risk-on proxy)
Clean V-shaped recovery → impulsive leg
Broke prior range → now trading above value (premium)
Near your marked 100% Fib extension (~$664–$680)
Price is extended away from 20/50/200-day MAs
Current highs = buy-side liquidity
Expect sweep above $664–$670 → rejection = bull trap, or continuation only if acceptance above $670
RSI ~75 = overbought
MACD expanding but flattening slope → hidden bearish divergence forming
(price ↑ momentum flattening)
Rally came on declining participation (thinning volume) → late-cycle markup, not fresh accumulation
AMEX:SPY (broader market confirmation)
Broke range → now retesting highs (~$714)
Slightly weaker than NASDAQ:QQQ → negative breadth divergence
SPY is lagging NASDAQ:QQQ
Equal highs = obvious stop pool
Push above $714 → fail → reversal
AMEX:IWM (risk appetite gauge)
Still below prior highs relative to NASDAQ:QQQ / AMEX:SPY
Lagging badly → risk-off under the surface
This isn’t broad participation → rally is mega-cap driven (fragile)
Current trend is late-stage expansion
Momentum stretched
Volume declining
Breadth diverging (IWM lag)
Price at premium HTF levels
Skew (25Δ)
NASDAQ:QQQ put IV > call IV (put-call IV ratio ~1)
Market still paying for downside protection
Not euphoria → hedged rally
IV vs RV
NASDAQ:QQQ IV ~19% & RV ~23%
IV < RV
Options are underpricing movement, but event risk will temporarily inflate IV early week
Gamma + OI positioning
1. Call wall (resistance)
NASDAQ:QQQ ~$670–$680
AMEX:SPY ~$715
2. Put wall (support)
NASDAQ:QQQ ~$610–$615
AMEX:SPY ~$680
NASDAQ:QQQ $610 puts (very active) → strong downside hedge anchor
NASDAQ:QQQ
Resistance $664 → $680 (liquidity sweep zone)
Support $615 → $610 (gamma support)
AMEX:SPY
Resistance $714–$720
Support $680–$676
AMEX:IWM
Resistance $280
Support $258 → $255
Most likely early week
Grind/slow push higher
Sweep highs (trap breakout longs)
Rejection into event
Post FOMC/earnings
If yields drop → tech squeezes → NASDAQ:QQQ breaks $670 → runs $690+
If yields spike (energy-driven inflation) → violent downside unwind
Rising oil → higher inflation expectations → yields up
Market is ignoring inflation risk
Fragile positioning
1σ expected move using typical weekly IV + IWM reference (~±3–4% monthly)
NASDAQ:QQQ ~±18–22 pts
Range $645 – $685
AMEX:SPY ~±15 pts
Range $695 – $725
LIQUIDITY TRAPS BEFORE REAL DIRECTION

Inx to 0.0133Ezekiel 37:3 — "And he said unto me, Son of man, can these bones live?"
INX to 0.0133. I answered as I always answer: the Chart knoweth

Gold is showing a bearish trend and resistance breakdown📉 XAUUSD (Gold) – Sell Setup | 1H Timeframe
Gold is showing a bearish trend with a potential breakdown from the 4692 zone. Watching for continuation to the downside.
🎯 Targets:
• 1st Target: 4680
• 2nd Target: 4671
• 3rd Target: 4658
⚠️ Trade Plan:
Look for confirmation before entry — avoid chasing the market.
🛡️ Risk Management:
Always use proper lot sizing and stop loss. Protect your capital.
💬 Like • Follow • Comment • Share

EUR/USD Technical Outlook: Breakout, Retest & Bullish RunEUR/USD "THE FIBER" 🔥 | Bullish Breakout Play | Day & Swing Trade Setup | Thief Style 🥷💰🗡️ ASSET:
💶💵 EUR/USD — "THE FIBER" — The most traded Forex pair on the planet, accounting for nearly 28% of daily global FX volume
📊 TRADE PLAN — BULLISH:
✅ Bullish plan confirmed with a clean resistance breakout above 1.17400
🚀 The Fiber cracked through a major resistance ceiling — bulls took control of the battlefield
🧠 Breakout validated on momentum, price action above key moving averages, and shifting macro tailwinds against the USD
🎯 ENTRY ZONE:
⚡ Entry is flexible — you may enter at any price level that fits YOUR risk appetite and chart confirmation
🎯 Aggressive traders: enter on retest of breakout zone near 1.17400
🐢 Conservative traders: wait for a pullback and confirmation candle before pulling the trigger
📐 Always size your position responsibly — the market doesn't care about your feelings, only your plan
💰 TARGET — THE ESCAPE PLAN:
🏁 Primary Target: 1.19000
⚠️ Why 1.19000 is the danger zone — multiple forces converging at this level:
🚔 Police Force Resistance — strong historical supply zone patrolling this area, ready to arrest the move
📈 Overbought conditions likely to develop as price approaches this ceiling
🪤 Bull trap territory — smart money may flip the table on retail longs at this exact zone
🔄 Potential trend change signals emerging near this resistance cluster
🥷 Thief Rule #1: Take money and RUN before they take it back from you
🙏 Dear Ladies & Gentlemen (Thief OG's) — the TP at 1.19000 is a guide, NOT a command. Use your own risk management. You can scale out, trail your stop, or exit earlier — it's YOUR trade, YOUR money, YOUR call ✊
🛑 STOP LOSS — THE THIEF'S ESCAPE HATCH:
🔴 Thief SL: 1.16600
📌 Place your stop loss AFTER breakout confirmation — not before. Never chase a stop blindly
⚠️ A close below 1.16600 would invalidate the bullish structure and signal the bulls lost the war
🙏 Dear Ladies & Gentlemen (Thief OG's) — the SL at 1.16600 is a reference point only. Your stop placement is entirely YOUR decision based on your broker, your spread, and your risk tolerance. Take care of your own capital first 💼
🔗 RELATED PAIRS TO WATCH — USD PAIRS:
📌 OANDA:GBPUSD "THE CABLE" ~1.3490 — Strong positive correlation with EUR/USD (~+0.95). Both the Eurozone and UK economies are closely linked through trade, meaning GBP/USD and EUR/USD often move similarly against the USD. If The Fiber pumps, Cable usually pumps too. Watch for GBP/USD breakout above 1.3500 as a bullish confirmation signal 🇬🇧
📌 OANDA:AUDUSD "THE AUSSIE" ~0.6390 — Moderate positive correlation with EUR/USD. AUD/USD shows bullish continuation signals alongside EUR/USD in the current macro environment, both benefiting from broad dollar weakness. Watch 0.6400 as the key upside trigger 🦘
📌 OANDA:USDCHF "THE SWISSIE" ~0.8820 — Strong negative correlation with EUR/USD (~-0.95). EUR/USD and USD/CHF have a strong negative correlation because the Swiss Franc historically moves similarly to the Euro, and when both are paired against the USD, they move in opposite directions. If Fiber rises, Swissie falls — use it as a cross-confirmation tool 🇨🇭
📌 FX:USDJPY "THE NINJA" ~158.00 — Indirect inverse relationship with EUR/USD via DXY pressure. A weaker dollar that lifts EUR/USD typically weighs on USD/JPY bulls. Watch Ninja closely for risk-off signals 🗡️
📌 OANDA:EURJPY "THE YUPPY" ~184.50 — Positive correlation with EUR/USD. If both EUR strength and JPY weakness align, this cross can outperform — bonus trade opportunity for OG's 🔥
📰 REAL-TIME FUNDAMENTAL & ECONOMIC FACTORS (What The Market Is Actually Saying Right Now):
🏦 CENTRAL BANK WATCH:
🇺🇸 Federal Reserve (FOMC): Expectations for the Fed point toward a pause in rate changes, with a probability close to 99.5% that rates will remain at 3.75%. FOMC decision lands 29 April 2026 — the most important USD event of the week
The tone of the statement and post-decision press conference will matter more than the rate decision itself — watch Powell's words very carefully
🇪🇺 European Central Bank (ECB): ECB deposit rate hold at 2.00% widely expected with roughly 91% probability in the short term. However, growing probabilities of rate increases are building toward year-end
Money markets are fully pricing in two quarter-point ECB rate hikes in 2026, with a 55% probability assigned to a third increase by year-end — hawkish ECB repricing = EUR bullish fuel 🚀
⚡ RATE DIFFERENTIAL:
US rates at 3.75% vs Europe at 2.00% — USD-denominated assets continue to be perceived as more attractive, which keeps a ceiling on EUR/USD rallies over the longer term
US 10-year Treasury yields near 4.3% while European yields sit near 3.4% — this gap continues to favour dollar strength and stronger capital flows toward USD assets
Bulls need clear ECB rate hike signals to close this differential and fuel a sustained EUR/USD advance 📊
🛢️ GEOPOLITICAL RISK — THE HORMUZ WILDCARD:
The stalemate in the Strait of Hormuz has turned the currency market into a hostage to news headlines, pushing traditional macroeconomic factors into the background
The Strait of Hormuz remains effectively closed — Iran retaining control over the strategic route, vessels being detained, and the US maintaining a naval blockade, all supporting high energy prices and increasing inflation risks
Brent Crude pushing above $103 per barrel — deepening stagflation fears across the Eurozone
The longer the stalemate continues, the greater the upward pressure on energy prices, amplifying stagflation risks for Eurozone economies
⚡ However — any diplomatic breakthrough in Hormuz talks could ignite a sharp EUR/USD rally toward 1.1900+ almost immediately 💥
📉 EUROZONE ECONOMIC DATA:
Eurozone private sector contracted in April at the fastest pace since November 2024 — driven by the Iran war pushing up energy costs, hurting consumer demand and the services sector
Germany's Economics Ministry halved its 2026 growth forecast, blaming the energy shock from the Middle East conflict
Germany's IFO Current Assessment Index declined to 85.4 in April from 86.7 in March — limiting bullish EUR momentum
German economic weakness is a real headwind for EUR — this is the friction the bulls must push through ⚔️
📈 TECHNICAL PICTURE (What The Market Is Saying):
EUR/USD on the daily chart has been advancing for multiple consecutive sessions, trading above both the 100-day and 200-day SMAs — underlying uptrend structure remains intact
Momentum indicator supports additional gains while RSI has been hovering in bullish territory, indicating buying pressure remains in control
After the strong April rally, the pair reached resistance near 1.1850 and faced rejection — market currently consolidating without sharp sell-offs, suggesting re-accumulation before the next leg higher
🔑 Key support cluster to defend: 1.1680 – 1.1700 — this is the must-hold zone for bulls
MACD in neutral-to-slightly-negative territory on short-term charts — typical healthy pullback behaviour within an uptrend
📅 UPCOMING HIGH-IMPACT EVENTS THIS WEEK (London Time 🇬🇧):
🔴 Tuesday 29 April — FOMC Meeting Begins (2-day meeting)
🔴 Wednesday 29 April — Fed Interest Rate Decision + Powell Press Conference — MEGA volatility event ⚡
🔴 Thursday 30 April — ECB Policy Statement + Press Conference — crucial for EUR direction
🟡 Monday 28 April — German Consumer Confidence & Eurozone Sentiment Data
🟡 Week of 28 April — US PCE Inflation data + preliminary GDP figures — dollar-moving data points
THIEF TRADER STYLE — WISDOM FROM THE VAULT:
🗡️ "In this market, the best traders are not the bravest — they are the most patient. Wait, watch, strike, and VANISH with the bag."
💰 "The trend is your accomplice. The breakout is your invitation. The exit is your masterpiece."
🧠 "Amateurs watch price. Professionals watch liquidity. Thieves watch BOTH — and then take it all."
🏆 "You don't need to trade every candle. You only need to trade THE candle that matters."
🎯 "Plan the trade. Trade the plan. Protect the profit. Repeat the process."
🌍 "Markets are a global chess game. The Thief doesn't play checkers — we play 10 moves ahead."
🚀 "Stay humble. Stay sharp. Stay funded. The market will always be there tomorrow — make sure YOU are too."
⚠️ THIEF DISCLAIMER:
📌 This is a technical trade idea for educational and analytical purposes only
📌 Always apply YOUR OWN risk management rules — no one else is responsible for your capital
📌 Market conditions can change in seconds — especially with live geopolitical risk events active right now
📌 This is NOT financial advice. It is a Thief-style trade map. You choose the route. You carry the bag. 💼

Short-Term Recovery Signal in Brent OilBrent at $99.78 is giving a short-term bullish signal by positioning above the AlphaTrend support level of $98.37 on the 4-hour chart.
How is momentum developing?
The squeeze momentum indicator's 3.35 reading shows positive pressure continuing, while RSI staying in a healthy bullish zone at 61.58 signals that overbought risk has not yet formed, and the price trading 10.6% above the 50-day moving average at $90.21 maintains its short-term strength on the trend side.
With the AlphaTrend indicator's active BUY signal, the $98.37 level becomes a critical support line, and if this level holds, test movements toward the $108.42 resistance can be expected. The movement within the $84.20-$108.42 band on the 4-hour structure reveals that the current price is positioned in the upper half of this range and buyers have not yet relinquished control.
Which scenario should be monitored?
As long as persistence above the $98.37 AlphaTrend support is maintained, the potential for advancement toward the $108.42 resistance can be preserved, however declines below this level could strengthen correction movements toward the 50-day moving average at $90.21, and the negative momentum signals seen on the daily chart suggest the short-term recovery may remain limited.
Thanks for reading.

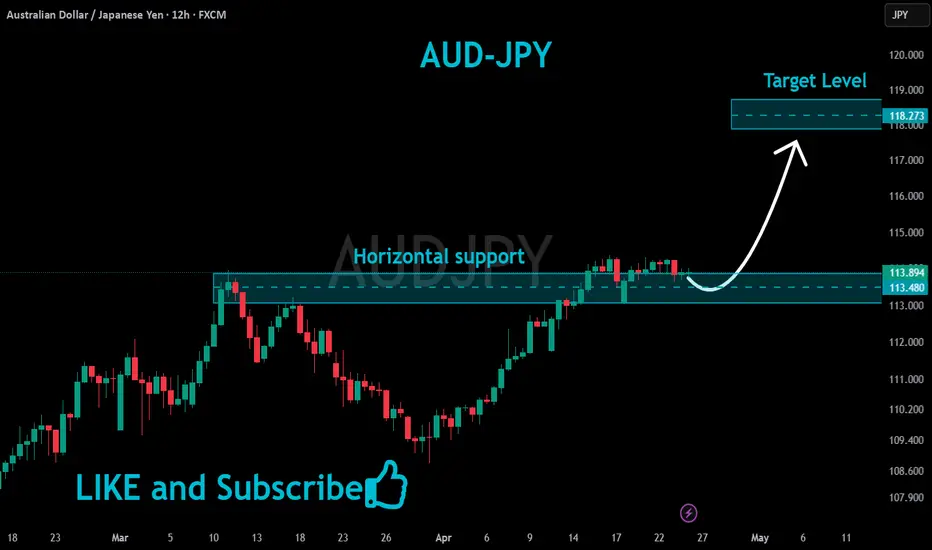
AUDJPY Support Ahead!
HI,Traders !
#AUDJPY is making a bearish
Correction towards the
Horizontal support of 113.480
So after the retest we will be
Expecting a bullish continuation !
Comment and subscribe to help us grow !
BTC - LTF Breakdown In regards to Bitcoin's lower timeframe structure (1H and 2H), BTC has now confirmed the breakdown from its upper range.
The first and most important support trendline I was watching was the purple trendline (1H timeframe). This was broken earlier today, labeled "Breakdown" on the chart. Price then rallied back to the upside, retested old support as new resistance in a bearish retest, and has since started to collapse.
On top of that the 2H trendline was also broken (dotted black trendline). This was less significant than the purple trendline but has still played a major role. Upon closing below that trendline, selling has begun to accelerate to the downside.
This is no surprise. Looking back at my previous idea of price entering the "Target 2" selling zone, BTC has double topped right around $79,500, which is directly in the middle of that range. You can view that idea here for more context:
So now the question is where does price go next?
The lower timeframe structure is broken, meaning it will not be as easy to push price to the upside as it has been over the past few weeks. However, since price has been in an uptrend there is still a significant amount of support built underneath current levels.
Here are the key support zones to watch:
Zone 1 is around $75,600 to $76,100. This is the top of the "Target 1" range and also the previous March 16th high.
Zone 2 is $73,800 to $74,500. There has been a significant amount of price action in this range over an extended period of time, not just recently.
Level 3 is $72,800.
Zone 4 is what I would consider the main zone with the most confluence and liquidity built up, currently sitting between $70,600 and $71,800.
If that is broken, Zone 5 is where price spent most of February and March, between $68,800 and $69,500.
These are the current levels to watch for buyers to make significant progress in maintaining the uptrend on the higher timeframes.
One important thing to keep in mind. According to all available data BTC is still in a bear market. The highest price is likely to reach in any future rally would be $86,000 to $87,000 before establishing a macro lower high.
Another scenario worth considering is that BTC has just created its next lower high already in this bear market. $126,000 all time high, lower high at $98,000, and now a potential lower high at $79,500. This remains a very real possibility and the trend is always your friend until it ends.
Hopefully this gives you a clear outlook on the key levels to watch this week. Price has started at least a short term downtrend that could develop into a longer term downtrend given certain confirmations. As more price structure develops I will be making follow up posts. Stay tuned!

EURAUD - NEW BEARISH MOVEHello traders,
after a strong bearish move, EURAUD has broken the support level (1.63563 – 1.63434).
This key zone now acts as a new resistance,
indicating potential bearish continuation.
Based on this breakdown, I expect another bearish move.
🎯 TARGET: 1.61750


U.S OilU.S Oil
- Bearish Channel as an corrective pattern in Long Time Frame
- Order Block
- Demand Zone
- Completed " 1234 " Impulsive Waves
- Fibonacci Level - 50.00% / 61.80%

Trade Plan: USDCADTrade Plan: USDCAD
• Direction: Long
• Entry: 1.35565
• Stop Loss:1.34800
• TP1: 1.36900
• TP2: 1.38100
• TP3: 1.39350
Take partial profits at each target, then trail stop to protect profits.
Not financial advice.

ETHUSD.P 4H: Short Toward 1816 — Range ContinuationOn the 4H timeframe, ETH is showing a short setup based on technical indicators, with a potential move toward 1816.77.
One key level to watch is the EMA200, which could act as support. Price may either bounce from it or break through, especially after several days of consolidation.
Currently, the market looks like it’s still in a larger range, and this move could be part of a continuation toward the lower boundary of the weekly channel.
Scenario:
Flat → breakdown → move toward lower channel.
Disclaimer:
I am not a financial expert or analyst. This is just my personal market view and prediction based on my analysis.

EUR/USD (1H) Sell Setup Target...EUR/USD (1H) Sell Setup Target
Entry Zone: 1.1730 – 1.1750 (resistance area)
Target 1: 1.1705
Target 2: 1.1680
Target 3: 1.1655 (main support zone)
Stop Loss: 1.1762 above resistance
Analysis: Price is reacting from resistance and trendline area. If rejection continues, downside move toward 1.1655 is possible. If price breaks above 1.1760, sell idea weakens.

Support Holds, Resistance at 4750📊 Market Overview: Gold’s bullish momentum remains sluggish, with price action failing to gain traction and subsequently retreating amid sustained selling pressure. The market is currently in a consolidation phase, with bears attempting to push prices lower while bulls struggle to mount a meaningful counterattack.
🔍 Core Observation: Despite the weak bullish backdrop, the key strong support zone of 4660-4670 has effectively held, successfully curbing further downside momentum from bears and providing a solid floor for price stability. On the upside, resistance is clearly defined near the 4750 level — a decisive breakout above this threshold will unlock additional upside potential, targeting the next resistance zone at 4820–4830.
⚠️ Key Levels:
- Support: 4660-4670 (strong core support, critical for preventing further downside)
- Resistance: 4750 (key turning point for upside momentum); 4820–4830 (next target if 4750 is broken)
📈 Today’s Trading Strategy:
- Go long above the 4660-4670 support area (focus on stable price holding above the zone to avoid false breakouts)
- Add to long positions on a decisive breakout above 4750 (confirm the breakout to avoid chasing the price, ensuring risk control)

XAU LONGShe’s tryna find 720 to grip, it’s here or 83 run off.
Same old bs.. 83 dip 62…
High doubts.
Thank you 🫶🏽

XAUUSD: Short Wave C Near Sell Zone
Gold is pushing into a sensitive area, but from Kelly’s perspective, the current recovery is more likely the final short wave C of a corrective structure rather than the start of a sustainable bullish trend. What makes this zone especially important is that price is approaching the 4742–4748 sell zone, where the short-term structure may complete before the market begins a new cycle on the higher timeframe.
Technical structure
The current structure shows gold still reacting below near-term resistance, even though the short-term rebound remains in place. Price is moving into a clearly marked supply area, while still trading below the broader strong resistance at 4889, with no decisive breakout strong enough to confirm a higher-timeframe bullish reversal.
What matters here is that this rebound is developing after a multi-leg corrective phase, and the 4742–4748 area aligns with a potential sell region on the chart. That puts the market into a decision zone: buyers would need to push clearly above it to shift the structure, while failure in this area could quickly bring sell-side pressure back.
Key levels to watch:
4742–4748: nearest sell zone
4640: support level confirming short-term weakness
4548: next strong support area
4351: deeper support zone if the new bearish cycle expands
Elliott Wave view
From an Elliott Wave perspective, the current rebound fits best as the final short wave C of the corrective phase. If that count is correct, then the market is approaching the end of the rebound, and the next important move would be the completion of wave C, followed by the start of a new cycle on the higher timeframe.
This is the key point Kelly is focusing on. A final wave C can still look strong in the short term, but if it completes directly into supply and is followed by a clear reversal candle, the market often shifts direction quite quickly. That is why the main focus is not simply that price is rising, but where it is rising into and how it reacts once it reaches that zone.
Fibonacci and liquidity structure
Structurally, the current rebound is also approaching an area that makes sense for a corrective move to complete. Price is moving into a short-term supply region, while lower liquidity still sits below at 4548, and deeper down at 4351.
That keeps the downside scenario technically attractive, especially if wave C ends with a clear rejection candle inside the current sell zone. When supply, wave structure, and liquidity begin to align, the market often reacts in a meaningful way.
What matters next
If gold reaches 4742–4748 but fails to close firmly above that area, while also printing a clear reversal candle, it would suggest that the short wave C may be complete. In that case, the market could begin rotating back towards 4640 first.
If 4640 breaks, the bearish structure would strengthen and open the path towards 4548. If selling pressure expands further in line with the higher-timeframe cycle, then 4351 becomes the deeper technical reference.
On the other hand, if price breaks cleanly above the sell zone and holds there, then the current wave count would lose quality and the chart would need to be reassessed.
Kelly’s view
For Kelly, this is still a wave-C completion setup, not a breakout structure strong enough to justify a broader bullish continuation. The current rebound may still stretch slightly higher, but as long as price is reacting inside 4742–4748, the preferred view remains to watch for reversal confirmation that would signal the end of wave C.
As long as gold cannot decisively break above the current supply zone, Kelly’s bias remains that the market is completing its short corrective rebound and preparing to begin a new higher-timeframe cycle.
Conclusion
Gold is currently trading in its final short wave C, and price has now entered the important 4742–4748 sell zone. This is the area to watch closely, because if a clear reversal candle appears, the market may confirm the end of the rebound and begin a new bearish cycle on the higher timeframe.
The rebound is still visible.
But if wave C finishes inside this supply zone, the more important move in gold may soon return to the downside.

Amd - It's now time to take profits!🎰Amd ( NASDAQ:AMD ) is sitting at major resistance:
🔎Analysis summary:
This month Amd created an incredibly rally of about +35%. But looking at the higher timeframe, this just happened after a significant all time high break and retest. With the current retest of the major resistance trendline though, we could see a reversal.
📝Levels to watch:
$275
Trusting the Trading Gods🙏🏻

BUY XAUUSDBuying gold at the current price. we can clear see a support level after a push to the downside. its a good 1 to 6 risk to reward and my targets are in the zone of interest. we are buying low to sell high,

$NOW , SetupENTRY : CMP
TP1 : 123.46
TP2 : 168.69
TP3 : 217
TP4 : 280.93
SL : If you wish
My SL is never a SELL, just an alarm to stop adding money and wait for better dca
Follow, Boost, Thank You !
⚠️ Financial Disclaimer:
This post is not financial advice. I am not your financial advisor, your life coach, or your legally responsible adult.
Always do your own research and never trade based solely on internet comedy.

S&P500 INDEX (US500): Bullish Intraday Price Action
A quick follow-up for US500.
I see a strong intraday bullish price action after a retest
of a recently broken structure.
We can expect the price to rise soon.
❤️Please, support my work with like, thank you!❤️
I am part of Trade Nation's Influencer program and receive a monthly fee for using their TradingView charts in my analysis.
