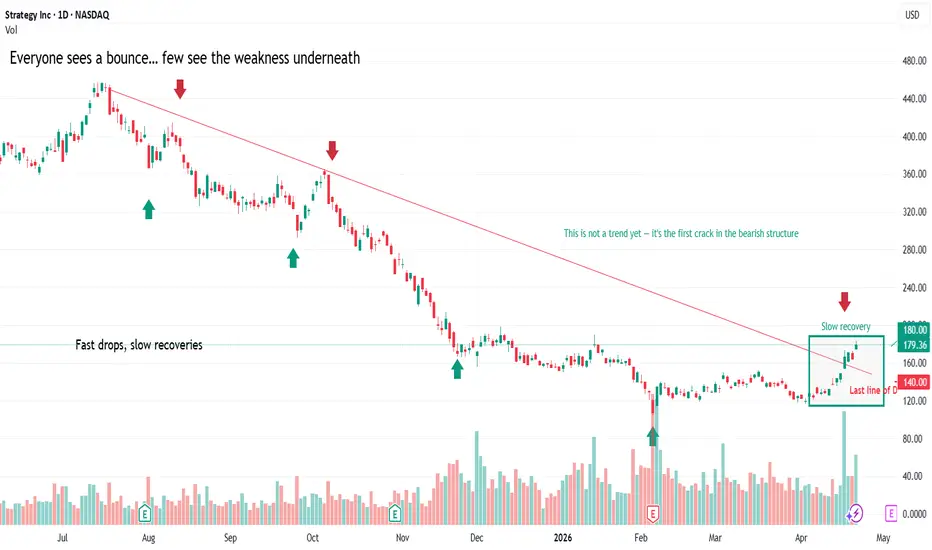
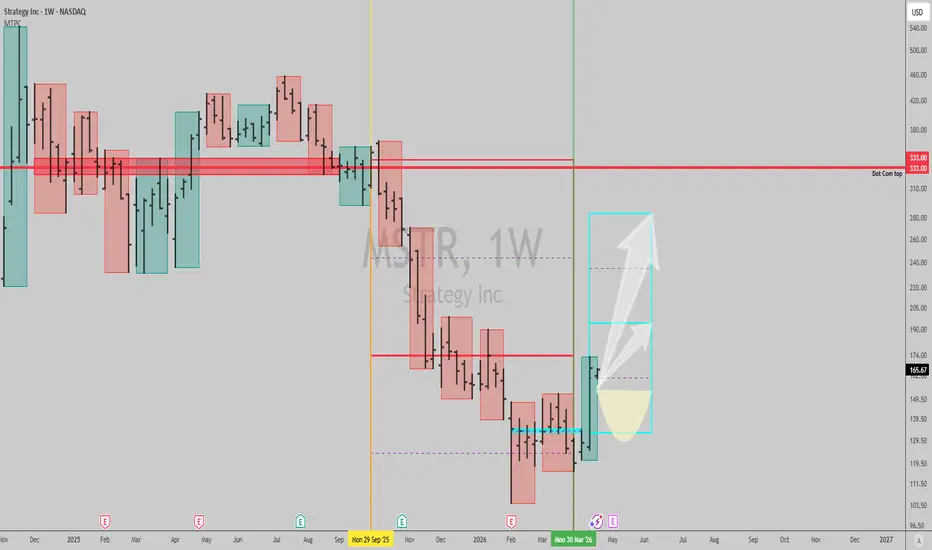
Week 17 of 52 - MSTR You’re Either Early… or Completely WrongNASDAQ:MSTR Everyone sees a bounce… few see the weakness underneath.
After a sharp sell-off, MSTR is attempting a recovery — but the structure tells a different story.
What we are seeing here is not strength… it’s a relief rally.
Price is still respecting the broader downtrend, consistently form
Key facts today
Next report date
—
Report period
—
EPS estimate
—
Revenue estimate
—
−13.88 USD
−3.85 B USD
477.23 M USD
325.99 M
About Strategy Inc
Sector
Industry
CEO
Phong Q. Le
Website
Headquarters
Tyson's Corner
Founded
1989
IPO date
Jun 11, 1998
Identifiers
3
ISIN US5949724083
Strategy, Inc. engages in the provision of enterprise analytics and mobility software. The firm designs, develops, markets, and sells software platforms through licensing arrangements and cloud-based subscriptions and related services. Its product packages include Hyper. The company was founded by Michael J. Saylor and Sanjeev K. Bansal on November 17, 1989, and is headquartered in Tysons Corner, VA.
Related stocks
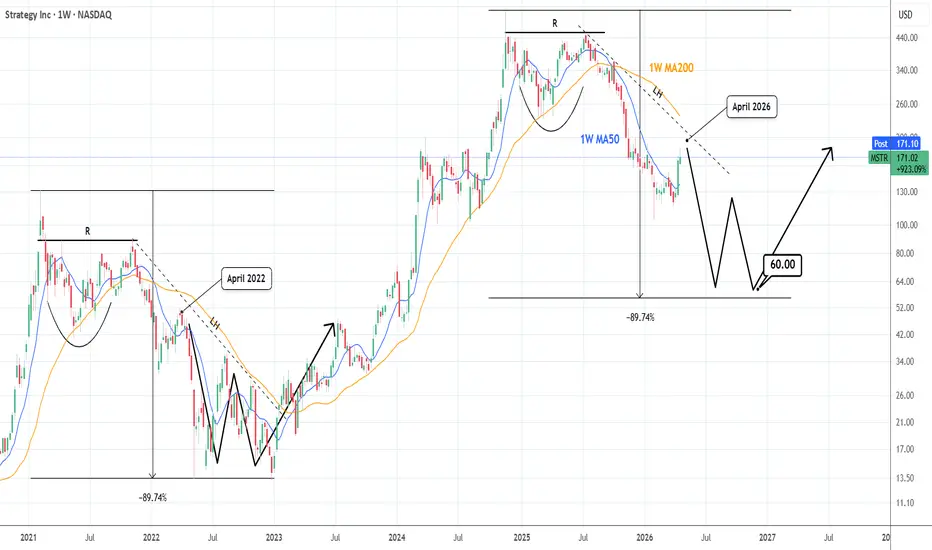
STRATEGY: This is the perfect spot to re-sell like April 2022.Strategy has turned neutral on its 1W technical outlook (RSI = 47.670, MACD = -33.360, ADX = 28.820) due to the strong rally of the past 2 weeks. As it approaches the LH trendline of the Bear Cycle and more importantly the 1D MA200, it becomes a strong sell opportunity as that was the market's (R)es
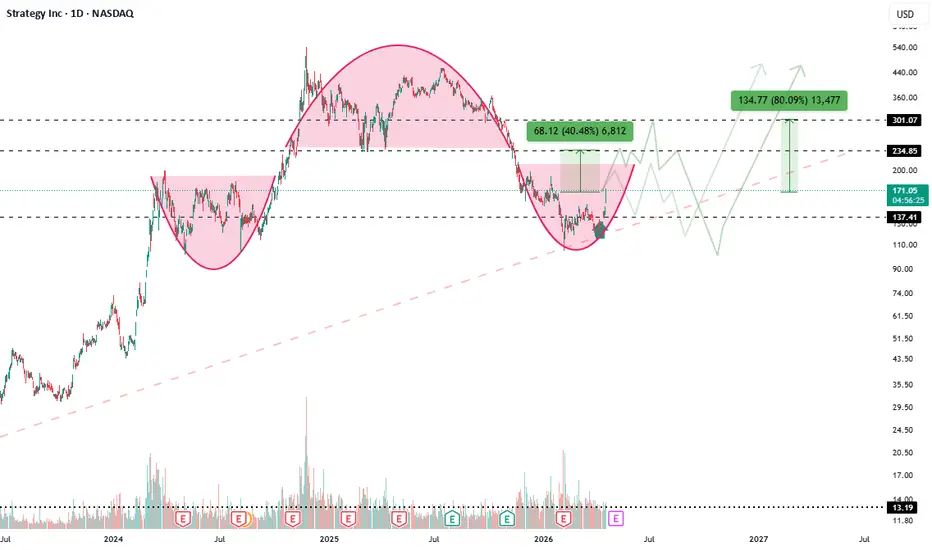
Growth Strategy continues to work, but not as wellI’ll complement idea for the Strategy idea, this is a ready-made strategy for growth. We opened a position from $140.
Now the price has moved in our direction and we can put a stop at $148, so in the worst case scenario we will earn at least 10%!
NASDAQ:MSTR MSTR shares are currently up +6% an
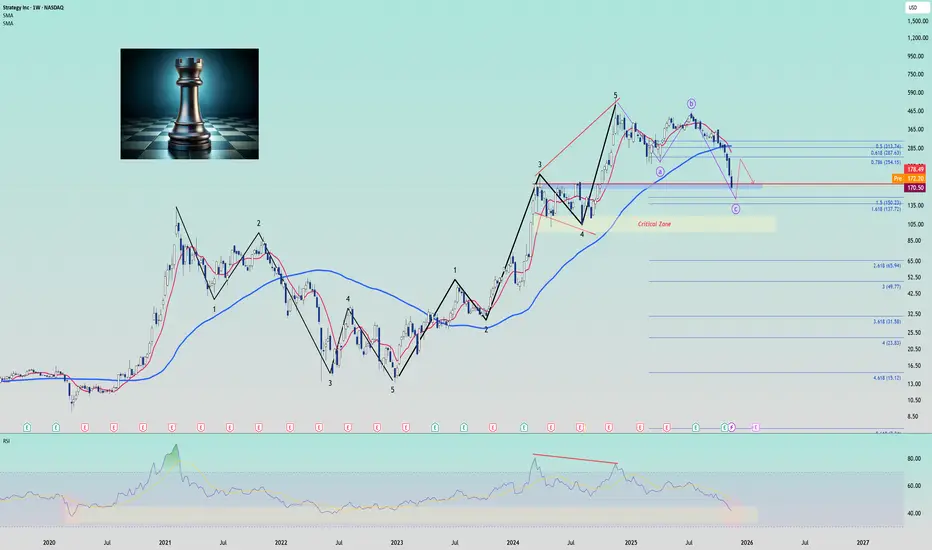
MSTR Chess Game: When Smart Money Plays Against Saylor!
Did you play chess before?
For me, i started playing it in the past 3 days, and even though i reached a nice speed rank, the performance and game review still show the blind movement! And this is EXACTLY what Saylor is doing! Let me show you the data:
He bought $1.5B at $52K (March), then added $
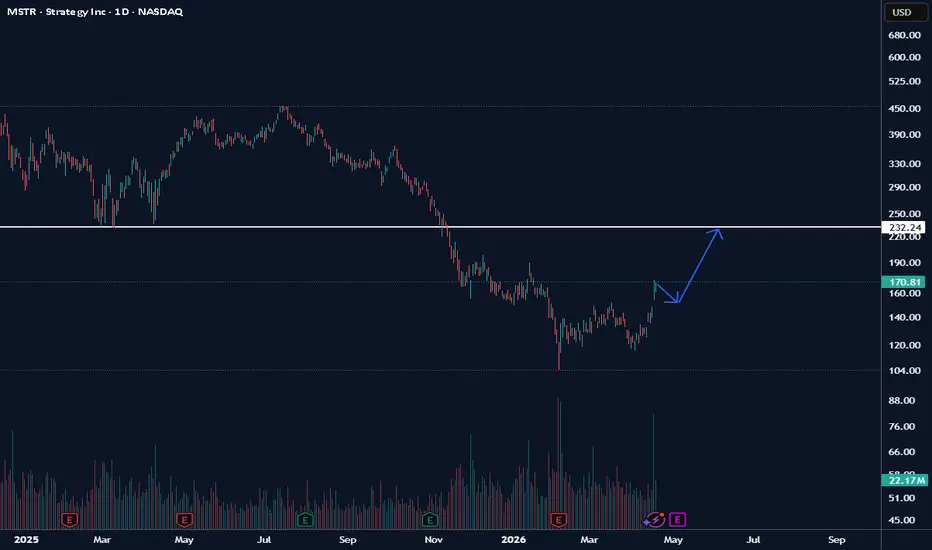
MSTR weekly Time@Mode buy signal: retrace setup activeGM lads,
A fresh weekly Time at Mode signal fired on MSTR this week. The monthly cycle signal published April 15, framed as an "October 2022 déjà vu", remains live and in profit from the publication date. Structure supports a buy-on-retrace entry within the next three weeks.
Best of luck!
Cheers,
Key Resistance & Targets: Mid-term and Long-term OutlookThis is a key zone for taking partial profits or closing positions entirely. On April 22nd, I published a BTC short based on my view that we are completing a Wave Y, with targets around the $50k region. Although Strategy doesn't track BTC 100%, I believe the correlation will hold for this move.
Pos
MSTR Squeeze targetThere has been good insider buying past several weeks. BTC is coming out of the bottoming base. This can pump hard if BTC momentum continues.
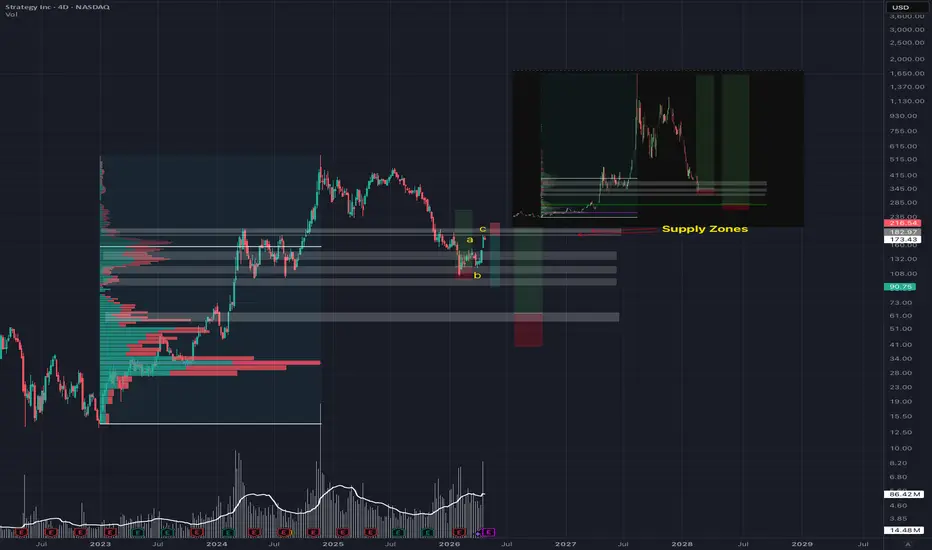
Trade Plan: MSTRTrade Plan: MSTR
• Direction: Long
• Entry: 121.00
• Stop Loss: 100.00
• TP1: 210.00
• TP2: 325.00
• TP3: 500.00
Take partial profits at each target, then trail stop to protect profits.
Analysis based on market structure, volume profile and harmonic pattern.
Not financial advice.

(micro)StrategyThe red submarine has started to descend again and it presents us a buy opportunity as rarely seen in stocks.

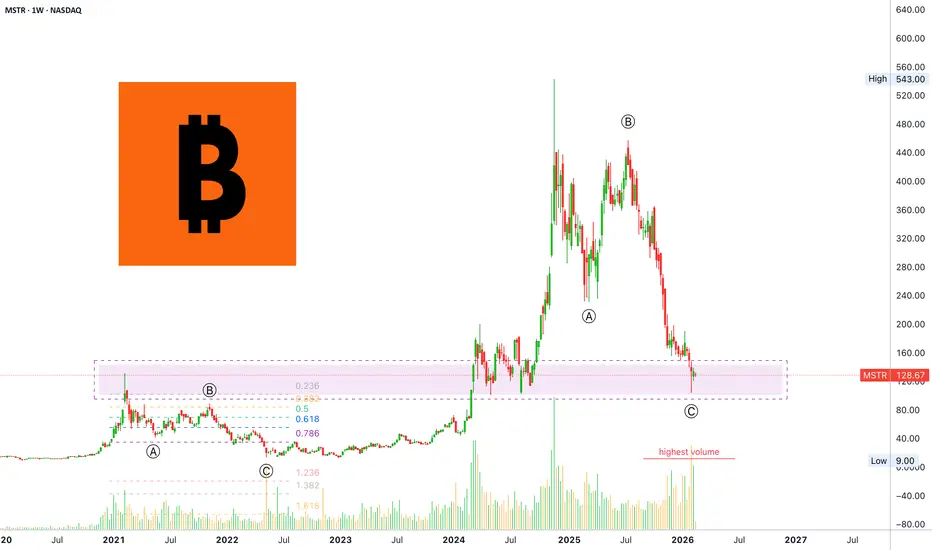
Strategy Inc —Perfect ABC correction, a repeat of 2021-22Strategy Inc (MSTR) went through the exact same sequence in 2021-22. A perfect ABC correction. The end of wave C produced the highest volume (bearish) and also the bottom. It lasted 455 days.
The current bear market drew a perfect ABC correction. The end of wave C has the highest volume (bearish).
See all ideas
Summarizing what the indicators are suggesting.
Neutral
SellBuy
Strong sellStrong buy
Strong sellSellNeutralBuyStrong buy
Neutral
SellBuy
Strong sellStrong buy
Strong sellSellNeutralBuyStrong buy
Neutral
SellBuy
Strong sellStrong buy
Strong sellSellNeutralBuyStrong buy
An aggregate view of professional's ratings.
Neutral
SellBuy
Strong sellStrong buy
Strong sellSellNeutralBuyStrong buy
Neutral
SellBuy
Strong sellStrong buy
Strong sellSellNeutralBuyStrong buy
Neutral
SellBuy
Strong sellStrong buy
Strong sellSellNeutralBuyStrong buy
Displays a symbol's price movements over previous years to identify recurring trends.
Frequently asked questions
The current price of MSTR is 169.20 USD — it has decreased by −0.84% in the past 24 hours. Watch Strategy Inc stock price performance more closely on the chart.
Depending on the exchange, the stock ticker may vary. For instance, on NASDAQ exchange Strategy Inc stocks are traded under the ticker MSTR.
MSTR stock has risen by 10.60% compared to the previous week, the month change is a 21.81% rise, over the last year Strategy Inc has showed a −52.20% decrease.
We've gathered analysts' opinions on Strategy Inc future price: according to them, MSTR price has a max estimate of 705.00 USD and a min estimate of 185.00 USD. Watch MSTR chart and read a more detailed Strategy Inc stock forecast: see what analysts think of Strategy Inc and suggest that you do with its stocks.
MSTR reached its all-time high on Nov 21, 2024 with the price of 543.00 USD, and its all-time low was 0.42 USD and was reached on Jul 3, 2002. View more price dynamics on MSTR chart.
See other stocks reaching their highest and lowest prices.
See other stocks reaching their highest and lowest prices.
MSTR stock is 4.86% volatile and has beta coefficient of 2.16. Track Strategy Inc stock price on the chart and check out the list of the most volatile stocks — is Strategy Inc there?
Today Strategy Inc has the market capitalization of 59.21 B, it has increased by 20.42% over the last week.
Yes, you can track Strategy Inc financials in yearly and quarterly reports right on TradingView.
Strategy Inc is going to release the next earnings report on May 5, 2026. Keep track of upcoming events with our Earnings Calendar.
MSTR earnings for the last quarter are −42.93 USD per share, whereas the estimation was −0.08 USD resulting in a −53.56 K% surprise. The estimated earnings for the next quarter are −20.29 USD per share. See more details about Strategy Inc earnings.
Strategy Inc revenue for the last quarter amounts to 122.99 M USD, despite the estimated figure of 119.12 M USD. In the next quarter, revenue is expected to reach 120.75 M USD.
MSTR net income for the last quarter is −12.44 B USD, while the quarter before that showed 2.79 B USD of net income which accounts for 0.00% change. Track more Strategy Inc financial stats to get the full picture.
No, MSTR doesn't pay any dividends to its shareholders. But don't worry, we've prepared a list of high-dividend stocks for you.
As of Apr 28, 2026, the company has 1.54 K employees. See our rating of the largest employees — is Strategy Inc on this list?
EBITDA measures a company's operating performance, its growth signifies an improvement in the efficiency of a company. Strategy Inc EBITDA is −6.32 M USD, and current EBITDA margin is −0.30%. See more stats in Strategy Inc financial statements.
Like other stocks, MSTR shares are traded on stock exchanges, e.g. Nasdaq, Nyse, Euronext, and the easiest way to buy them is through an online stock broker. To do this, you need to open an account and follow a broker's procedures, then start trading. You can trade Strategy Inc stock right from TradingView charts — choose your broker and connect to your account.
Investing in stocks requires a comprehensive research: you should carefully study all the available data, e.g. company's financials, related news, and its technical analysis. So Strategy Inc technincal analysis shows the buy rating today, and its 1 week rating is neutral. Since market conditions are prone to changes, it's worth looking a bit further into the future — according to the 1 month rating Strategy Inc stock shows the buy signal. See more of Strategy Inc technicals for a more comprehensive analysis.
If you're still not sure, try looking for inspiration in our curated watchlists.
If you're still not sure, try looking for inspiration in our curated watchlists.