TOTAL CRYPTO CAP: This Bearish Pattern Continues!Hello There,
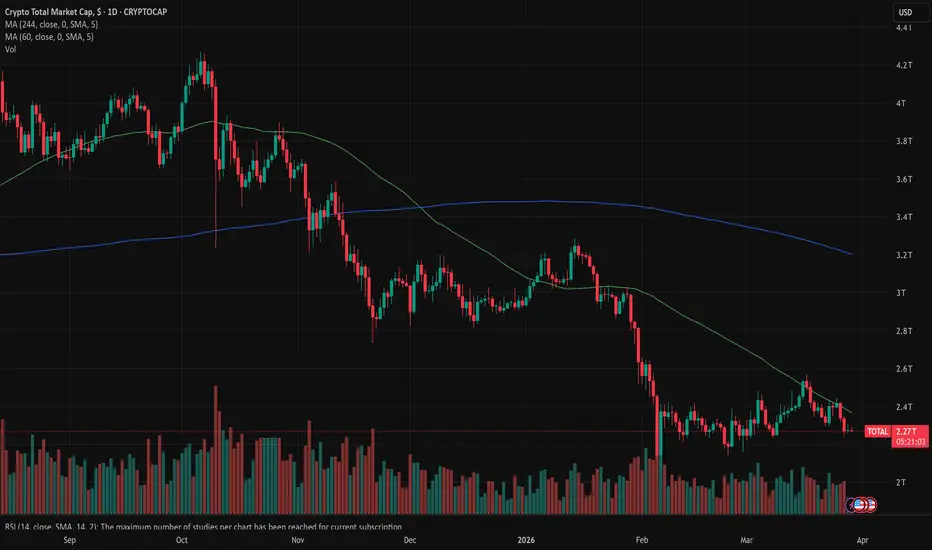
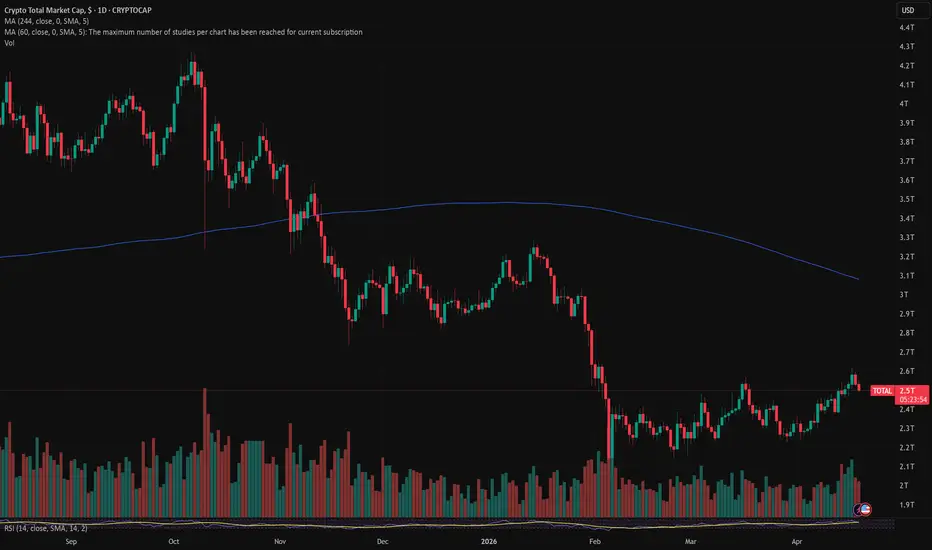
welcome to my new analysis about the TOTAL CRYPTOCURRENCY MARKET CAP. I am analyzing the daily timeframe perspective. This index shows all the cryptocurrency price movements combined in only one single price movement index. In recent times heavy selling pressure has hit the whole market. Many whales dumped their shares into the market. Since the beginning of this selling pressure, the market has dropped over -45%. The market has lost over $1.94 billion since the heavy selling pressure began.
When looking at my chart, we can see there that the index is trading within this sustained and prolonged descending channel formation. This is a crucial bearish continuation formation. It is more likely that this channel prints new lows after another before a reversal into the other direction can even be possible. Right now the price is already testing the upper descending resistance channel, which serves as a major resistance. A pullback from this area is highly likely, as this is just a very strong resistance area.
Furthermore, the index has major resistance levels within the 100-MA marked in red in my chart. This moving average also corresponds heavily with the bearish descending resistance channel, therefore building a bearish confluence area. In the next times, a bearish pullback from this area towards the downside is highly likely. Once the price pulls back below the next bearish continuation wedge formation as marked in my chart, it will set up the next bearish wave towards the downside.
In this manner, thank you for watching!
What do you think about the index?
Let us know in the comments!
VP
Crypto Total Market Cap, $
No trades
In-depth trading ideas

MARKETS week ahead: April 26 – May 2Last week in the news
Elevated energy costs and fragile geopolitical conditions, increased fears of supply shocks, clouded outlook for inflation and monetary policy continue to be major concerns of investors. Nevertheless, the S&P 500 hit a new all-time high at 7,163 points on Friday but later reversed gains as sentiment turned cautious. The price of gold continues to hold higher grounds regardless of a modest pullback toward the $4.708. US 10Y Treasury yields are trying hard to find some ground, finishing another week at elevated levels of 4,3%. The crypto market also manages to find momentum with the latest BTC attempt to test the $80K resistance. Still, the coin closes the week around $77K.
Posted macro data for the U.S. showed stronger-than-expected U.S. Retail Sales data, which rose 1.7% m/m in March versus forecasts of 1.1%, while annual growth reached 4%, well above the 2.4% consensus. Consumer sentiment data from the University of Michigan for April came in at 49.8, slightly above expectations of 47.6. Meanwhile, five-year inflation expectations edged higher to 3.5% from 3.2%, indicating a modest rise in longer-term price concerns. The week ahead brings the FOMC meeting, where the Fed will discuss current levels of interest rates. According to the latest CME FedWatch, markets are overwhelmingly expecting the Federal Reserve to hold interest rates steady.
Intel stock moved into focus this week, posting a sharp rally following a strong earnings beat and optimistic forward guidance. Shares surged more than 20–25%, reaching record levels, supported by better-than-expected revenue and rising demand for AI-driven data center CPUs. The move was further underpinned by solid growth in the data center segment and a constructive outlook for the next quarter, strengthening confidence in the company’s turnaround. Overall, Intel emerged as a key driver of the broader semiconductor rally, with positive spillovers across the tech sector as markets continue to price in sustained AI demand.
The latest CNBC report highlights that a sharp AI talent war is intensifying between enterprise software companies and major AI players like OpenAI, as firms compete aggressively for experienced executives. Several senior leaders from companies such as Salesforce, Snowflake, and Palantir are being recruited with highly attractive compensation packages and the promise of direct access to enterprise clients and revenue growth opportunities. This shift reflects how AI companies are increasingly targeting the enterprise software market as a key growth engine, turning executive hiring into a strategic battleground for scaling adoption and market share.
Nvidia stock closed at a record high, pushing its market capitalization above $5 trillion for the first time, driven by continued strong demand for AI-related chips. The rally was supported by broad strength across the semiconductor sector, particularly following upbeat earnings from key industry peers, which reinforced investor confidence in AI infrastructure growth. Overall, Nvidia’s surge reflected sustained optimism around artificial intelligence as a dominant market theme, with spillover gains across the broader tech sector.
CRYPTO MARKET
A relatively mixed week is behind the crypto market, with performance diverging across major assets and a lack of clear directional momentum. While Bitcoin managed to extend gains, several altcoins experienced mild corrections, pointing to a more selective market environment. Total crypto market capitalization was increased by 1,1% w/w, adding $27B to its market cap. Daily trading volumes were modestly decreased to the level of $213B, from last week's $307B. Total market capitalization since the beginning of this year currently stands in a negative territory of -13%, with a total outflow of -$369B.
BTC and ETH once again set the tone for the market. Bitcoin continued its upward move, gaining 2.1% on a weekly basis, while Ethereum underperformed with a 1.9% w/w decline, indicating some rotation away from the second-largest asset. Among other major cryptocurrencies, performance was mixed. XRP declined slightly by 0.5%, while BNB remained broadly flat (-0.2%). Solana also showed minimal change (-0.02%), reflecting consolidation at current levels.
Among the strongest performers within the major list, Zcash stood out with a solid 10.4% weekly gain, Monero also delivered a strong performance, rising 7.9%, while Algorand gained 6.3% and Maker advanced 4.6%. Additional upside was seen in POL (+3.8%) and DASH (+2.9%). On the negative side, Hyperliquid recorded the largest decline, falling 6.7% w/w, followed closely by THETA with a 6.3% drop and OMG Network down 6.0%. Uniswap also declined 3.7%, while Polkadot lost 2.5% and SUI slipped 2.0%, indicating mild but broad-based pressure across parts of the altcoin segment.
Outside of the majors, several tokens delivered notable upside performance. Humanity Protocol recorded a 25.0% weekly gain, while Stable increased by 25.2%, and Chiliz advanced by 21.9% w/w, placing them among the top performers in the broader market.
Circulating supply dynamics showed some more visible changes this week. Polkadot recorded the largest increase in supply of a 0.6% increase. Stellar expanded supply by 0.3%, while XRP and IOTA both saw 0.2% increases. Several other assets, including DOGE, Cardano, DASH, Zcash, Solana and Filecoin, recorded 0.1% growth. On the downside, Hyperliquid and Uniswap both posted slight 0.1% decreases in circulating supply.
CRYPTO FUTURES MARKET
Bitcoin futures showed a largely stable performance this week, with only marginal changes across the curve following the strong upward momentum observed in prior weeks. The April 2026 maturity increased slightly by 0.44% w/w, settling at $77,940, while most other maturities recorded minimal gains in the range of 0.06% to 0.18%. Longer dated futures remained similarly steady, with the December 2027 maturity closing at $84,865, up just 0.10% on the week. The muted price action suggests a pause in momentum, with the market entering a consolidation phase after the recent rally.
In contrast, Ether futures experienced a notable pullback, reversing part of the gains from previous weeks. The April 2026 contract settled at $2,312, declining 5.01% w/w. Across the curve, losses ranged between 4.47% and 5.01%, indicating a broad based correction. The December 2027 maturity closed at $2,557, down 4.55% on the week. The consistency of declines across maturities points to a parallel downward adjustment rather than localized pressure.
It is also worth noting that October 2026 futures appeared on the curve for the first time this week for both Bitcoin and Ether, with initial pricing at $79,720 and $2,385, respectively.
Overall, the week reflects a divergence in market dynamics, with Bitcoin futures stabilizing while Ether futures undergo a meaningful correction. Despite these differing short-term trends, both futures curves remain in contango, indicating that longer-term expectations continue to be priced at higher levels relative to near-term maturities.
3 mistakes that will wipe you out in a growing marketRight now, a small part of the market has already reached its long-term moving averages, while another part is just starting to move in the same direction.
There is a high probability that the rally will continue until May, as this is how full growth waves usually play out — the market moves up without giving easy entries, with no significant corrections.
However, even though there is still widespread denial of growth in the market, sooner or later realization will come to everyone. The only problem is that by that time, the growth wave will already be coming to an end — but that’s a topic for other posts.
That’s when everyone will start thinking that making money in a bull market is easy — just buy and hold. But in reality, most people lose everything именно during the rally.
Why?
1️⃣ Futures with full deposit
Market growth creates euphoria and triggers FOMO (fear of missing out).
Confidence in continued growth activates maximum risk mode → people use x20 leverage on their entire deposit.
Result: liquidation and total loss of funds.
Even if it works at first, without risk management the account will eventually be wiped out.
This is not theory — it’s a fact.
2️⃣ All-in on altcoins
Probably the biggest mistake — not only beginners, but even experienced traders make it.
After crypto conferences, it becomes clear: even opinion leaders sit 100% in altcoins.
People are willing to risk their entire capital just for the hope of huge gains.
We’ve said it many times and will repeat it again: the majority of your portfolio should be in Bitcoin.
3️⃣ No strategy / no take-profits
During growth, most people think they will hold until the very top.
Reality:
A -30% correction wipes out emotions → people sell at a loss, forgetting their original HOLD strategy.
Never enter a position without a clear plan:
entry, take-profits, stop-loss.
Otherwise, the market will decide for you — and it won’t be pleasant.
Experience shows that the best strategy is to take profits gradually as the market moves up.
If your profit already feels “screenshot-worthy” — it’s time to lock in at least part of it.
📊 Conclusion
Making money in crypto is real.
But only if you avoid these 3 mistakes.
Right now, it’s better to use the opportunities while respecting risk management.
However, don’t relax.
If your positions have moved from loss to breakeven →
reduce them to a comfortable level.
So that if negative scenarios play out, you stay in control and feel confident.
_____
👉 Want to get more useful information without the fluff? Follow for real insights and strategies 🚀
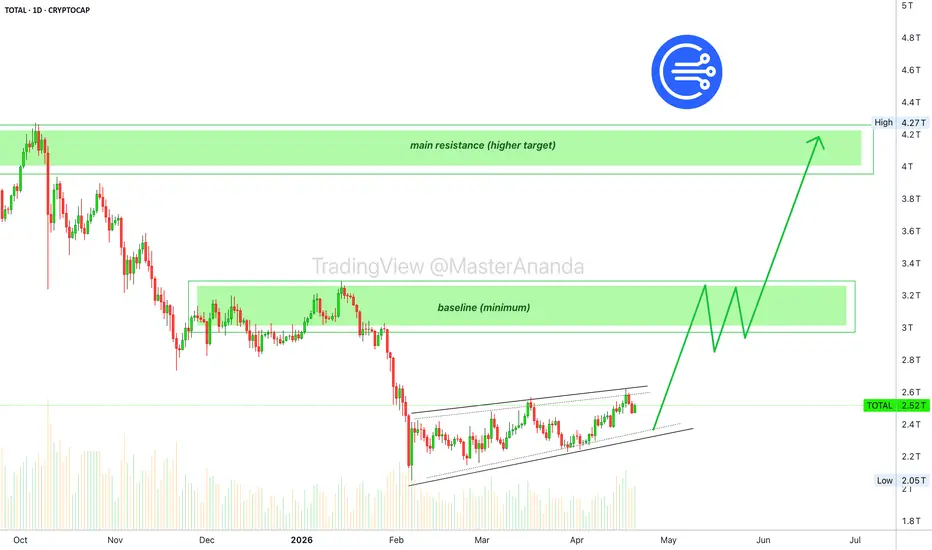
A major bullish wave is approaching the Cryptocurrency marketThis is just a very friendly reminder. Just buy everything. Buy as much as you can and hold. No need to focus on the long-term because we are getting very close — Crypto is going up.
We are right in front of a major, major bullish cycle. A true bull market. A true altcoins market bull market like nothing you have experienced before.
This bull market has not been only months in the making, this is only the last part. It has been years in the making and it is late. It is overdue and it is here now.
Are you going to miss it?
Are you going to take action?
When the action starts, it is already too late.
You have this unfair advantage, you know about it before it happens. Make the most of this information. Make the most out of this opportunity. It will be months of sustained growth.
It can last 2 months, just as it can last 3 or 4 months. It will feel like forever when prices are going up.
It will go up for so long, that you will get used to seeing prices rising. You will even become complacent at some point.
All is good. I am here for you.
Thanks a lot for your continued support.
This is the last reminder, until my next article of course. BUY AND HOLD!
Buy as much as you can. All those pairs trading at bottom prices and all those pairs trading at support. You will be extremely happy with the results.
Namaste.
MARKETS week ahead: April 19 – 25Last week in the news
The Strait of Hormuz was declared open, while the inflation figures in the US were relatively calm, which caused investors to regain optimism and push US equity markets to higher grounds. The S&P 500 managed to cross the 7K mark, and reach a fresh new all time highest level at 7.146. The still relatively unstable geopolitical situation continues to support a demand for safe haven assets, in which sense, the price of gold remained at higher levels, closing the week at $4.837. US Treasury yields continue to digest the macro environment, trying to decide which side to take, however, this week was a relaxing one, with 10Y yields closing it at 4,24%. Investors' optimism this time was reflected also on the crypto market, where BTC crossed the $75K mark.
Recent U.S. macro data suggests that inflation remains contained, while signs of economic slowdown are becoming more visible, particularly in the industrial sector. Existing home sales declined by 3.6% in March, sharply missing expectations of a 2.0% monthly increase, pointing to continued weakness in the housing market. Meanwhile, the Producer Price Index (PPI) rose 0.5% m/m, well below the 1.1% consensus, indicating softer upstream price pressures. Core PPI also underperformed, increasing just 0.1% m/m and 3.8% y/y, compared to expectations of 0.5% m/m and 4.1% y/y, reinforcing the narrative of easing inflation momentum. On the growth side, industrial production fell by -0.5% m/m, missing forecasts of a +0.5% increase, although it remains slightly positive at 0.7% y/y, still below expectations of 1.8% y/y. Overall, the data points to cooling inflation alongside weakening economic activity, which might help the Fed to cut interest rates somewhere during the course of this year.
Oil prices posted a sharp decline, with both WTI and Brent falling significantly as a U.S.-brokered ceasefire between Israel and Lebanon raised expectations of easing supply disruptions. The move was reinforced by signals that the Strait of Hormuz could remain open, reducing fears of a major energy shock and inflation spike. However, despite the sell-off, markets remain cautious as the situation is still fragile, with ongoing tensions, a continued U.S. blockade, and uncertainty over the durability of the ceasefire limiting confidence in a sustained downward trend in oil.
Federal Reserve Governor Christopher Waller said ongoing Middle East tensions are likely to push inflation higher in the near term, mainly through elevated energy prices, complicating the outlook for rate cuts. However, he noted that a swift resolution of the conflict could stabilize inflation and keep the door open for rate cuts later this year, while a prolonged crisis may force the Fed to hold rates higher for longer.
Citi maintains a bullish outlook on Japanese equities, supported by an improving macro backdrop and relatively resilient global conditions. Stronger corporate fundamentals and earnings trends are seen as key drivers, alongside continued interest from international investors. From a macro perspective, Japan is benefiting from a more stable environment compared to previous years, even as risks from higher oil prices and global uncertainties remain, in which sense, Citi expects Japanese stocks to continue trending higher.
CRYPTO MARKET
Another positive week is behind the crypto market, with continued upward momentum across the majority of digital assets. While gains were more moderate compared to the previous rally, sentiment remained constructive, supporting further price appreciation across both large-cap and select altcoins. Total crypto market capitalization was increased by 3.7% adding total $91B to the market cap. Daily trading volumes were doubled, moving around $307B, from last week's $155B. Total market capitalization since the beginning of this year currently stands in a negative territory of -13%, with a total outflow of -$396B.
BTC and ETH once again led the market higher. Bitcoin advanced 4.4% on a weekly basis, while Ethereum posted a slightly stronger 4.7% w/w gain, maintaining the positive trend among the largest cryptocurrencies. XRP stood out among majors with a 6.5% increase, while BNB gained 3.2%. Solana and Tron also moved higher, rising 2.5% and 3.3% respectively, confirming broad market strength.
Strongest performers among other altcoins were THETA delivering an exceptional 36.2% weekly surge, clearly leading the market. OMG Network also posted a significant gain of 20.0%, while Stellar advanced 10.5%. On the negative side, DASH experienced the most pronounced correction, falling 22.9% w/w after the previous week’s strong rally. Zcash also declined notably by 13.3%, indicating a pullback in previously outperforming assets. Other declines were limited, with most of the market remaining in positive territory.
Several tokens delivered exceptional performance this week. RaveDAO led with a remarkable 447% weekly surge, followed by DeXe with a 46.7% increase, while EdgeX and MemeCore posted strong gains of 36.7% and 36.3% respectively, highlighting continued speculative interest in select segments of the market, mostly related to the connection between AI and blockchain.
Circulating supply dynamics showed some more visible changes this week. IOTA recorded a 0.5% increase, Stellar expanded supply by 0.2%, alongside Solana and Filecoin, which also posted 0.2% growth. XRP saw a 0.3% increase, while several other assets, including DOGE, Cardano, DASH and Zcash, recorded 0.1% increases. On the downside, BNB registered a notable 1.2% decrease in circulating supply, while Hyperliquid continued to show a slight 0.2% decline. Overall, supply changes were somewhat more pronounced this week but remained secondary to price-driven market dynamics.
CRYPTO FUTURES MARKET
Bitcoin futures extended their upward momentum this week, building on the prior strong recovery with another leg higher across the curve. The April 2026 maturity increased by 5.60% w/w, settling at $77,600. Gains were broadly consistent across maturities, ranging between 5.51% and 6.05%, with slightly stronger performance observed in the longer-dated segment of the curve. The March 2027 maturity recorded the largest increase at 6.05%, while the December 2027 contract closed at $84,780, up 5.67% on the week. The continued parallel upward shift reflects sustained positive sentiment and ongoing demand for Bitcoin futures exposure.
Ether futures once again outperformed Bitcoin, posting stronger gains across the entire term structure. The April 2026 contract settled at $2,434, rising 7.70% w/w. Weekly gains ranged from 7.65% to 8.54%, with the December 2026 maturity recording the strongest increase at 8.54%. Longer-dated contracts also advanced solidly, with the December 2027 maturity closing at $2,679, up 7.68% on the week.
Overall, the week was characterized by a continuation of the bullish trend in crypto futures markets, with both Bitcoin and Ether recording consecutive weekly gains. Ether maintained its relative outperformance, highlighting stronger momentum in that segment. The persistence of contango across both curves indicates that market participants continue to price higher valuations further along the forward curve, while the consistent gains across maturities suggest a broad-based improvement in sentiment rather than isolated positioning shifts.
Larkstons: $1.4T Stock Surge – Crypto Liquidity Rotation IncominApril 2026 — Global equity markets have just experienced a massive $1.4 trillion surge in market capitalization in a single week, driven by strong corporate earnings, easing macroeconomic concerns, and renewed investor optimism. According to analysts at Larkstons, this powerful stock market rally may soon trigger a significant liquidity rotation into cryptocurrencies as capital seeks higher-yield opportunities in risk assets.
What the $1.4 Trillion Stock Surge Means
The recent $1.4 trillion increase in global stock market value reflects broad-based buying across major indices. Technology, financial, and cyclical sectors led the gains, fueled by better-than-expected earnings reports and signs of stabilizing inflation.
However, history shows that such sharp rallies in traditional markets often precede capital rotation. When equities become relatively expensive or reach short-term saturation, sophisticated investors frequently reallocate portions of their profits into alternative assets — with cryptocurrencies historically being one of the primary beneficiaries.
Key signals pointing to an incoming crypto liquidity rotation include:
Profit-taking in stocks: Many institutional portfolios are now sitting on substantial unrealized gains.
Elevated equity valuations: Certain sectors are trading at premium multiples, prompting diversification.
Strong crypto fundamentals: Bitcoin ETFs continue to see steady inflows, Ethereum is showing robust user growth, and Layer-2 solutions are driving real adoption.
Improving risk appetite: As macroeconomic uncertainty eases, investors become more comfortable increasing exposure to higher-beta assets like crypto.
Why Liquidity Rotation into Crypto Could Be Significant
A potential rotation of even a small percentage of the $1.4 trillion stock surge could have an outsized impact on the cryptocurrency market due to its relatively smaller size compared to traditional equities.
This scenario could lead to:
Increased inflows into Bitcoin and Ethereum ETFs.
Stronger performance of major cryptocurrencies and altcoins.
Higher on-chain activity and DeFi TVL growth.
Renewed developer and institutional interest in blockchain projects.
At Larkstons, we believe this potential liquidity shift represents one of the most important macro setups for crypto in 2026. Capital tends to flow from “safe” or “expensive” assets toward “undervalued” or “high-conviction” growth assets once risk sentiment improves.
Outlook and Risk Considerations: Insights from Larkstons Experts
While the setup for a crypto liquidity rotation looks promising, several factors will determine its strength and timing:
Continued strength or reversal in equity markets.
Federal Reserve and global central bank policy decisions on interest rates.
Regulatory developments affecting digital assets.
Bitcoin halving cycle dynamics and upcoming network upgrades.
Experts at Larkstons recommend that investors prepare strategically:
Maintain a balanced portfolio with both traditional and digital assets.
Monitor ETF flows, on-chain metrics, and cross-asset correlations.
Use disciplined risk management and avoid over-leveraging during periods of high volatility.
Conclusion
The $1.4 trillion stock market surge may mark the beginning of a meaningful liquidity rotation toward cryptocurrencies. As capital seeks fresh opportunities beyond traditional equities, the crypto market stands ready to benefit from renewed institutional and retail interest.
Larkstons continues to provide professional analysis and investment solutions at the intersection of traditional finance and digital assets. We help our clients navigate these macro shifts with data-driven insights and disciplined strategies.
We remain optimistic that 2026 could see cryptocurrencies play an even larger role in diversified global portfolios.
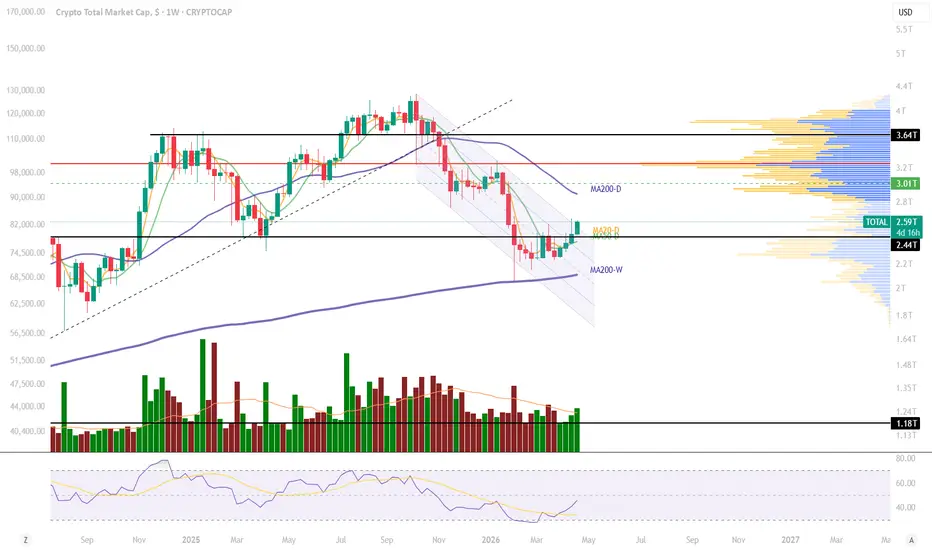
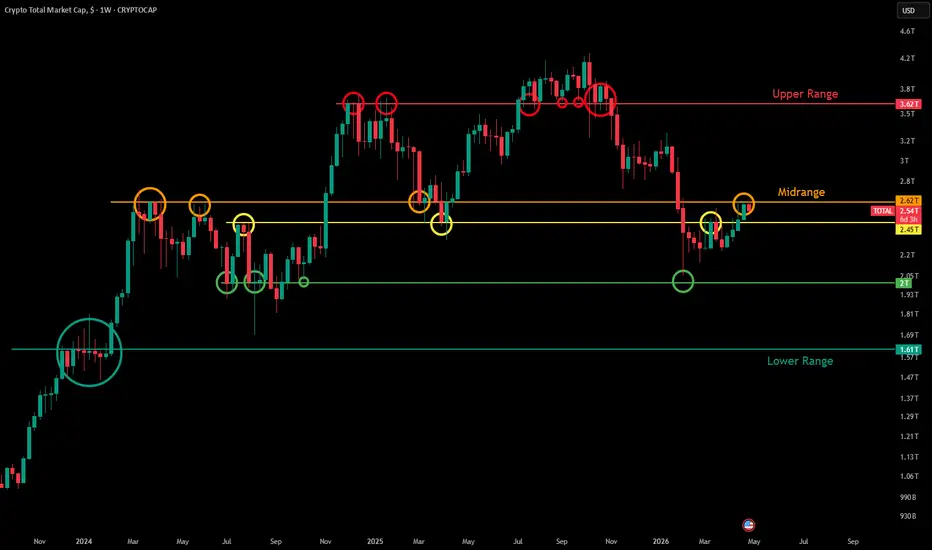
TOTAL - Understanding Significant Marketcap ValuesIn this post I want to break down the total cryptocurrency marketcap and the key levels that have developed over this past cycle. So far these levels have had significant confluence with Bitcoin's price action and will continue to do so going forward. Let's break down everything I have outlined in this chart.
To begin you must understand that this is on the weekly timeframe. This is important when considering the significance of these levels, as the most meaningful data points come from weekly settlement levels, specifically the weekly candle closes we see for TOTAL. The other thing to note is the bigger the circle on the chart, the more powerful the move off that key level was.
Upper Range $3.62 Trillion (Red Ray)
This became the first significant weekly settlement level when price created a weekly reversal from it in December 2024. The market cap had been in a strong uptrend, followed by a dragonfly doji, then a reversal to the downside with weekly candle bodies closing at $3.62T.
In January 2025, TOTAL wicked to that level a couple of times as continued resistance before falling again. Once marketcap broke above that weekly resistance level in July 2025 it established it as new weekly support, confirmed by candle body closes in August 2025. Then in September and October the marketcap continued to hold that key level as support. Once TOTAL closed below it in November 2025 the crypto bear market began and the upper range has not been tested since.
Midrange $2.62 Trillion (Orange Ray)
This is the current stage of the bear market that TOTAL has found itself in and is the most important level to examine in the present day. Today is April 27, 2026 and yesterday's weekly candle close solidified yet another significant market cap level at $2.62 Trillion.
What is fascinating about this level is that it sits exactly $1 Trillion below the upper range and is probably the most important level the entire cryptocurrency market cap is facing this cycle.
Looking back to March 2024 you can see why. This level marked the top of the March 2024 rally when BTC created a new all time high around $74,000. Even with BTC's recent push above $74,000, the total cryptocurrency market cap is still failing at the March 2024 highs because altcoins are significantly weaker than Bitcoin at this point in time.
Through March and April 2024 it continued to hold that level as resistance. Then in May and June the marketcap reached those levels again before creating wick highs and getting rejected once more. TOTAL then broke above in November 2024 during the election and the $2.62T level was not seen again until March 2025, exactly one year after it was first established.
This is where it gets really important. Looking at the four weekly candles from March 3, 2025 to March 24, 2025, all played a significant role with that orange level.
Now fast forward to current day. Yesterday's weekly candle closed at $2.60T with a high of $2.63T, right at the orange ray. This is significant because since Sunday's close the total cryptocurrency market cap has already erased over $60 Billion, showing a clear rejection from this extremely key market cap level. This could very well end up being the high before a drop back toward $2 Trillion.
$2.45 Trillion (Yellow Ray)
This was the last high in July 2024 before the major drop occurred. It was also the April 2025 low before the rally to all time highs began. Most recently it marked the top of the March 2026 rally with a weekly close at the level as resistance before the weekly double bottom was created.
So looking at current price action, the yellow ray marked a major weekly top in March 2026 and we are now likely seeing a major weekly top form for April 2026 at the orange ray.
$2 Trillion (Green Ray)
If a top is indeed forming for the total cryptocurrency market cap, the next level to watch is $2 Trillion. This should act as a major support zone and has already helped create the major low in February 2026 when BTC dropped to $60,000.
This level represented the weekly candle body lows in July and August 2024, and the weekly only had one false close below it before rallying to new all time highs, establishing the $2T level as major support. Even during the February 2026 crash the marketcap got close to $2T, finding a low at $2.05T before rallying significantly toward the midrange where it currently sits. Expect a local low to form around this $2T level.
Bottom Range $1.61 Trillion (Teal Ray)
This is the final level worth examining and the one that could mark the bear market bottom for TOTAL.
Are you starting to see the pattern? $1.61T, $2.62T, $3.62T, all significant levels and each approximately $1 Trillion apart.
This level marked many weekly candle body closes from December 2023 all the way through the breakout above in February 2024. Even during the August 2024 crash the total market cap almost reached that level but was slightly front-run, creating a low at $1.69T. Either way, the $1.61T level is likely to play a very significant role at the bottom of this cryptocurrency cycle if TOTAL loses the $2T level.
If you found value from this post you would also likely find value from my analysis on TOTAL2 and TOTAL3 bear market targets:
$1.2B Crypto Inflows Signal Rising Bitcoin and Ethereum DemandThe crypto market just delivered another strong signal of confidence. Digital asset inflows crossed $1.2 billion last week, marking the fourth consecutive week of gains. This trend shows investors are not stepping back. Instead, they are increasing exposure across major assets and related financial products. Momentum continues to build as total assets under management reached $155 billion. This rise reflects growing trust in the market structure and long-term potential. Large investors are not just watching anymore. They are actively allocating capital, and the pace is accelerating. What stands out even more is the consistency of these inflows. Digital asset inflows have not relied on one-off spikes. They have built steadily over multiple weeks. This pattern often signals a stronger underlying trend rather than short-term speculation. At the center of this movement, Bitcoin and Ethereum continue to dominate. Alongside them, blockchain-related equities are also attracting strong interest. Let’s break down what is driving this surge.
Bitcoin Dominates As Institutional Money Flows In
Bitcoin once again captured the largest share of capital. It recorded $933 million in inflows last week alone. This massive contribution highlights growing Bitcoin investment demand from institutional players.
Investors continue to treat Bitcoin as the primary entry point into crypto markets. It offers liquidity, brand recognition, and increasing regulatory clarity. These factors make it a preferred choice for large funds.
The steady rise in Bitcoin investment demand also reflects macro confidence. Many investors see Bitcoin as a hedge against uncertainty. At the same time, ETF-driven access has made it easier to allocate capital.
Digital asset inflows into Bitcoin now show a clear pattern. Institutions are not timing the market. They are building positions gradually over time.
Article image
Ethereum Strength Holds With Consistent Inflows
Ethereum continues to strengthen its position with sustained capital inflows. Last week, it recorded $192 million, marking the third straight week above $190 million. This consistency shows strong Ethereum inflows across multiple cycles.
Investors increasingly recognize Ethereum’s role beyond just a cryptocurrency. It powers decentralized applications, smart contracts, and token ecosystems. This utility attracts long-term capital.
Ethereum inflows also reflect growing confidence in network upgrades and scalability improvements. These developments improve efficiency and attract more usage.
Digital asset inflows into Ethereum now signal more than short-term interest. They show structural demand building across the ecosystem.
Blockchain Equity ETFs See Strong Momentum
While cryptocurrencies gained attention, blockchain equity ETFs also experienced strong demand. These products recorded $617 million in inflows over the past three weeks. This surge highlights rising blockchain ETF growth alongside direct crypto investments. Investors want exposure to companies building the infrastructure behind digital assets.
Blockchain ETF growth offers a different risk profile. It allows investors to participate without holding cryptocurrencies directly. This approach appeals to more conservative institutions. Digital asset inflows combined with blockchain ETF growth show a broader trend. Investors are not just buying assets. They are investing in the entire ecosystem.
Final Thoughts on Bitcoin and Ethereum
The latest data confirms a powerful trend. Digital asset inflows continue to rise, driven by institutional confidence and expanding access. Bitcoin leads the charge, while Ethereum and blockchain equities follow closely.
This combination creates a strong foundation for sustained growth. Markets now depend less on speculation and more on structured investment flows.
If this momentum continues, the crypto market could enter a more stable and mature phase. Investors are no longer testing the waters. They are building long-term exposure.

Richmond365 Finance Limited Boosts Crypto Trading Amid BaFinThe cryptocurrency market continues to play an increasingly important role in the global financial system. Amid growing regulatory attention from authorities such as BaFin, companies are not only focusing on technological innovation but also on building user trust. In this context, Richmond365 Finance Limited positions crypto trading as a core direction of its strategic development.
Despite increased scrutiny, interest in digital assets continues to grow. This creates new opportunities for companies willing to invest in technology and enhance user experience.
Focus on Cryptocurrency Markets
Richmond365 Finance Limited активно expands its presence in cryptocurrency markets by providing clients with access to a wide range of digital assets. This enables users to diversify their investment strategies and engage with modern financial instruments.
Cryptocurrencies are no longer viewed as niche assets but as an integral part of diversified portfolios. That is why the company continues to broaden its asset offering and improve trading conditions.
Use of Modern Technologies
Technology is at the core of successful crypto trading. Richmond365 Finance Limited implements advanced solutions aimed at improving data processing speed, platform stability, and overall usability.
This includes:
optimization of trading processes
enhanced interface design
integration of analytical tools
These technologies allow users to respond more quickly to market changes and make more informed decisions.
Expanding Opportunities for Traders
Effective trading requires more than just market access — it demands functionality and flexibility. Richmond365 Finance Limited works to expand trading opportunities by offering tools suitable for both beginners and experienced users.
Key areas include:
development of analytical tools
customizable trading strategies
improved user experience
This approach allows traders to tailor their activity according to their goals and level of expertise.
Ease of Working with Digital Assets
User convenience is a major priority. Working with cryptocurrencies should be clear, intuitive, and accessible.
Richmond365 Finance Limited focuses on:
simple and intuitive interface
accessibility of key features
stable platform performance
This is particularly important for users who are new to the crypto market.
Platform Development
The cryptocurrency market evolves rapidly, and companies must adapt. Richmond365 Finance Limited continuously develops its platform by introducing new features and improving existing solutions.
This includes:
upgrading technical infrastructure
expanding platform functionality
adapting to market requirements
Such an approach helps the company remain competitive and aligned with user expectations.
The Role of Regulation and BaFin Attention
Increased oversight from BaFin reflects a broader trend toward greater transparency in the financial sector. For companies, this means aligning with market standards and improving internal processes.
Richmond365 Finance Limited views these developments as part of the natural evolution of the industry and aims to adapt accordingly.
Conclusion
Crypto trading remains a key growth area for Richmond365 Finance Limited. The company focuses on technology, usability, and platform development, forming a solid foundation for growth in the digital financial environment.
In a landscape shaped by increasing interest in digital assets and stronger regulatory oversight, this approach supports long-term sustainability and market relevance.

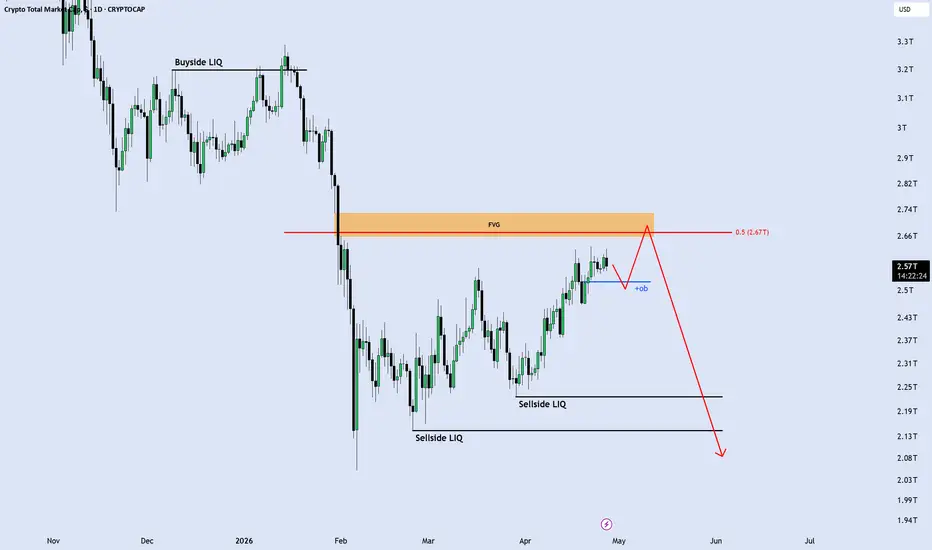
TOTAL: Liquidity Sweep Expected at $2.67T Before the Next Leg Do
Crypto Total Market Cap (TOTAL) - Daily Outlook 🌐
To understand where Altcoins are headed, we must look at the big picture. The Total Market Cap is currently showing a very technical setup on the Daily timeframe:
1. The Equilibrium Test (0.5 Level): Price is approaching the 50% retracement ($2.67T) of the previous major drop. This level aligns perfectly with a significant Daily Fair Value Gap (FVG).
2. Order Block (+OB) Support: We recently saw a bounce from the bullish Order Block (blue line). However, this looks like a corrective move to fill internal liquidity before a larger reversal.
3. Bearish Bias: The expected path (red arrow) suggests a sweep of the FVG followed by a rejection. The ultimate targets are the Sellside Liquidity (SSL) pools resting at $2.22T and $2.12T.
4. Market Sentiment : Unless we see a strong daily close above the $2.7T resistance, the overall structure remains bearish, and caution is advised for long positions on Alts.
Key takeaway: Watch for a "Stop Hunt" in the orange zone before the potential flush.
Coinbase Launches Crypto-Backed USDC Loans in the UKCoinbase has launched crypto-backed loan services in the United Kingdom. Users can now borrow USDC using their crypto holdings as collateral. The new feature allows users to borrow against Bitcoin and Ethereum in under a minute.
This means they can access cash without selling their assets. The move marks another step in Coinbase’s push to expand its financial services globally.
Borrow Without Selling Crypto
The main idea is simple. Users can unlock value from their crypto without giving it up. Instead of selling Bitcoin or Ethereum, they can use it as collateral. Once the loan is approved, USDC is sent instantly to the user’s account. From there, they can send it globally for free or convert it into cash. This makes it easier to handle expenses while still holding long-term investments. For many users, this balance is important.
Powered by Onchain Lending
The loan system runs through Morpho, an onchain lending protocol. It works on Base, Coinbase’s blockchain network. Because of this setup, the process is fast and automated. Interest rates adjust in real time based on market conditions. Users can also track their loan health directly in the app. At launch, the service supports BTC, ETH, and cbETH as collateral. Coinbase may add more assets over time.
UK Expansion Builds on US Success
This launch follows Coinbase’s earlier rollout in the United States. Since then, demand has grown quickly. Reports show billions in loan activity already processed. Now, the company is expanding to the UK. It aims to become a full financial platform, not just a trading app. The UK has been a key market for Coinbase. Recent updates include savings products and new trading features. This loan service adds another layer to its offering.
What This Means for Users
Crypto backed loans are becoming more popular. They give users flexibility and access to funds without selling assets. But they also come with risks. If the value of collateral drops too much, liquidation can happen. That means users need to monitor their positions closely. Still, the feature shows how crypto is moving toward everyday finance. Users can now borrow, spend, and manage funds in one place.
For now, Coinbase’s UK launch signals growing adoption. As more users explore these tools, crypto-backed finance may become more common. In the coming months, Coinbase plans to expand this service further. More countries and assets could follow soon.

Mass Liquidations in Crypto Markets — Analysis by Mirix GroupThe cryptocurrency market is known for its high volatility, but in recent years, particular attention has been drawn to mass liquidations, especially in the derivatives market. Sharp price movements can trigger a chain reaction where leveraged positions are forcibly closed, accelerating further declines. At Mirix Group, we observe that these cascading processes have become a key element of market dynamics, driving sharp and often unpredictable movements that affect both short-term strategies and overall risk perception.
Cascade of Liquidations in Futures Markets
One of the defining features of the crypto market is the high level of futures trading using leverage. In such conditions, even small price movements can lead to forced liquidations. At Mirix Group, we note that once certain price levels are reached, a chain reaction is triggered.
When the first positions are liquidated, additional selling pressure is introduced, pushing prices further down and triggering more liquidations.
This creates a cascading effect where the market accelerates in one direction, amplifying volatility and increasing the scale of the decline.
Impact of Leverage
Leverage is one of the primary factors amplifying liquidations. It allows traders to open positions larger than their actual capital but significantly increases risk. At Mirix Group, we observe that high leverage makes the market more vulnerable to sudden movements.
Even minor price changes can result in forced position closures.
This creates an acceleration effect, where liquidations occur rapidly and simultaneously, intensifying market pressure.
Amplification of Price Declines
Liquidations themselves become a driving force behind falling prices. When positions are forcibly closed, they are executed through market orders, increasing supply. At Mirix Group, we note that this adds further downward pressure on prices.
The more liquidations occur, the stronger the decline becomes.
This creates a feedback loop in which falling prices trigger liquidations, and liquidations further accelerate price drops, resulting in sharp and deep market movements.
Behavior of Retail Traders
Retail traders play a significant role in liquidation events, largely due to their widespread use of leverage. At Mirix Group, we observe that their behavior is often driven by emotions and short-term expectations.
During market downturns, many retail traders panic and close positions, while others take on additional risk in an attempt to recover losses.
This amplifies market instability and strengthens the domino effect, especially during periods of heightened volatility.
Role of Large Players in Market Movements
Large market participants also have a significant influence on liquidation dynamics. With substantial capital, they can strategically interact with market liquidity. At Mirix Group, we observe that in some cases, large players may contribute to price movements that push the market toward key liquidation levels.
This allows them to create favorable conditions for entering or exiting positions.
As a result, the actions of major participants can intensify cascading movements and increase the scale of liquidations.
Conclusion: Mass liquidations in the cryptocurrency market have become one of the key drivers of its dynamics. Cascading processes, amplified by leverage and participant behavior, lead to sharp and deep price movements. At Mirix Group, we believe that understanding liquidation mechanisms is essential for successful trading. In a highly volatile environment, investors must prioritize risk management and account for the impact of liquidations to minimize losses and effectively capitalize on emerging opportunities.

Why Traders Are Moving into Wait-and-See Mode — Analysis by GetlModern financial markets are increasingly experiencing periods where a large share of participants adopt a wait-and-see approach. This is driven by high uncertainty, conflicting economic signals, and anticipation of key decisions from regulators. In such conditions, traders prefer to reduce activity to avoid unnecessary risks. At Getliquid24, we observe that this shift into a waiting phase significantly affects liquidity, price dynamics, and overall market behavior, creating a structure that differs from traditional trend-driven environments.
Decline in Trading Volumes
One of the most noticeable consequences of traders shifting into wait-and-see mode is a decline in trading volumes. When market participants lack confidence in the direction of future price movements, they tend to refrain from active trading. At Getliquid24, we note that this leads to reduced liquidity and fewer large transactions.
Lower volumes make markets more sensitive to individual orders, as the balance between supply and demand becomes less stable. Even relatively small trades can cause significant price fluctuations.
Additionally, reduced participation from institutional players amplifies this effect, as they typically provide stability. As a result, the market becomes less predictable and more prone to sudden movements.
Lack of Clear Trends
During periods of waiting, markets often lose directional clarity, leading to the absence of strong trends. Prices tend to move within narrow ranges, forming sideways patterns. At Getliquid24, we observe that this is caused by uncertainty and the lack of strong market drivers.
Attempts to establish trends frequently fail due to insufficient support from major participants.
This creates challenging conditions for traders, as traditional trend-following strategies become less effective. Consequently, short-term and range-based approaches gain importance.
Waiting for Macroeconomic Data
A key reason for this waiting behavior is the anticipation of major macroeconomic data releases. Interest rate decisions, inflation reports, and labor market data have a strong impact on financial markets. At Getliquid24, we note that trading activity often declines sharply ahead of such announcements.
Investors avoid opening new positions to reduce exposure to unexpected outcomes.
This creates a temporary pause in market activity, which typically lasts until new data is released. Once published, the information is quickly priced in, often triggering strong market reactions.
Sharp Movements After News Releases
The waiting phase is usually followed by periods of heightened activity once new information becomes available. When uncertainty is resolved, markets tend to react quickly and often aggressively. At Getliquid24, we observe that such movements are becoming increasingly pronounced.
Low liquidity prior to news releases amplifies the effect, as a large number of participants re-enter the market simultaneously.
This results in sharp price spikes, increased volatility, and the emergence of short-term trading opportunities. However, these movements also carry higher risks and require careful risk management.
Changes in Market Participant Behavior
The shift into wait-and-see mode is accompanied by changes in market behavior. Traders become more cautious, reduce exposure, and focus more on risk management. At Getliquid24, we observe a growing preference for short-term strategies.
Market participants aim to secure profits quickly and avoid holding positions for extended periods.
At the same time, the importance of news analysis and macroeconomic monitoring increases, making markets more sensitive to incoming information. These behavioral changes contribute to higher volatility and reduced predictability.
Conclusion: The widespread shift of traders into wait-and-see mode has a significant impact on financial markets, leading to lower trading volumes, weaker trends, and a stronger dependence on news and macroeconomic factors. In such conditions, markets become less predictable but also create opportunities for sharp movements and short-term trading. At Getliquid24, we believe that understanding this phase allows investors to better adapt, manage risks effectively, and take advantage of emerging market opportunities.

OneCoin Fraud Victims Can Now Claim CompensationThe U.S. Justice Department has finally moved forward with a long-awaited step. It has launched the OneCoin compensation process for victims of the massive crypto fraud. This decision brings hope to thousands of investors who lost money in one of the largest scams in crypto history. Authorities now want to return recovered funds to affected individuals through a structured claims system.
Many victims waited years for justice after the collapse of the OneCoin scheme. The new process signals a turning point in crypto fraud recovery efforts. Officials aim to ensure fair distribution of funds while maintaining transparency. This initiative also reflects growing pressure on regulators to protect investors in digital asset markets.
The OneCoin compensation process does not only focus on refunds. It also sets a precedent for handling large-scale financial crimes in crypto. Victims now have a clear path to file claims and recover part of their losses. The Justice Department claims system offers structured guidance for those affected by this global fraud.
What Makes The OneCoin Case One Of The Largest Crypto Scams
The OneCoin scheme attracted millions of investors worldwide with promises of high returns. It marketed itself as a revolutionary cryptocurrency but lacked real blockchain technology. This made the project fundamentally flawed and deceptive from the start.
Authorities estimate that the scam collected over $4 billion from investors. Many OneCoin fraud victims invested their life savings, expecting exponential gains. The scheme used aggressive marketing and referral incentives to expand rapidly. This structure resembled a pyramid system, which eventually collapsed.
Global investigations exposed the fraudulent nature of the operation. Law enforcement agencies worked together to track funds and identify key figures. The case highlighted serious gaps in early crypto regulations and investor awareness.
How The OneCoin Compensation Process Will Work
The Justice Department claims system provides a clear framework for victims. Eligible individuals must submit claims with proof of their investments. Authorities will review each submission carefully before approving payouts.
The OneCoin compensation process relies on recovered funds from seized assets. Officials will distribute these funds proportionally among verified claimants. This means victims may not recover full losses but will receive partial compensation.
Applicants must follow strict guidelines during submission. They need to provide transaction records, account details, and identity verification. The Justice Department claims platform aims to simplify this process for users worldwide.
Why This Move Matters For Crypto Fraud Recovery
The launch of this program marks a significant step in global crypto regulation. Governments now recognize the need to address large-scale fraud cases effectively. The OneCoin compensation process sets a benchmark for future recovery efforts.
Crypto fraud recovery remains a complex challenge due to the nature of digital assets. Transactions often cross borders and involve anonymous accounts. This makes tracking and recovering funds difficult.
The Justice Department claims initiative shows that recovery is still possible. It sends a strong message to fraudsters and reassures investors. Authorities continue to develop tools and frameworks to handle similar cases.
Final Thoughts On The OneCoin Compensation Effort
The launch of the OneCoin compensation process offers long-awaited relief for victims. It provides a structured and transparent way to recover losses. While challenges remain, the initiative marks real progress in crypto fraud recovery.
Victims now have a chance to reclaim part of their investments. The Justice Department claims system ensures fairness and accountability. This effort also strengthens trust in regulatory actions within the crypto market.
As the process unfolds, it will likely influence how authorities handle future scams. It sends a clear signal that large-scale fraud will not go unanswered.

CTSI Price Soars 17.57%: Institutional Interest Ramps UpAmid a wave of selling pressure across the crypto market, CTSI has defied the trend by surging 17.57% in just 60 minutes. The current price sits at $0.03626, a notable increase from $0.03084. This sudden spike comes as trading volume reached approximately $2,952,148.87, highlighting significant market activity.
Market Snapshot
The cryptocurrency is currently trading at $0.03626 after hitting a 24-hour high of $0.03659 and a low of $0.02863. Over the last 24 hours, CTSI has experienced a substantial percentage change of 23.67%, reflecting a strong bullish momentum. Daily trading volume has reached $2,952,148.87, indicating heightened participation, while the market capitalization stands at $32,310,786.
What Could Be Behind This Move
Broader Market Trends
Currently, the broader cryptocurrency market exhibits mixed signals, with many major assets displaying varying momentum. Analysts suggest that the recent interest from institutional investors in altcoins may have contributed to CTSI’s remarkable price surge. As traditional markets fluctuate, digital assets like Cartesi are gaining traction, attracting traders looking for opportunities amidst uncertainty.
Trading Activity
Increased trading activity is evident in the recent price movements of CTSI. Market observers note that the sudden rise coincides with a shift in sentiment, as traders react to the potential for higher returns in the altcoin sector. Whale activity appears to have played a role, with significant accumulation likely influencing the price spike. Additionally, the general bullish sentiment surrounding cryptocurrencies may be leading to a rotation towards promising projects like Cartesi, further fueling the rally.
What Traders Are Watching Next
Looking ahead, traders are closely monitoring key support and resistance levels for CTSI. The next resistance sits at approximately $0.037, while support is seen near $0.030. A break above this level could lead to further bullish momentum, while a drop below may signal caution. Market participants are also keeping an eye on broader trends in Bitcoin and Ethereum, as their movements often influence altcoin price dynamics.
This article is for informational purposes only and does not constitute financial advice. Readers should conduct their own research and consult a financial advisor before making investment decisions.

MARKETS week ahead: April 12 – 18Last week in the news
Markets showed some sentiment positivity last week, amid potential ceasefire in the Middle East, however the macro environment remains mixed, with inflation still above target levels, elevated bond yields, and slowing economic growth continuing to weigh on the outlook. Rising energy prices and ongoing geopolitical tensions are further increasing uncertainty, impacting both inflation expectations and overall market volatility. The US equity markets managed to erase some of the losses gained in March, with the S&P 500 closing the week at 6.816. Gold was traded in a mixed manner, supported by a drop in value of the US Dollar, closing the week at $4.746. The US 10Y benchmark continues to be traded in a volatile manner, currently without a clear trend. This week yields are closing at 4, 31% after they reached lower grounds. The crypto market shows some signs of modest recovery, with BTC closing this week above the $73K.
The latest U.S. macro data painted a mixed but broadly steady inflation picture, reinforcing expectations that the Federal Reserve will maintain a “higher for longer” interest rate stance. The Fed’s preferred inflation gauge, the PCE Price Index, rose by 0.4% m/m in February and 2.8% y/y, with core PCE also increasing 0.4%, both in line with expectations. At the same period, personal income declined slightly by 0.1% m/m, while personal spending rose 0.5% m/m, indicating that consumption remains resilient despite softer income growth. The final Q4 GDP growth rate came in at 0.5% q/q, slightly below expectations, pointing to a gradual cooling in economic momentum. More recent inflation data for March showed a 0.9% monthly increase and 3.3% y/y, while core inflation stood at 0.2% m/m and 2.6% y/y, all broadly in line with forecasts, suggesting inflation is moderating but still above target levels. Overall, while inflation is gradually easing, the combination of ongoing elevated price levels, softening growth, and cautious consumers is keeping the Fed in a position where interest rates are expected to remain higher for longer than previously anticipated.
Palantir Technologies was in focus this week as its shares experienced a significant drop of around 22%, driven by a combination of AI-sector competition concerns and broader software industry weakness, including fears that emerging AI models could challenge parts of its business model. Stocks remained pressured even after the US President praised the company for its defense related capabilities. However, a well-known investor Michael Burry reiterated his bearish stance on Palantir, confirming that he is still holding long-dated put options against the stock.
U.S. Treasury Secretary Scott Bessent, together with Federal Reserve Chair Jerome Powell, recently convened a meeting with executives from major U.S. banks, including JPMorgan, Bank of America, Citigroup, Goldman Sachs, Morgan Stanley, and Wells Fargo, to discuss elevated cyber security risks facing the financial system. Overall, the initiative reflects rising regulatory concern that AI-enabled cyber risks could pose a systemic threat to financial stability, prompting closer coordination between the Treasury, the Federal Reserve, and large U.S. lenders.
CRYPTO MARKET
The overall sentiment at the crypto market was a bit improved during the previous week in line with a drop in oil prices, implying potentially lower inflation in the coming period. Total crypto market capitalization was increased by 7% w/w, adding $160B to total crypto market cap. Daily trading volumes were also increased, moving around $155B on a daily basis. Total market capitalization since the beginning of this year currently stands in a negative territory of -17%, with a total outflow of -$487B.
A rebound week is behind the crypto market, with broad-based gains across both major assets and altcoins. Renewed risk appetite and improved sentiment drove a notable upside move, with several assets posting significant double-digit returns and reversing the weakness seen in previous periods.
BTC and ETH once again led the market higher. Bitcoin surged 8.5% on a weekly basis, while Ethereum outperformed slightly with a 9.3% w/w gain, confirming a clear return of bullish momentum among the largest cryptocurrencies. XRP also moved higher with a 2.6% increase, while BNB gained 2.3%. Solana advanced 5.2%, and Avalanche added 4.4%, supporting the broadly positive market environment.
Among the standout performers, DASH delivered an exceptional 51.0% weekly surge, making it the strongest performer among major altcoins. Zcash followed closely with a 49.3% gain, while Hyperliquid advanced 16.8%. Additional strong performances were recorded by DOGE (+11.5%), SUI (+8.8%), Filecoin (+8.0%) and THETA (+8.1%), highlighting widespread upside momentum across the altcoin segment. One coin should be specially mentioned as the best weekly performer, which is RaveDAO, who stood out with an extraordinary 748% weekly surge.
On the negative side, only a limited number of assets finished the week in red. Algorand recorded the largest decline, falling 9.1% w/w, while POL (prev MATIC) dropped 7.8% and IOTA declined 7.1%. Stellar also moved lower by 4.3%, indicating that downside pressure was relatively contained compared to previous weeks.
Circulating supply changes remained moderate overall. Uniswap and Filecoin recorded the largest increases in supply at 0.7% and 0.3% respectively, while Solana also expanded supply by 0.3%. XRP, Cardano, Stellar, Zcash, POL and Algorand each saw 0.1% increases. Overall, supply-side dynamics remained stable and did not materially impact the strong price-driven rally observed during the week.
CRYPTO FUTURES MARKET
Bitcoin futures recorded a strong upward move this week, extending the recovery phase with broad-based gains across the curve. The April 2026 maturity increased by 9.46% w/w, settling at $73,485. Across the term structure, weekly gains ranged between 8.94% and 9.46%, reflecting a nearly parallel upward shift. Longer-dated maturities also advanced significantly, with the December 2027 contract closing at $80,230, up 9.36% on the week.
Ether futures also posted strong gains, broadly in line with Bitcoin, though with slightly higher variability across maturities. The April 2026 contract settled at $2,260, rising 8.81% w/w. Weekly increases ranged from 8.72% to 9.73%, with the June 2026 maturity recording the strongest gain. Longer-dated futures remained well supported, with the December 2027 maturity closing at $2,488, up 9.60% on the week.
Overall, the week was characterized by a robust recovery across crypto futures markets, with both Bitcoin and Ether curves shifting higher in a synchronized manner. The magnitude and consistency of gains across maturities point to a clear rebound in market sentiment, supported by renewed buying interest and a re-engagement of participants across the curve. Despite the sharp advance, both futures curves remain in contango, indicating that longer-term expectations continue to be priced at a premium relative to near-term levels.

Grayscale Releases Q2 2026 Crypto Assets ListGrayscale Investments has published its latest “Assets Under Consideration” list for Q2 2026, offering insight into which cryptocurrencies the firm is currently evaluating. This list acts as a shortlist of potential candidates for future investment products, making it an important signal for the broader market.Among the notable names included are Celo, Mantle, Toncoin, TRON, Ethena, and Jupiter.
What “Under Consideration” Really Means
It’s important to understand that being listed does not guarantee inclusion in a future product. Instead, it means Grayscale Investments is actively researching these assets based on factors such as market demand, liquidity, regulatory clarity, and underlying technology. However, the list still carries weight. Grayscale is one of the largest institutional players in crypto, and its interest alone can draw attention.
Institutional Trends and Market Implications
The diversity of this watchlist highlights a bigger trend: institutional interest is expanding beyond just Bitcoin and Ethereum. Sectors like DeFi, smart contract platforms, and emerging financial primitives are gaining traction among large asset managers.
This reflects a maturing market where capital is beginning to diversify across multiple narratives rather than concentrating on a few dominant assets. For investors, such lists serve as early indicators of where institutional attention—and potentially future capital—might flow.
While nothing is confirmed, Grayscale’s watchlist offers a valuable glimpse into the next phase of crypto adoption. It’s less about immediate impact and more about identifying the direction in which the market is evolving.

Crypto market to $10T by 2028The crypto market will rise to a total valuation of $10T by 2028. It's now consolidating on the quinquennial pivot point and monthly MA50.

TOTAL MARKET CAP BREAK OUT
'We’re gonna win so much, you may even get tired of winning. And you’ll say, ‘Please, please. It’s too much winning. We can’t take it anymore, Mr. President, it’s too much.’ And I’ll say, ‘No it isn’t. We have to keep winning. We have to win more!’ -DJTR

April Market Analysis Request Limited SlotsThis month’s analysis will cover all financial markets, not just crypto. Focus remains strictly on technical structure, liquidity zones, and high-probability scenarios across:
• Crypto (BTC, Altcoins)
• Forex (Major & Minor pairs)
• Indices (NASDAQ, S&P 500, etc.)
• Commodities (Gold, Oil, etc.)
🔹 Only 30 assets will be selected
🔹 Deadline: April 9th
🔹 First come, first served basis
Expect precise, no-hype analysis built around real market structure, not speculation.
Drop your asset below 👇

MARKETS week ahead: April 5 – 11Last week in the news
New week brought the old stories and investors' worries. The price of oil was still the main topic impacting investors sentiment, as well as US macro data. The S&P 500 managed to recover at least some 4% of its previous weekly losses, by closing the week at 6.582. The price of gold is trying to find the direction, but still ending the week at $4.676. The US 10Y Treasury yields continue with higher volatility, this week a bit lower from the previous one, but still closing higher, at 4,3%. The only asset still “chopping” and waiting for investors liquidity is the crypto market. BTC was traded in a lower weekly range, managing to close above the $67K.
U.S. markets were closed on Friday due to Holiday, but still some important macro data were posted. February JOLTs job openings came in at 6.88M, slightly below expectations, signaling a modest cooling in labor demand. In contrast, March Nonfarm Payrolls surprised strongly to the upside at 178K, rebounding sharply from February’s contraction of -133K and pointing to renewed hiring momentum. The unemployment rate edged down to 4.3% from 4.4%, while wage growth remained relatively contained, with average hourly earnings rising 0.2% m/m and 3.5% y/y, suggesting limited immediate wage-driven inflation pressure. Beyond jobs data, February retail sales also showed resilience, increasing 0.6% m/m (above expectations) and 3.7% y/y, reinforcing the view that consumer demand remains supportive despite tighter financial conditions.
News is reporting that quantum computing firms are increasingly going public despite volatile market conditions, aiming to capitalize on recent technological breakthroughs and accelerate commercialization. Companies are raising fresh capital to scale operations and move beyond experimental stages toward real-world applications. Strong investor interest reflects growing confidence that the industry is nearing an inflection point, where practical use cases become viable. Overall, the wave of listings signals a shift from research-driven development toward early-stage commercialization of quantum technologies.
Chinese semiconductor firms reported record revenues, driven by strong demand for AI infrastructure and ongoing chip shortages. U.S. export restrictions have further accelerated this growth by pushing domestic tech companies to rely more on local suppliers, boosting China’s push for technological self-sufficiency. Rising demand from cloud providers, data centers, and AI developers has supported continued expansion across the sector. Overall, the combination of AI-driven demand and geopolitical constraints is reshaping China’s chip industry and fueling its rapid growth.
In light of ongoing conflict in the Middle East and surging prices of oil, news is reporting that global food prices continued to rise in March, with the United Nations’ FAO Food Price Index climbing to its highest level since late last year and up 2.4% from February as energy related costs spill over into agricultural commodity markets. The broad based increase was driven by higher prices across major food groups, including cereals, vegetable oils, meat and sugar. While overall supplies remain ample, the FAO warned that persistent high energy and fertilizer costs linked to geopolitical tensions could sustain upward pressure on food prices and affect future production decisions.
CRYPTO MARKET
The overall crypto market remains largely on the sidelines as investors weigh potential US and global macroeconomic developments, particularly the impact of rising oil prices on inflation. If higher energy costs translate into sustained inflation, central banks could maintain elevated interest rates or even raise them further, tightening liquidity conditions. Reduced liquidity tends to limit risk appetite, which can weigh on high-risk assets like cryptocurrencies. Market activity has been relatively muted during the week. Total market capitalization remained relatively flat compared to the previous week. This was also reflected in daily trading volumes, which were significantly reduced to the level of only $76B on a daily basis, from $134B traded a week before. Total market capitalization since the beginning of this year currently stands in a negative territory of -22%, with a total outflow of -$647B.
BTC and ETH once again set the tone for the market. Bitcoin posted a marginal 0.6% weekly gain, indicating stabilization after the previous week’s decline, while Ethereum performed slightly better with a 1.9% w/w increase, suggesting mild improvement in sentiment among large-cap assets. Performance across other major cryptocurrencies was mixed. XRP declined 2.3%, while BNB fell 3.8% and Solana lost 3.3% on a weekly basis. On the positive side, LINK advanced 3.5%, while Avalanche and Tron both recorded modest gains of around 0.8% and 0.6%, respectively. This week Algorand delivered an exceptional 43.4% weekly surge, clearly outperforming the broader market. Zcash also posted a strong gain of 15.0%, while IOTA increased by 9.8% during the week.
On the negative side, Hyperliquid recorded the largest decline, falling 9.5% w/w, followed closely by Uniswap with an 8.7% loss. ONDO also faced notable pressure, declining 7.9%, while DASH fell 6.8% and Stellar dropped 5.6%, highlighting continued weakness across parts of the altcoin segment.
Several tokens delivered strong upside performance. Aside from Algorand, DeXe advanced by 22% and Bitcoin SV gained 21% w/w, placing them among the top performers for the week.
Circulating supply dynamics showed a few notable changes. LINK recorded a significant increase in supply of 2.7% w/w, while SUI followed with a 1.5% increase. Filecoin expanded supply by 0.7%, and IOTA by 0.5%. XRP, Stellar, DASH, Zcash and Solana each recorded 0.1% increases, while Hyperliquid posted a slight 0.1% decrease. Overall, supply-side developments remained selective but somewhat more pronounced compared to previous weeks.
CRYPTO FUTURES MARKET
Bitcoin futures posted a modest recovery this week, reversing part of the prior week’s losses with gains distributed across the curve. The April 2026 maturity increased by 1.37% w/w, settling at $67,135. Along the term structure, advances ranged between 1.13% and 1.83%, with the strongest increase observed in the May 2026 maturity. Longer-dated futures also moved higher, with the December 2027 maturity closing at $73,360, up 1.28% on the week. The relatively even gains across maturities suggest a measured upward shift in the curve, pointing to stabilization rather than a strong directional rebound.
Ether futures outperformed Bitcoin, posting more pronounced gains across all maturities. The April 2026 contract settled at $2,077, rising 4.06% w/w. Across the curve, weekly increases ranged between 2.85% and 4.06%, with the strongest gains concentrated in the front and mid sections. The December 2027 maturity closed at $2,270, up 3.04% on the week, indicating sustained demand across longer-dated exposures.
Overall, this week’s price action reflects a partial recovery following the previous correction, with Ether futures showing stronger momentum relative to Bitcoin. Despite the rebound, both futures curves remain in contango, with longer-dated maturities trading at progressively higher price levels. This continues to suggest that while near-term sentiment has improved, the market remains in a broader stabilization phase rather than a fully established uptrend.

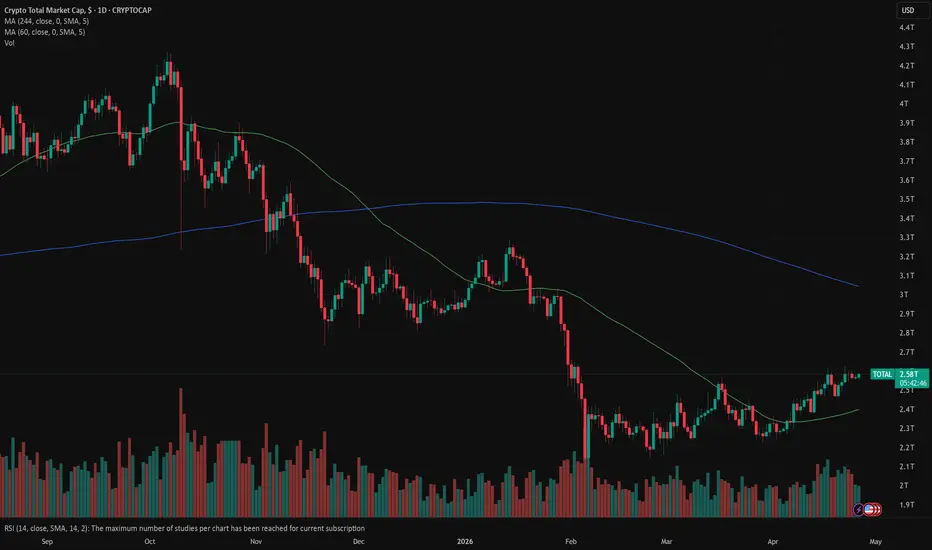
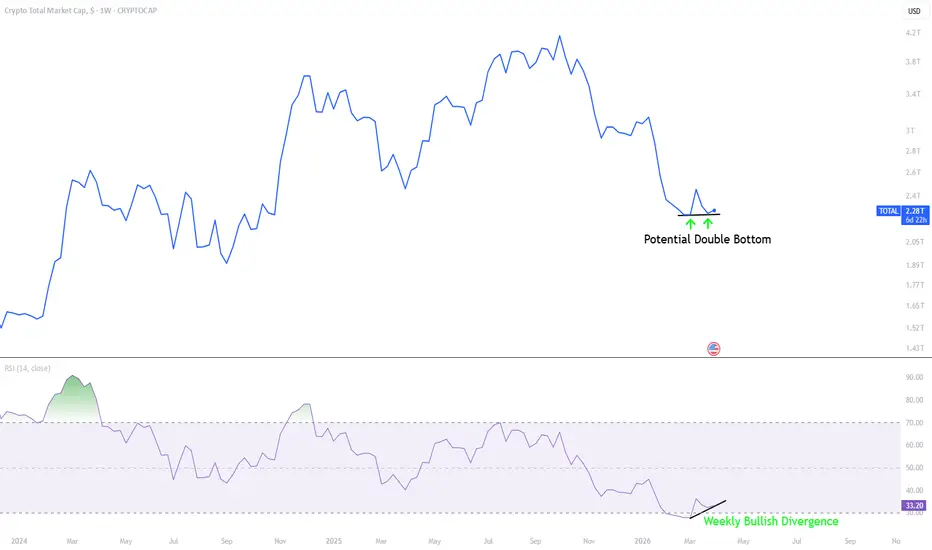
TOTAL - Crypto Recovery Possible?Some major developments have occurred across the board with the price action we saw heading into the weekly close for most cryptocurrencies. For many weeks I have been outlining the bearish case for the crypto total market cap and that scenario remains in play for now.
However, there is a glimmer of hope in the price action that just printed at the close.
Price has formed a double bottom on the weekly timeframe, accompanied by a bullish divergence forming on the weekly RSI. This is most clearly visible on the line chart, which only accounts for candle body closes.
If tomorrow brings headlines of de-escalation progress with the US-Iran conflict, this could mark a local low for some time and allow price to appreciate meaningfully from these levels.
However, if the lows established today are lost, the much more severe bearish scenarios will begin to play out. That level corresponds to the "Weekly Break Level" I outlined in this post:
So far, TOTAL is still respecting this level for now.
Watch tomorrow's developments closely. The direction of the next major move will largely depend on what headlines emerge.
MARKETS week ahead: March 29 – April 4Last week in the news
Macro risks are evidently rising with continuation of the Middle East conflict and rising prices of oil. Markets continue to react to such unpredictable macro environments, putting pressure on equities, Treasuries and even gold. The S&P 500 continued its fifth corrective week, closing Friday at 6.368. Despite a modest recovery on Friday, gold continues to be pressured, with a weekly close at $4.493. The strongest reaction last week was with 10Y Treasury yields, which are testing levels modestly below 4,5%. The crypto market is also feeling investors' reluctance, when BTC did not manage to sustain the $70K level, and closed the week at $67K.
Although last week lacked major macroeconomic data, fundamentals continued to influence investor sentiment, particularly elevated oil prices. Key releases for the week included the S&P Global Manufacturing PMI flash for March, which came in at 52.4, slightly above the estimate of 51.3. The University of Michigan Consumer Sentiment for March was finalized at 53.3, with five-year inflation expectations steady at 3.2%.
Rising oil prices continued to pressure markets as escalating tensions around the Strait of Hormuz threatened global supply, pushing Brent and WTI back toward $100+ a barrel amid doubts over a ceasefire. This surge in energy costs is stoking inflation concerns worldwide, with higher fuel and transportation prices expected to feed through broader price indexes. As a result, central banks face increased pressure on monetary policy, with investors and policymakers wary that persistent energy driven inflation could delay rate cuts or even prompt further tightening. As per CME FedWatch tool, markets are currently pricing in a high probability of the Federal Reserve holding rates steady at its next meeting.
U.S. technology stocks came under heavy pressure this week amid escalating geopolitical tensions and broader market weakness, with major names leading declines. Meta Platforms shares slid sharply after adverse legal rulings held the company and others accountable for harms tied to their platforms, eroding investor confidence and dragging on the tech heavy indices. Market anxieties over inflation, rising yields, and slower growth in AI spending also weighed on other big tech giants, contributing to major US equity indexes' entry into correction territory and broader sell-offs across Microsoft, Alphabet, and Nvidia. The combination of legal risks and macroeconomic concerns has intensified volatility in the sector, amplifying downside pressure on major technology stocks.
As per news reporting, U.S. mortgage giant Fannie Mae will for the first time support mortgage loans that leverage cryptocurrency holdings, allowing homebuyers to use assets like Bitcoin or USDC as collateral for their down payment rather than selling them outright. The product, launched in partnership with Better Home & Finance and Coinbase, integrates crypto into traditional conforming mortgages, potentially expanding access to homeownership for digital asset holders while helping borrowers avoid taxable events tied to selling crypto. Although initially likely to remain a niche offering, this move marks a significant step toward mainstream acceptance of digital assets within the U.S. housing finance system and could influence how lenders and investors view crypto as part of broader credit markets.
CRYPTO MARKET
Rising macro risks are in the focus of investors both on traditional and crypto markets. Surging oil prices are making inflation pressures, which makes the current macro outlook unstable and especially future moves of central bankers. Considering the high level of uncertainties, investors are reluctant to invest their capital in any market. The crypto market modestly corrected as of the end of the previous week. Total market capitalization decreased by 4,3% w/w with an outflow of $104B. Daily trading volumes were just modestly increased to the level of $134B on a daily basis, from $125B traded a week before. Total market capitalization since the beginning of this year currently stands in a negative territory of -22%, with a total outflow of -$650B.
BTC and ETH once again set the tone for the market. Bitcoin declined by 5.0% on a weekly basis, while Ethereum posted a somewhat steeper 5.8% w/w loss, reflecting renewed pressure on the largest and most liquid crypto assets. XRP also moved lower, falling 6.1%, while BNB declined 3.9% during the same period. The weakness was broad, with Solana down 6.8%, Avalanche lower by 6.0%, and Cardano declining 5.0%.
Among the largest negative weekly movers among altcoins, Polkadot recorded the sharpest decline, falling 13.8% w/w. Filecoin also posted a significant drop of 12.9%, while DOGE declined 10.3%. Additional notable losses were seen in IOTA (-8.6%), SUI (-7.6%), and Theta (-7.1%), highlighting broad weakness across the altcoin space.
On the positive side, only a limited number of assets managed to finish the week in green. ONDO stood out with a solid 7.0% weekly gain, Stellar also advanced 3.7%, while Tron moved 1.6% higher, providing only selective pockets of strength in an otherwise negative market environment.
Outside of the main monitored list, several tokens delivered exceptional upside performance despite the broader market sell-off. Siren led the gains with a sharp 77.6% weekly surge, followed by MemeCore with a 35.0% increase, while Midnight advanced by 19.0% w/w, placing them among the top performers across the broader crypto universe.
Circulating supply changes remained relatively modest this week. Tether, DOGE, Stellar, DASH, Zcash, Solana and Filecoin each recorded a 0.1% increase in circulating supply, while Hyperliquid remained the only asset with a slight 0.2% decrease.
CRYPTO FUTURES MARKET
Bitcoin futures recorded a broad-based decline this week, reversing the previous period’s moderate consolidation with a renewed downside move across the curve. The March 2026 maturity fell by 5.68% w/w, settling at $66,235. Across the rest of the term structure, losses were remarkably consistent, ranging between 5.92% and 6.12%, with the August 2026 maturity posting the steepest weekly drop. The December 2027 maturity closed at $72,430, down 5.99% on the week. The parallel nature of the move indicates another uniform downward repricing rather than stress concentrated in any specific maturity.
Ether futures also moved decisively lower, underperforming Bitcoin slightly as weekly losses ranged from 6.56% to 6.99%. The March 2026 maturity settled at $1,993, down 6.56%, while the August 2026 maturity recorded the largest decline at 6.99%. Longer dated futures remained under similar pressure, with the December 2027 maturity closing at $2,203, representing a weekly loss of 6.69%.
It is also worth noting that September 2027 futures appeared on the curve for the first time this week for both Bitcoin and Ether, with initial pricing at $71,560 and $2,175, respectively.
Despite the sharp correction, both Bitcoin and Ether futures curves continue to maintain their contango structure, with longer dated maturities trading at progressively higher price levels than near term futures. This suggests that while short term sentiment weakened materially during the week, longer term forward pricing still reflects expectations of relatively higher valuations over time.