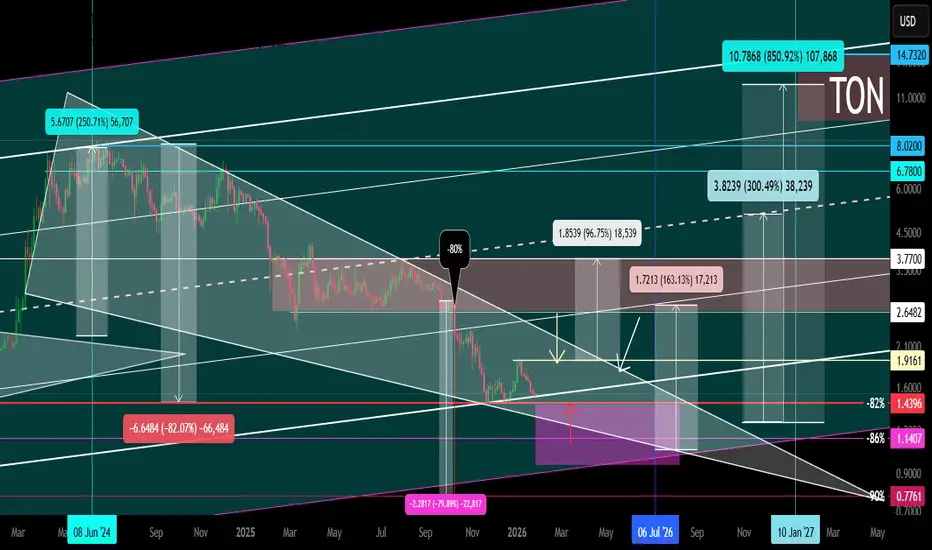
TON Secondary Trend. Wedge. Reversal Zones. January 29, 2026Logarithm. 3-day time frame. A descending wedge (incomplete formation) is forming in the ascending channel of the main trend. The local trend shows reversal zones and local percentages to key support/resistance zones.
Currently in the TOP 29 by market capitalization. Most likely, the capitalizatio
Key stats
About Toncoin
Related coins
Make TON Great Again (MTONGA)✈️ Pavel Durov may have just dropped subtle hints about the future growth of Toncoin ➡️judging by his latest update. 🙂
A major upgrade has gone live, making the TON blockchain 10× faster. Transactions are now processed almost instantly, which is a significant technical leap. From a market perspecti

Toncoin Wave Analysis – 10 April 2026
- Toncoin broke daily Triangle
- Likely to rise to resistance level 1.3860
Toncoin cryptocurrency recently reversed from the support zone between the multi-month support level 1.2000 (which has been reversing the price from February), support trendline of the daily Triangle from February and the l

Toncoin Wave Analysis – 25 March 2026- Toncoin broke daily Triangle
- Likely to rise to resistance level 1.3860
Toncoin cryptocurrency pair recently broke the resistance trendline of the daily Triangle from the start of February – which accelerated the active impulse wave iii.
The breakout of this Triangle accelerated the C-wave of t

If BTC Continues Up, TON Could Bounce...TON - 1HR Chart
A doji candle at the golden window could lead to a decent bounce for TON If BTC can continue up.
BTC - 15 MIN Chart
BTC found support from two golden windows.
TON/BTC - Daily Chart
Inside two golden windows with a slightly lower low.
USDT.D Daily Chart
Could be a turn aroun


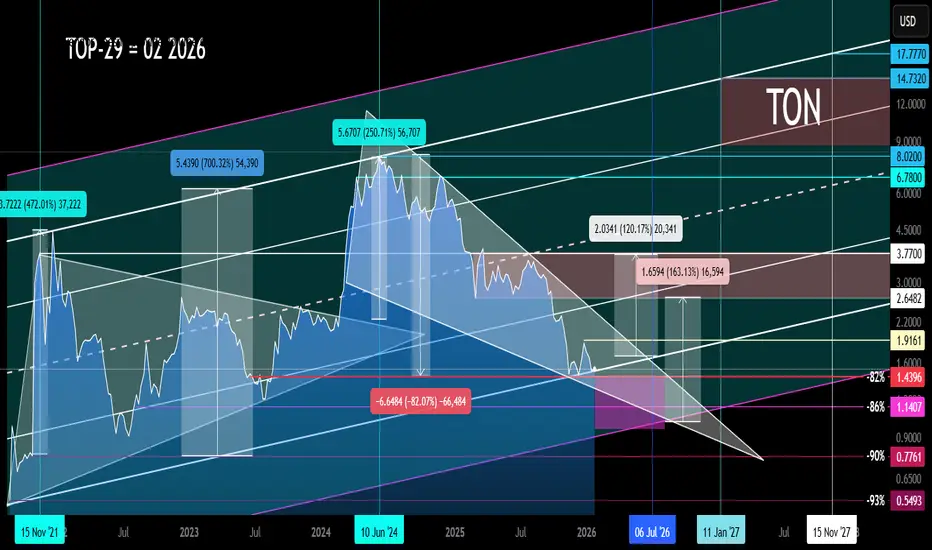
TON Main Trend. Channel. Wedge. Reversal Zones. January 2026Logarithm. Primary trend. Time frame: 1 week.
Secondary trend. Time frame: 3 days.
TONUSD – Double Bottom Formation TONUSD – Double Bottom Formation (Neutral Technical View)
The chart shows a double bottom structure, where price formed two lows (Bottom 1 and Bottom 2) near the same zone. This is generally watched as a potential reversal signal when price moves back toward the neckline.
Key observations:
Bottom
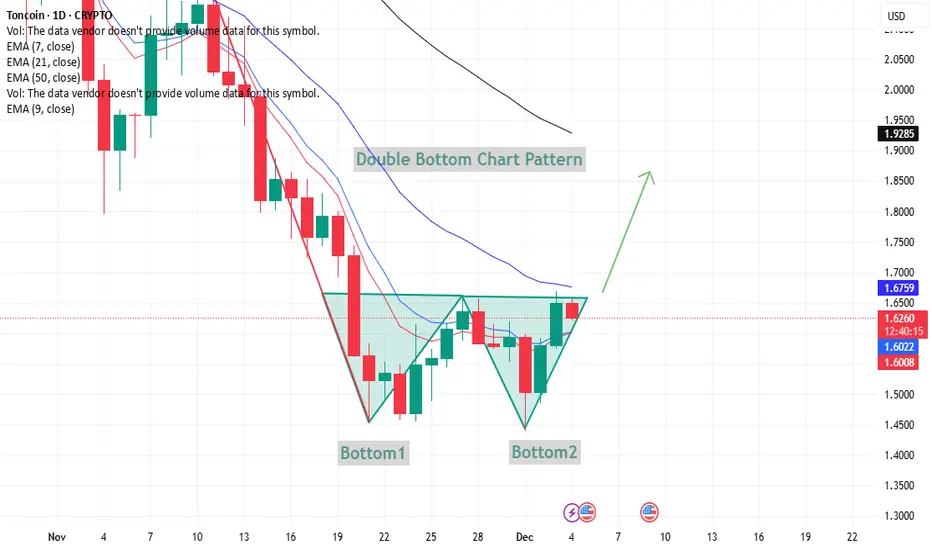
TonUsdLong 3.14
StopLoss 1.42
This is not a guide to action. Investing in cryptocurrency may involve risks.

TONUSD: Wave Structure in Search of Growth ImpulseTONUSD: Wave Structure in Search of Growth Impulse
TONUSD Wave Overview (D1 and H4)
As a trader who has been practicing wave analysis for over ten years, I note that the current picture for TONUSD shows the end of an extended corrective phase and the potential for a new movement.
D1 Chart: The glo

See all ideas
Summarizing what the indicators are suggesting.
Oscillators
Neutral
SellBuy
Strong sellStrong buy
Strong sellSellNeutralBuyStrong buy
Oscillators
Neutral
SellBuy
Strong sellStrong buy
Strong sellSellNeutralBuyStrong buy
Summary
Neutral
SellBuy
Strong sellStrong buy
Strong sellSellNeutralBuyStrong buy
Summary
Neutral
SellBuy
Strong sellStrong buy
Strong sellSellNeutralBuyStrong buy
Summary
Neutral
SellBuy
Strong sellStrong buy
Strong sellSellNeutralBuyStrong buy
Moving Averages
Neutral
SellBuy
Strong sellStrong buy
Strong sellSellNeutralBuyStrong buy
Moving Averages
Neutral
SellBuy
Strong sellStrong buy
Strong sellSellNeutralBuyStrong buy
Displays a symbol's price movements over previous years to identify recurring trends.
Frequently asked questions
The current price of Toncoin (TON) is 1.3063 USD — it has fallen −1.50% in the past 24 hours. Try placing this info into the context by checking out what coins are also gaining and losing at the moment and seeing TON price chart.
The current market capitalization of Toncoin (TON) is 3.26 B USD. To see this number in a context check out our list of crypto coins ranked by their market caps or see crypto market cap charts.
Toncoin (TON) trading volume in 24 hours is 228.73 M USD. See how often other coins are traded in this list.
Toncoin price has risen by 0.68% over the last week, its month performance shows a 6.60% increase, and as for the last year, Toncoin has decreased by −60.05%. See more dynamics on TON price chart.
Keep track of coins' changes with our Crypto Coins Heatmap.
Keep track of coins' changes with our Crypto Coins Heatmap.
Toncoin (TON) reached its highest price on Jun 15, 2024 — it amounted to 8.2800 USD. Find more insights on the TON price chart.
See the list of crypto gainers and choose what best fits your strategy.
See the list of crypto gainers and choose what best fits your strategy.
Toncoin (TON) reached the lowest price of 0.3920 USD on Sep 20, 2021. View more Toncoin dynamics on the price chart.
See the list of crypto losers to find unexpected opportunities.
See the list of crypto losers to find unexpected opportunities.
The current circulating supply of Toncoin (TON) is 5.17 B USD. To get a wider picture you can check out our list of coins with the highest circulating supply, as well as the ones with the lowest number of tokens in circulation.
The safest choice when buying TON is to go to a well-known crypto exchange. Some of the popular names are Binance, Coinbase, Kraken. But you'll have to find a reliable broker and create an account first. You can trade TON right from TradingView charts — just choose a broker and connect to your account.
Crypto markets are famous for their volatility, so one should study all the available stats before adding crypto assets to their portfolio. Very often it's technical analysis that comes in handy. We prepared technical ratings for Toncoin (TON): today its technical analysis shows the sell signal, and according to the 1 week rating TON shows the sell signal. And you'd better dig deeper and study 1 month rating too — it's sell. Find inspiration in Toncoin trading ideas and keep track of what's moving crypto markets with our crypto news feed.
Toncoin (TON) is just as reliable as any other crypto asset — this corner of the world market is highly volatile. Today, for instance, Toncoin is estimated as 0.50% volatile. The only thing it means is that you must prepare and examine all available information before making a decision. And if you're not sure about Toncoin, you can find more inspiration in our curated watchlists.
You can discuss Toncoin (TON) with other users in our public chats, Minds or in the comments to Ideas.