BTCUSD – Trend Continuation Analysis📊 BTCUSD – Trend Continuation Analysis
🔍 Market Overview
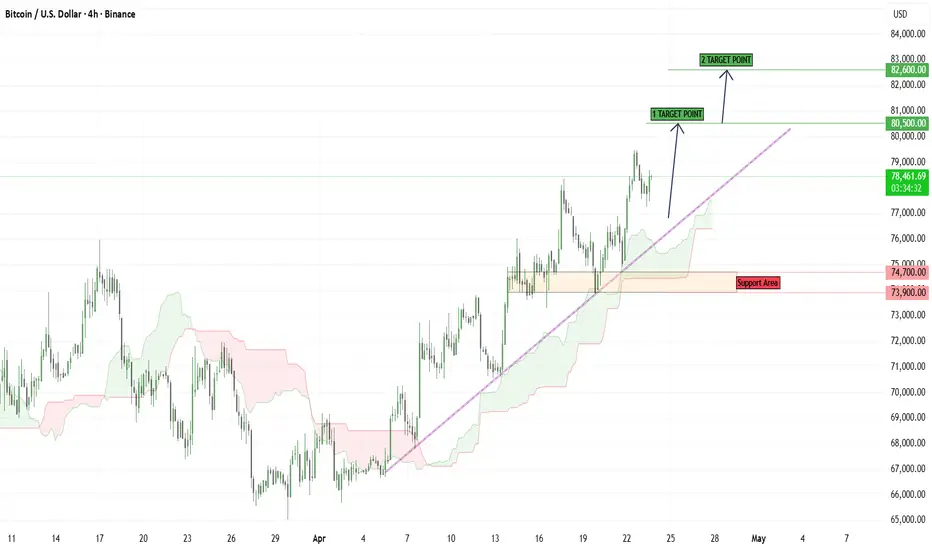
Bitcoin has developed a clean upward trajectory, supported by a rising trendline and consistent demand reactions from lower levels. The market has transitioned smoothly from accumulation into a bullish expansion phase, reflecting strong underlying buying interest.
Recent price action shows controlled pullbacks rather than aggressive sell-offs, indicating that buyers are actively defending key levels and maintaining bullish dominance.
📈 Structural Perspective
* Trend Bias: Bullish (trend-following environment)
* Price Behavior: Higher highs & higher lows intact
* Current Positioning: Holding above dynamic trendline support
The structure remains technically strong as long as price continues to respect the ascending support and avoids breaking below recent higher lows.
🚀 Trade Outlook
✅ Bullish Case (Preferred Direction)
Requirements:
* Price sustains above 74,000 support region
* Trendline continues to act as dynamic support
* Momentum candles support continuation
Execution Idea:
Focus on buying pullbacks into support or trendline with clear bullish confirmation.
🎯 Upside Target 1: 80,500
🎯 Upside Target 2: 82,600
❌ Bearish Case (Structure
Failure)
Requirements:
* Break below trendline with strong bearish close
* Loss of support zone validity
Execution Idea:
Short positions become valid on a retest of the broken structure.
🎯 Downside Target 1: 72,000
🎯 Downside Target 2: 69,500
📍 Key Price Zones
🔴 Resistance Levels: 80,500 – 82,600
🟢 Support Area: 73,900 – 74,700
⚠️ Breakdown Level: Below 73,500
⚠️ Market Behavior Note
The current move reflects a healthy bullish trend, where price is respecting structure and moving in waves. This type of price action often leads to continuation rather than reversal unless a clear structural breakdown occurs.
🧠 Trading Edge
Best opportunities exist in:
* Controlled pullbacks within trend
* Retests of trendline support
* Breakout continuation setups
Avoid chasing strong impulsive candles — patience improves entry quality.
🛡️ Risk Control
* Maintain low risk per trade (1–2%)
* Always define invalidation before entry
* Let price confirm before reacting
In-depth trading ideas
What Makes a Level ImportantCharts are full of lines. Support levels, resistance levels, trendlines, channels. Many traders end up marking so many areas that every movement on the chart appears to happen near a “level.” When everything is important, nothing actually is.
In reality, only a small number of levels consistently influence price behavior.
A level becomes important when it represents concentrated decision-making in the market. These locations attract orders, attention, and participation. When price reaches them, traders are forced to act, and that activity produces meaningful reactions.
One of the strongest types of levels is previous structure.
Prior highs and lows often contain large amounts of liquidity. Traders place stop losses around these areas, breakout traders place entries beyond them, and institutions use the resulting order flow to execute larger positions. Because of this concentration of orders, price frequently reacts when it reaches these locations.
Another important factor is repeated interaction.
A level that price has respected multiple times tends to attract more attention from market participants. Each reaction reinforces the belief that the level matters, which increases the likelihood that traders will place orders around it again in the future.
Liquidity concentration also plays a major role.
Equal highs, equal lows, range boundaries, and obvious swing points often collect stop losses and breakout orders. When price approaches these areas, the market gains access to a large pool of orders, which can trigger sharp movements or sudden reversals.
Timeframe also affects importance.
Levels visible on higher timeframes tend to influence price more strongly than levels that appear only on lower timeframes. A daily high or weekly range boundary often attracts far more participation than a small level visible only on a five-minute chart.
Location relative to the broader structure matters as well.
A level that sits at the edge of a range or near a major liquidity pool carries more significance than one that appears in the middle of ongoing price movement. Markets tend to react where decisions must be made, not where price is simply passing through.
Understanding these characteristics helps traders filter meaningful levels from visual noise.
Instead of drawing many lines across the chart, traders can focus on areas where participation is likely to increase. When price reaches these zones, the behavior of the market becomes more informative.
The goal is not to predict exactly how price will react.
The goal is to recognize locations where reaction becomes likely.
Important levels are not important because they are drawn on the chart.
They are important because traders place orders around them.
When traders begin to identify levels based on liquidity, structure, and participation, the chart becomes much clearer and decision-making becomes significantly easier.
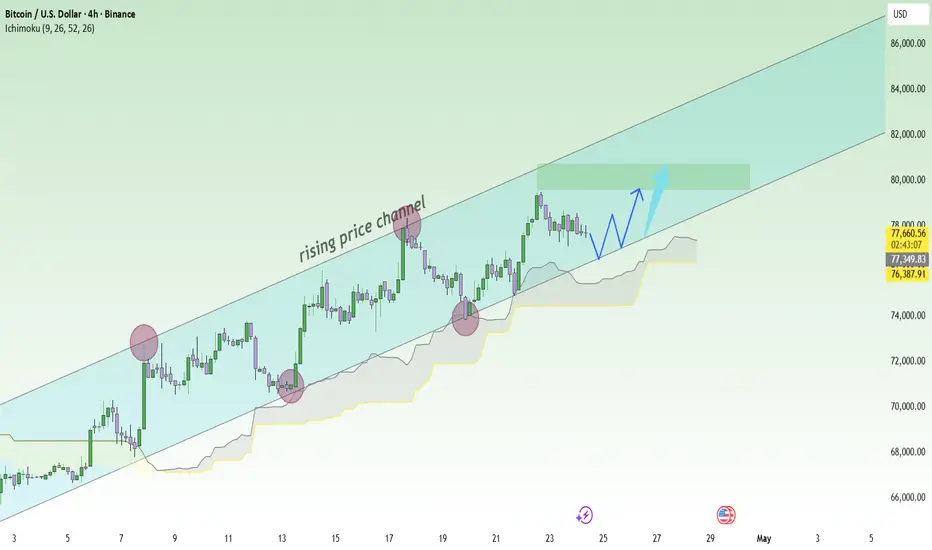
BTC is quiet… before a big surge.?BTCUSD currently maintains a fairly "clean" and easy-to-read uptrend structure. The price is moving within a clear ascending channel, consistently creating higher lows and higher highs, indicating that buyers remain in complete control. The price's close adherence to the Ichimoku zone, especially the Kijun around 76.5K, signals that the trend is holding firm and shows no signs of breaking.
Combined with recent news, the picture leans even more towards the buyers. Inflows from ETFs and institutions remain stable, while negative news such as geopolitical tensions only cause minor price corrections without breaking the trend. This generally indicates a healthy market – because if the trend were weak, bad news would be enough to pull the price down significantly.
In the short term, if BTC holds the 76.5K–77K range, it's highly likely the price will continue to consolidate slightly before pushing up to retest the 79.5K–80K range. If buying pressure remains strong, an extension to the 82K region within the price channel is entirely feasible.
However, the current market is highly volatile due to large leverage liquidations, leading to potentially frustrating two-way sweeps. Rapid dips at this point are more likely to be "shakeout" than a genuine reversal.
Understanding Bitcoin’s Price Behavior with Bollinger BandsHello mates, have you noticed how Bitcoin often makes its biggest moves after periods of silence?
What looks like inactivity is rarely random it is usually preparation, so let’s understand what’s really happening.
Most traders approach Bollinger Bands with a very simplified mindset, often reducing it to overbought and oversold signals. While this interpretation is widely used, it fails to capture how markets actually behave in real conditions. Bitcoin does not react mechanically to indicators; instead, it moves through repeating cycles of volatility, expansion, and contraction. Bollinger Bands, when understood correctly, do not predict direction but provide a framework to observe how these cycles unfold over time.
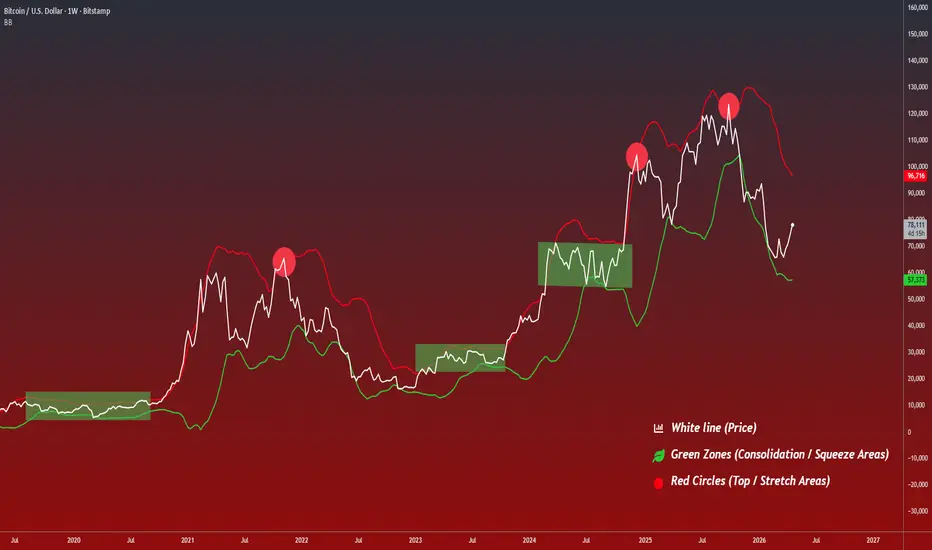
At a structural level, Bollinger Bands expand and contract based on volatility. When volatility decreases, the bands tighten and price action becomes compressed within a narrow range. When volatility increases, the bands widen and price begins to move with momentum. This expansion and contraction is not random it reflects the natural rhythm of the market. In Bitcoin, this rhythm becomes even more pronounced due to its speculative nature and strong participation cycles.
One of the most important aspects to understand is the relationship between Bitcoin’s price and Bollinger Bands during different phases of the market. During trending environments, price does not simply reverse upon touching the upper or lower band. Instead, it often “rides” the band, especially in strong bullish phases where price consistently interacts with or remains near the upper band. This reflects sustained momentum rather than exhaustion. On the other hand, during ranging or low volatility conditions, price tends to oscillate between the bands without clear direction. This dynamic relationship shows that Bollinger Bands are not static boundaries, but adaptive structures that respond to how Bitcoin behaves in different environments.
Periods where the bands contract tightly are often misunderstood as unimportant or inactive. In reality, these phases represent preparation. Price moves sideways, volatility drops, and the market appears quiet. However, this is typically where accumulation or re-accumulation takes place. Larger participants gradually build positions while retail traders lose interest due to the lack of movement. What looks like stagnation on the surface is often the foundation for the next major move.
As the market transitions out of this low volatility phase, expansion begins. The bands start to widen, and price breaks out of its range with increasing momentum. This is the phase where the market shifts from preparation to execution. The move that was previously hidden within a tight consolidation becomes visible, attracting more participants. It is important to note that by the time expansion is clearly visible, a significant portion of the move may already be underway.
In the later stages of a trend, price often stretches toward the outer bands, particularly the upper band in bullish conditions. This behavior is frequently misinterpreted as an immediate signal of reversal. However, it is more accurately a reflection of strong momentum combined with increasing volatility. Over time, as the trend matures, these extensions can begin to show signs of weakening. Price may still remain elevated, but the ability to sustain further expansion starts to diminish. This is where exhaustion or distribution-like behavior can emerge, often leading to slower price action or eventual corrections.
A common mistake among traders is to treat Bollinger Bands as direct trading signals rather than contextual tools. Assuming that every upper band touch is a sell signal or every lower band touch is a buy signal ignores the broader structure of the market. Similarly, dismissing low volatility phases as irrelevant can lead to missed opportunities, as these are often the periods where the most strategic positioning occurs.
A more refined approach is to interpret Bollinger Bands through the lens of behavior. A squeeze should be viewed as a phase where potential energy is building within the market. Expansion should be understood as the release of that energy, confirming that a move is in progress. Extended interaction with the bands should not be immediately faded, but rather analyzed in the context of trend strength and maturity.
The chart illustrates this repeating cycle clearly. The highlighted consolidation zones show how periods of low volatility consistently precede strong expansions. These expansions then transition into phases where price begins to stretch and gradually lose momentum. This sequence compression, expansion, and eventual exhaustion repeats across different timeframes and market conditions, forming a recognizable pattern in Bitcoin’s behavior.
Ultimately, Bollinger Bands are most effective when used to understand the timing and nature of market activity rather than to predict exact turning points. They provide insight into when the market is quiet, when it is becoming active, and when it may be approaching a stage of diminishing momentum. This perspective allows traders to shift from reacting to price movements toward anticipating structural changes.
In simple terms, value is often built when the market is quiet, and it becomes visible when the market expands. Recognizing this transition is what separates surface-level indicator usage from a deeper understanding of market behavior.
Volatility doesn’t appear randomly it expands after it has been quietly compressed. If you can read that transition, you stop chasing moves and start anticipating them.
Thanks for reading.
Regards- Amit.
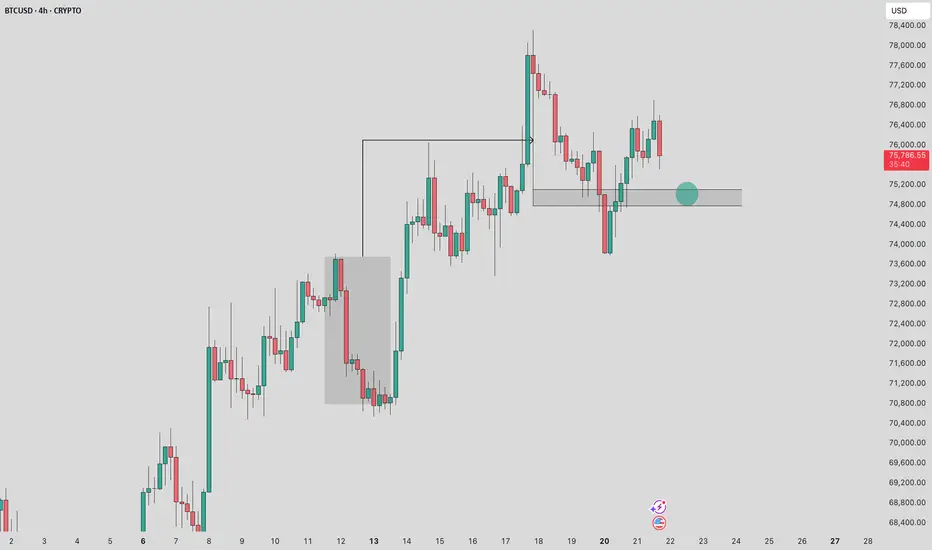
Potential Continuation in BTCUSD After Pullback in 4HI observed a bullish structure developing after a corrective phase, where price formed a strong impulsive move upward from a demand zone, creating higher highs and higher lows. Before this expansion, the market showed a brief consolidation and a final bearish push that swept liquidity below prior lows, followed by an aggressive reversal. This shift indicated a clear transition from selling pressure to strong demand, initiating a new bullish leg.
As price moved higher, it respected structure and continued building momentum, eventually breaking above a previous resistance area and confirming strength in the trend. However, after reaching a local high, the market entered a pullback phase, forming a series of lower highs as it retraced into a key support zone. This pullback appears corrective in nature, suggesting that the broader bullish structure is still intact unless deeper levels are broken.
Currently, price is reacting within this support zone, showing signs of stabilization after the recent decline. The presence of wicks and smaller candles indicates that buyers are attempting to defend this level.
Speculative Outlook:
Price is now trading at a key support zone, which acts as a critical decision area. If this zone holds, the market may form a base and continue upward, potentially targeting the previous highs.
There is also a possibility of a liquidity sweep below this zone, where price briefly dips lower, takes out nearby lows, and then reverses upward, trapping sellers.
However, if price breaks below this support with strong bearish momentum, it would weaken the bullish structure and suggest a deeper correction. This makes the current area a key decision point between continuation of the uptrend or a shift into a larger pullback.
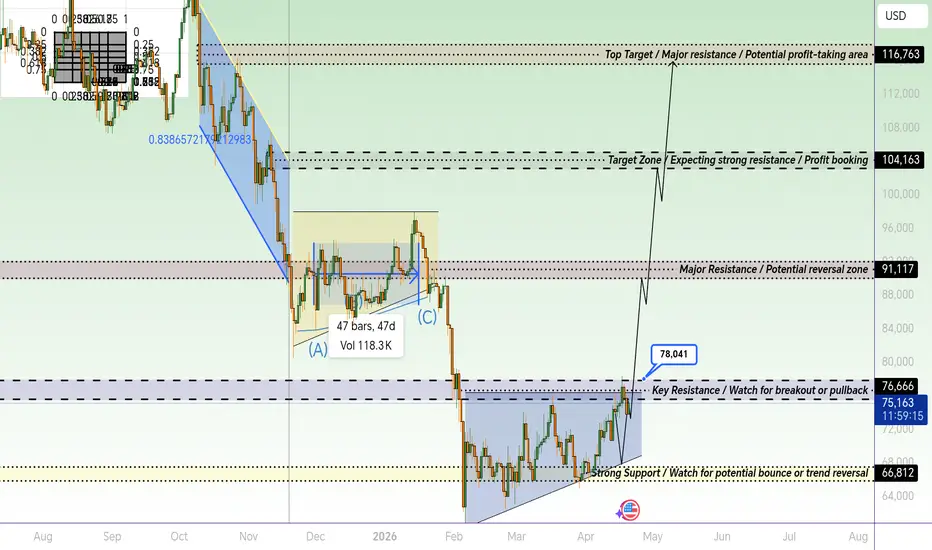
BTC/USD Key Levels & Trend OutlookBTC/USD is currently testing a critical resistance zone around 76,666. Traders should monitor for potential breakout or pullback. Strong support lies at 66,812, providing a key area for trend reversal. Upside targets include 91,117 and 104,163, representing major resistance and potential profit-taking zones. This analysis highlights key levels for tactical entries, exits, and risk management in the current market structure
BTCUSD – Key Resistance & Support ZonesPrice approaching key resistance at 76,666; monitor for breakout or pullback. Major resistance at 91,117 could act as a potential reversal zone. Target zone at 104,163 for profit booking. Top target near 116,763. Strong support at 66,812 to watch for potential bounce or trend reversal
Why Price Often Returns to the Origin of a MoveOne of the recurring behaviors in financial markets is the tendency for price to revisit areas where strong moves originally began. Traders often notice this pattern but struggle to understand why it happens.
The explanation lies in how orders are executed during rapid price movement.
When the market moves slowly, buyers and sellers transact gradually. Orders are matched efficiently and price progresses in a balanced manner. Each level receives enough participation for trades to be completed smoothly.
Strong directional moves behave differently.
During rapid expansion, price moves faster than orders can be evenly matched. Aggressive buying or selling pushes the market quickly through several price levels, leaving limited trading activity behind. This creates areas where transactions were incomplete or uneven.
These areas represent imbalances in the market.
An imbalance does not mean price must immediately reverse. Instead, it means that the market passed through the area too quickly for normal two-sided participation to occur. Because of this, there are often unfilled or partially filled orders remaining within that zone.
Over time, the market tends to revisit these locations.
When price returns to the origin of a strong move, several things can happen. Traders who missed the original move may enter positions. Institutions may complete portions of larger orders that could not be fully executed during the initial expansion. The additional participation helps rebalance the order flow.
This process often produces reactions or temporary pauses in price movement.
The concept can be observed across many timeframes. A strong impulsive move followed by a pullback frequently retraces toward the base or starting point of that movement before continuing in the original direction.
Importantly, this behavior does not guarantee reversal.
Sometimes price returns briefly to the origin of the move and then resumes its previous trend. In other cases, the revisit leads to deeper rotation or a full shift in structure. The outcome depends on the balance of participation at the time.
Understanding this dynamic helps traders avoid chasing price after large expansions.
When a move has already traveled far from its starting point, the probability of retracement increases because the market may need to rebalance the inefficiencies created during the rapid movement.
Instead of entering late in the move, traders often wait for price to return closer to the origin where risk becomes easier to manage and participation can be evaluated more clearly.
Markets do not move in straight lines indefinitely.
Rapid expansion often leaves unfinished business behind.
When price revisits those areas, the market has an opportunity to complete transactions that could not occur during the initial surge.
BTCUSD: THIS Historical Fractal Formation Could Complete Again!Hello There,
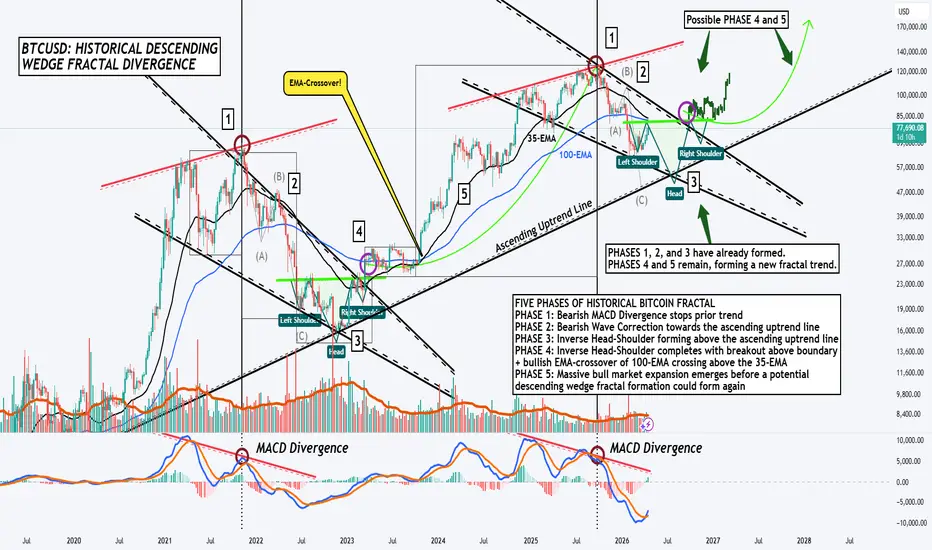
welcome to my new analysis about BTCUSD on the weekly timeframe. I have spotted a major historical fractal formation that could complete BTCUSD now again. The first phases of the fractal have already been completed. With BTCUSD moving further in this fractal formation, this could be a start of the new cycle repeating.
As when looking at my chart, we can see there that the historical descending wedge fractal consists of exactly five phases. In the first phase, a bearish MACD divergence with the MACD bands closing below the previous high MACD bands signals the MACD divergence. In the second phase, a bearish wave count to the downside dumps right into the ascending uptrend line.
The third phase is an inverse head-and-shoulders formation. The fourth phase is a breakout above the upper boundary of this huge established descending wedge formation and setup above. The fifth phase is the massive bullish expansion towards the upside, also confirmed by a bullish EMA crossover with the 100-EMA in blue crossing above the 35-EMA in black.
Bitcoin has right now exactly completed the first three phases of the fractal since September 2025 again. While there could be short-term bullish pressure that could test the 100-EMA, this is likely to be the point of the major head forming of this inverse head-and-shoulders formation. If this completes as well, there is a huge possibility of BTCUSD continuing with the next phases.
A confirmation breakout above the upper boundary of the gigantic descending wedge formation would confirm phase 4 with the setup to the further cycle repetition in phase 5. The additional EMA crossover would confirm the completion of the historical descending wedge fractal again. In the next times, the further formations of the price action will pave the way for the future cycle.
In this manner, thank you a lot for watching!
The support is highly appreciated.
VP
The Role of Patience in Trade SelectionOne of the least discussed skills in trading is patience. Most educational content focuses on strategies, indicators, and entry techniques. Yet many losses occur not because traders lack knowledge, but because they act before conditions actually justify a trade.
Markets spend a large portion of time in environments where opportunity is limited. Price may drift inside ranges, move slowly during low participation sessions, or rotate between levels without clear intent. These periods can create the illusion of activity while offering very little edge.
Impatient traders interpret movement as opportunity. They take trades simply because the chart is active, not because the environment supports their strategy. Over time, this behavior leads to a large number of marginal trades that gradually erode performance.
Patience improves trade selection by reducing exposure to these environments.
A strong trading opportunity usually contains several aligned elements. Structure provides direction, liquidity offers a clear objective, and participation produces momentum once price reaches a key level. When these elements appear together, the probability of follow-through increases.
Without this alignment, trades become dependent on luck rather than structure.
Patience also improves risk efficiency. When traders wait for price to reach meaningful locations, entries occur closer to invalidation. Stops can remain small relative to the potential movement. When trades are taken prematurely, stops often need to be wider while targets remain unchanged, which weakens reward-to-risk.
Another benefit of patience is psychological stability.
When traders feel pressure to trade frequently, each decision becomes emotionally charged. Missing a move can feel frustrating, and losses can feel personal. Waiting for specific conditions removes that pressure. The trader’s role shifts from searching constantly to responding selectively.
Professional traders often describe their work as waiting rather than trading.
They spend significant time observing the market without participating. Preparation happens in advance: identifying important levels, planning possible scenarios, and defining invalidation. When price eventually reaches the location that matters, the decision becomes straightforward.
This process may produce fewer trades, but the trades that do occur tend to be higher quality.
Patience does not mean inactivity without purpose. It means maintaining readiness while allowing the market to present conditions that justify participation.
In trading, opportunity rarely appears at random moments.
It appears when structure, liquidity, and participation align.
The discipline to wait for that alignment often separates consistent traders from those who constantly search for action.
BITCOIN The 1M RSI and ATH break-out show the next bottom!Bitcoin (BTCUSD) has historically made a Cycle Top within 8 - 11 months after the price made a convincing 1M candle closing above the previous All Time High (ATH) Resistance. At the same time, it has made a Cycle Bottom within 21 - 23 months after that same break-out occurred.
While that technical evidence is enough alone, here comes the 1M RSI to further confirm that model. Those same Cycle bottoms have occurred at or 1 month before the 1M RSI hit its Lower Lows trend-line (Fibonacci Channel bottom) as shown by the green circles.
Based on the above, an October 2026 Cycle bottom is very likely to occur and with the 1M MA100 (green trend-line) posing as the next Cycle Support, this can take place within a $45000 - 40000 Zone.
Would you agree with that? Feel free to let us know in the comments section below!
---
** Please LIKE 👍, FOLLOW ✅, SHARE 🙌 and COMMENT ✍ if you enjoy this idea! Also share your ideas and charts in the comments section below! This is best way to keep it relevant, support us, keep the content here free and allow the idea to reach as many people as possible. **
---
💸💸💸💸💸💸
👇 👇 👇 👇 👇 👇

BITCOIN Halvings show EXACTLY WHEN it's going to BOTTOM.Bitcoin (BTCUSD) is staging a strong rally this month, following the first green month (March) after 5 straight red. So is this the bottom? Not quite based on the Halving Cycle's Theory.
On this chart you can see that since the July 2016 Halving, every Bull Cycle Top was priced on the 0.382 Time Fibonacci level (red circle) between Halving dates. Similarly the Bear Cycle Bottoms were priced on the 0.618 Time Fib (green circle).
Right now the market found Support exactly on the 1M MA50 (blue trend-line) with the previous Bear Cycle bottoming just above the 1M MA100 (green trend-line). The last Cycle Top was priced exactly on the 0.382 Fib and the next 0.618 is on October 2026 based on the expected April 2028 Halving.
So based on this highly effective model, the current 2026 Bear Cycle should bottom this October, which is consistent with the majority of analyses and models we've used. Technically is should test the 1M MA100 as well, so (again consistent with our past analyses) this should be closer to $40000.
So are you also expecting a BTC bottom around October 2026 and the $40k mark? Feel free to let us know in the comments section below!
If you are wondering how well Halving based technical models work, have a look at the analyses below. It's only a small sample of those we've done over the years:
---
** Please LIKE 👍, FOLLOW ✅, SHARE 🙌 and COMMENT ✍ if you enjoy this idea! Also share your ideas and charts in the comments section below! This is best way to keep it relevant, support us, keep the content here free and allow the idea to reach as many people as possible. **
---
💸💸💸💸💸💸
👇 👇 👇 👇 👇 👇

Buyers Dominate as BTC Trends UpwardThe BTC/USD chart reflects a strong bullish trend after breaking out from a previous downtrend structure. Price action has shifted into higher highs and higher lows, indicating growing buyer dominance 📈. Key demand zones are holding well, showing consistent buying pressure and market confidence 💪.
Although minor rejections are visible at resistance levels, the overall structure remains bullish. A short-term pullback toward the support zone around 76,405–77,331 is possible before continuation 🔄. This retracement could provide a better entry for buyers.
If momentum sustains, the first target stands at 79,366, where some resistance may slow price action 🎯. A breakout above this level will likely accelerate the move toward the second target at 84,353 🚀.
Overall, the trend favors buyers, and as long as price holds above key support zones, bullish continuation remains the most probable scenario.
If you found this analysis helpful, don’t forget to LIKE 👍 and COMMENT 💬!

BITCOIN Super Cycles prompt to one final crash.Bitcoin (BTCUSD) is quite possibly having the last rally before it starts the 2nd and final Phase of the Bear Cycle. Technically this Super Cycles chart shows that once the price breaks below the 1W MA50 (blue trend-line), the Bear Cycle remains valid until it recovers it.
For now it is in effect and if we assume a -6% deceleration on the %rate of each Bear Cycle total decline from the previous, then the current one (2026) could bottom after a -72% drop, giving us $35000. We've shown in previous analyses why 45-40k is the most likely Buy Zone candidate and this is why it is a solid idea for long-term investors to start accumulating at $50000. Right now, we expect this 2nd and part of the Bear Cycle to deliver that final crash to breach 50k.
Do you agree? Feel free to let us know in the comments section below!
---
** Please LIKE 👍, FOLLOW ✅, SHARE 🙌 and COMMENT ✍ if you enjoy this idea! Also share your ideas and charts in the comments section below! This is best way to keep it relevant, support us, keep the content here free and allow the idea to reach as many people as possible. **
---
💸💸💸💸💸💸
👇 👇 👇 👇 👇 👇

Trend Continuation in BTCUSD or Rejection at Resistance at 2HI observed a strong bullish structure developing after a period of consolidation, where price initially formed a base and then created an impulsive move upward, establishing higher highs and higher lows. Within the earlier phase, the market showed a consolidation block followed by expansion, indicating accumulation and a shift toward demand-driven movement. As price progressed, it respected an ascending trendline, confirming continued bullish control and steady momentum.
Recently, price accelerated sharply to the upside, breaking above a previous high and entering a key resistance zone. This move was impulsive with strong bullish candles, suggesting aggressive buying and continuation strength. However, the current price is now positioned inside a higher timeframe supply zone, where reactions are likely due to the presence of sell orders.
At this stage, the market is extended after a strong rally and may begin to slow down or consolidate near this resistance area.
Speculative Outlook:
Price is now trading within a key supply zone, which acts as a critical decision point. If price shows rejection here, the market may experience a pullback or consolidation toward lower support or the ascending trendline.
There is also a possibility of a liquidity grab above the zone, where price slightly breaks higher, attracts breakout buyers, and then reverses downward.
However, if price sustains above this supply zone with strong bullish momentum, it would confirm continuation of the uptrend and open the path for further upside. This makes the current area a key decision point between a short-term correction or continued bullish expansion.

Why Volatility Changes ExecutionMany traders apply the same execution rules in every market condition. They use identical position sizes, stop distances, and entry timing regardless of how the market is behaving. The problem with this approach is that volatility constantly changes.
Volatility represents the speed and size of price movement. When volatility expands, candles become larger, ranges widen, and price moves faster between levels. When volatility compresses, price moves slowly and stays confined to tighter ranges.
These shifts have a direct impact on execution.
During periods of high volatility, the market requires more room to move. Large candles and aggressive wicks mean that normal fluctuations can reach levels that would normally trigger tight stops. Traders who keep stops too close during these environments are often removed from trades even though the overall idea remains valid.
Position sizing must also adjust.
If volatility increases but position size remains unchanged, the effective risk of each trade increases as well. Wider stop distances combined with unchanged size can produce losses that are larger than intended. Reducing size during volatile periods helps maintain stable risk across changing market conditions.
Entry timing also changes when volatility expands.
Fast markets tend to move quickly toward liquidity pools and structural levels. Chasing price during these moments often leads to poor entries because the move may already be approaching exhaustion. Waiting for retracement or confirmation becomes more important when volatility is high.
Low volatility environments present different challenges.
When price moves slowly inside tight ranges, stops can be placed closer to invalidation because the market is not producing large swings. This can improve risk efficiency if the trade is taken near a meaningful level. However, low volatility can also produce false signals because participation is limited.
Recognizing these conditions helps traders adapt their approach.
Execution should always respond to how the market is behaving rather than assuming every session will behave the same way. When volatility expands, size often decreases and stops widen slightly. When volatility compresses, size may increase modestly while stops remain tighter.
This adjustment keeps risk consistent even though the market environment is constantly changing.
Volatility does not only affect price movement.
It changes how trades must be managed.
Traders who adapt their execution to volatility protect themselves from unnecessary losses and maintain stable performance across different market conditions.
The market is never static.
Execution should not be either.

BITCOIN Bull vs Bear Cycle. Back to the Basics.There has been some confusion lately on whether Bitcoin (BTCUSD) is still on a Bear Cycle or not. Some still go as far as claiming that the market never entered a Bear Cycle and that based on some custom Liquidity Cycles that the -50% October - February crash has just been a 'normal' correction within a wider Bull Cycle. That is why today we decided to go back to the basics.
On the left side of the chart you see a clear Bull Cycle. Starting on a Bear Cycle bottom with the price confirming the Bull Cycle by breaking and closing above its 1W MA50 (blue trend-line), which up until that point has been the Bear Cycle's Resistance. What follows is a clear long-term uptrend with a streak of Bull Flags supported by the 1W MA50 until the eventual Bull Cycle Top.
On the right side of the chart you see a clear Bear Cycle. Starting on that exact Bull Cycle Top with the price confirming the Bear Cycle by breaking and closing below the 1W MA50, which up until that point (as mentioned) has been the Bull Cycle's Support. What followed up until today is a 6-month downtrend with so far two Bear Flags suppressed below the 1W MA50. The next Support in line is the 1W MA200 (orange trend-line).
And that's the structural difference between a Bull and a Bear Cycle. Same only inverse. So what BTC is currently at is a Bear Flag that is gearing up for the new Leg downwards. For reference we have taken the post June 2022 fractal (black trend-line) and added it as price action on the current Bear Cycle to see a projection of how it may unfold on a potential October 2026 bottom according to the 4-year Cycle Theory.
So that's it. Nothing more. If that helps a little clearing up the (understandable) confusion, I'd appreciate you telling us. Feel free to let us know in the comments section below!
---
** Please LIKE 👍, FOLLOW ✅, SHARE 🙌 and COMMENT ✍ if you enjoy this idea! Also share your ideas and charts in the comments section below! This is best way to keep it relevant, support us, keep the content here free and allow the idea to reach as many people as possible. **
---
💸💸💸💸💸💸
👇 👇 👇 👇 👇 👇

Liquidity Builds Before ExpansionLarge market moves rarely appear without preparation.
Before price expands strongly in one direction, the market usually spends time building liquidity.
This phase often looks uneventful on the chart. Price moves sideways, ranges develop, and momentum appears to fade. Many traders interpret this behavior as indecision or lack of opportunity.
In reality, this period often represents preparation for the next move.
Liquidity forms when traders place orders at predictable locations. Stop losses, breakout entries, and resting limit orders accumulate around visible highs, lows, and range boundaries. These orders create pools of liquidity that the market can later access.
When price trades within a range, both sides of the market gradually build exposure.
Breakout traders position above resistance.
Stop losses accumulate below recent lows.
Mean-reversion traders participate inside the range.
This concentration of orders provides the fuel required for a larger move.
Large market participants rely on liquidity to execute size efficiently. Without sufficient opposing orders, entering or exiting a large position becomes difficult. Consolidation phases help solve this problem by attracting participation and building order flow.
Once liquidity becomes concentrated enough, the market can move toward it.
This often begins with a sweep of one side of the range. Price briefly moves beyond a high or low, triggering stops and activating breakout orders. The resulting surge in activity provides liquidity for larger players to transact.
After that liquidity is absorbed, the market frequently moves in the opposite direction with increased momentum.
This sequence explains why many strong trends begin immediately after periods of consolidation.
What appears to be quiet price action is often the market preparing the conditions necessary for expansion.
Understanding this dynamic changes how traders interpret ranges.
Instead of viewing consolidation as wasted time, it becomes a signal that liquidity may be building. Traders begin watching range boundaries more closely, waiting for sweeps, rejection, or acceptance beyond key levels.
The goal is not to predict exactly when expansion will occur.
The goal is to recognize that expansion often requires preparation first.
Markets need liquidity to move.
Ranges help create it.
When traders understand this process, they stop forcing trades during quiet periods and start preparing for the moment when participation increases and the next directional move begins.

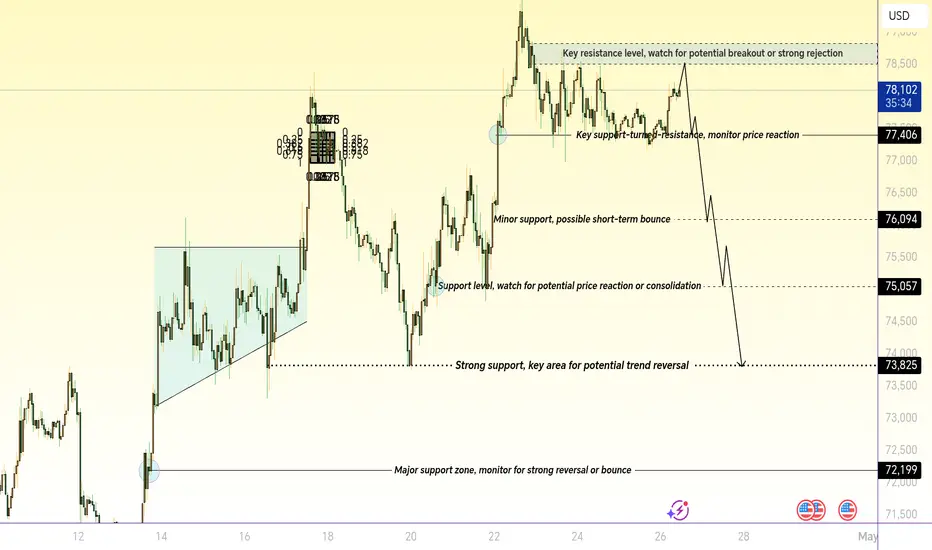
Bitcoin Price Analysis – Key Resistance, Support, and Trend LeveThis professional analysis of Bitcoin (BTC/USD) highlights key price levels, including 78,296 USD as a critical resistance level where price may face rejection. Watch for potential
breakout or reversal at this level
. 74,000 USD marks a significant support zone, likely to hold price and offer a potential bullish reaction. If the price approaches 71,019 USD, it will test a critical support level, with possible implications for either a reversal or breakdown.
The upward trend channel indicates strong bullish momentum, and further price action along the trend line will be essential for determining market direction. The next key support levels are 65,669 USD and 68,000 USD, where price may either find strong support or experience further declines.

Bitcoin | Bear Market Will Be Until Approximately September 2026Well, seems like timing is everything with each cycle where this time the bull market
Swallow Academy +/- 500 days, just as for the last 2 bull markets. And if we look at the previous bear markets, we had them for +/- 300 days, which gives us at least 5 more months of bloody markets, or as we would recall them, "a discount zone most traders will miss most probably."
So this is what it is all about, a reminder: there are times when it is best to buy something and there are times when it is best to sell something...History usually likes to repeat itself, as history is driven by people and their emotions...and people are pretty predictable.
5 more months to load up the bags; that's what we say
Swallow Academy

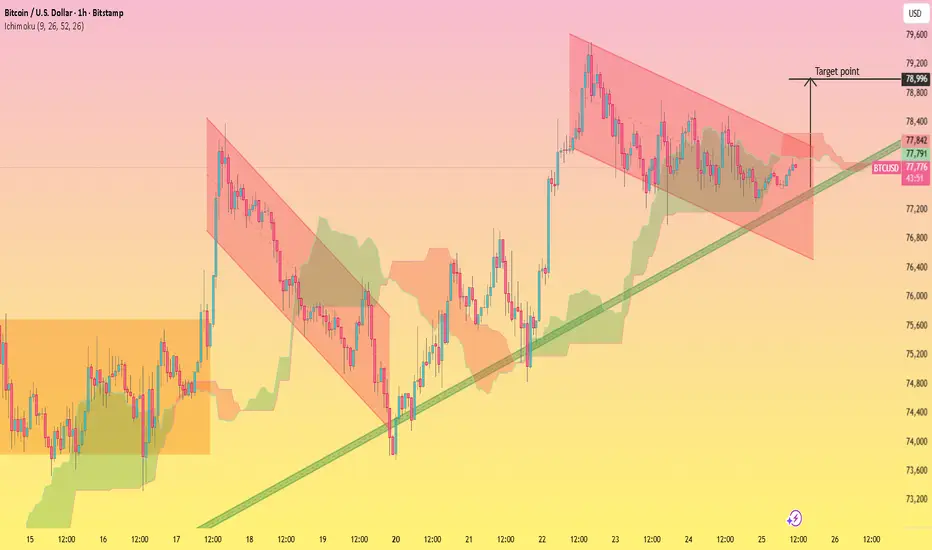
BTCUSD Descending Channel Breakout with Bullish Trendline..This 1H BTCUSD chart shows price previously respecting a **descending channel** (marked in red), indicating short-term bearish pressure. However, the structure shifted after a strong bullish impulse from the lower support area, where price bounced off a **rising trendline** (green).
Currently, price is consolidating inside a range while holding above the ascending trendline and partially supported by the Ichimoku cloud. The descending resistance is still in play, but momentum is slowly favoring buyers as higher lows are being formed.
A breakout above the descending channel resistance would confirm bullish continuation, especially if price sustains above the cloud and trendline confluence.
**🎯 Target:**
* **Primary Target:** 78,900 – 79,000 zone
* This aligns with the projected breakout move and prior resistance area.
**⚠️ Key Levels to Watch:**
* Support: 77,200 – 77,400 (trendline + cloud support)
* Resistance: 78,400 → 79,000 (channel top + target zone)
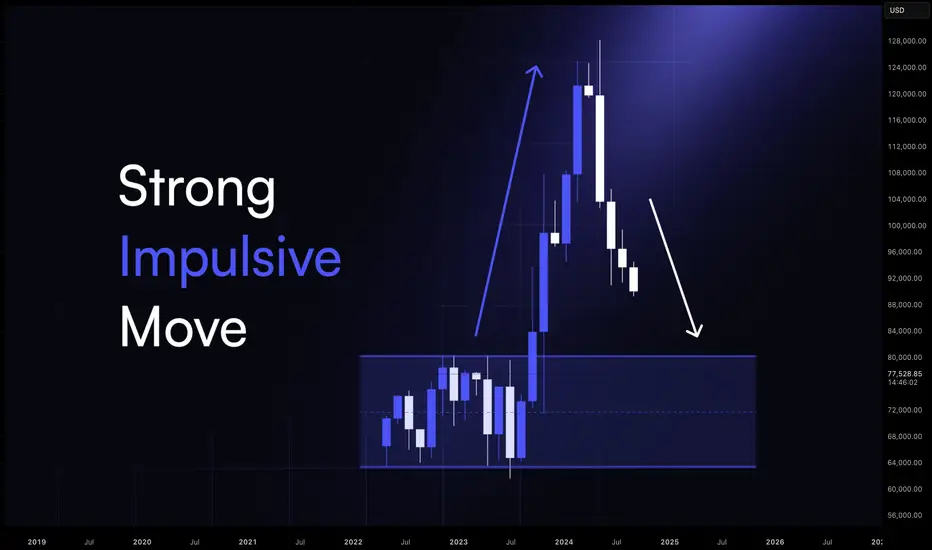
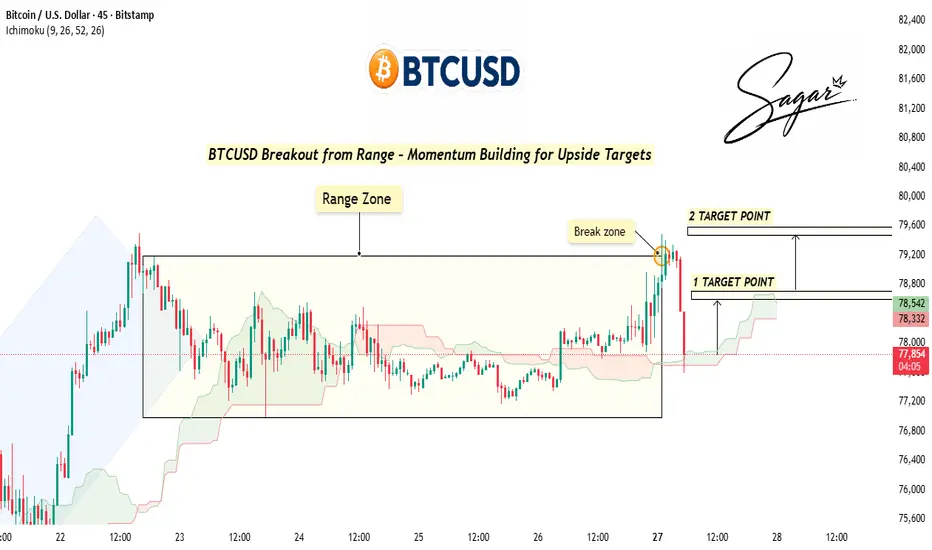
BTCUSD Range Expansion: Breakout Signals Bullish ContinuationBTCUSD has transitioned from a prolonged consolidation phase into a breakout scenario, clearing the upper boundary of the established range. This move signals a shift in market structure toward a bullish bias, supported by price holding above the Ichimoku cloud.
However, the immediate rejection after the breakout suggests potential short-term volatility, indicating either a liquidity grab or early profit-taking. For continuation, price must maintain strength above the breakout zone, which now acts as key support.
As long as this level holds, upside targets remain in focus near 78.8K and 79.6K. A failure to sustain above the breakout area could result in a pullback back into the prior range before any further directional move.
Bullish Structure Testing Key Support in BTCUSDI observed a strong bullish expansion where price broke out from a prior range and pushed aggressively upward, creating a series of higher highs with strong momentum. This move indicates clear demand dominance as the market transitioned from consolidation into an impulsive trend. However, after reaching a local high, price began to lose momentum and entered a corrective phase, forming lower highs and pulling back into a defined zone.
As the pullback developed, price moved into a layered support area, where multiple zones align, indicating a potential demand cluster. The decline into this area appears controlled rather than impulsive, suggesting it is a correction within the broader bullish structure rather than a full reversal. Recent price action shows a reaction from this zone, with buyers attempting to step in and stabilize the market.
Currently, price is consolidating within this support region, showing signs of absorption and reduced volatility after the pullback.
Speculative Outlook:
Price is now reacting from a key demand cluster, which acts as a critical decision area. If this zone holds, the market may resume its bullish trend and attempt to move back toward previous highs.
There is also a possibility of a liquidity sweep below the lower boundary of the zone, where price briefly dips, takes out stops, and then reverses upward.
However, if price breaks below this demand cluster with strong bearish momentum, it would weaken the bullish structure and suggest a deeper correction. This makes the current area a key decision point between continuation of the uptrend or a shift into a larger pullback.
