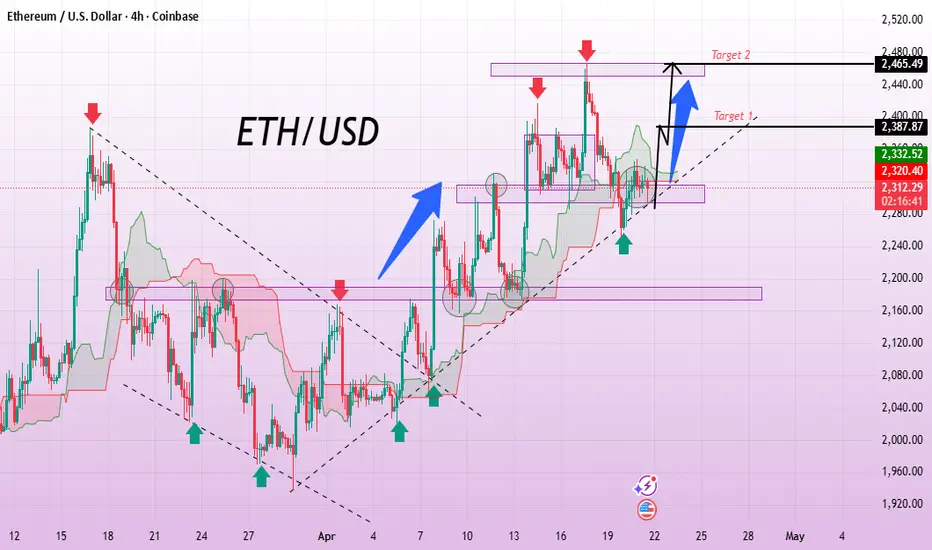
ETHUSD Targets Higher Zones with Buyer StrengthThe ETH/USD chart reflects a clear transition from a bearish phase into a developing bullish trend 📉➡️📈. Initially, price respected a descending channel, forming lower highs and indicating sustained selling pressure. However, a breakout above this structure marked a significant shift in momentum, supported by the formation of higher lows and strong bullish candles 🚀. The emergence of an ascending trendline highlights growing buyer control and market confidence. Currently, price is consolidating near a key support and resistance flip zone, suggesting accumulation before a potential continuation 🔄. If buyers maintain strength and push above nearby resistance, the first target is set at 2,387, aligning with a recent supply zone 🎯. Continued bullish momentum could extend the move toward the second target at 2,465, where a stronger resistance area may trigger profit-taking or a temporary pullback ⚠️. Overall, the structure favors bullish continuation while holding above support.
If you found this analysis helpful, don’t forget to LIKE 👍 and COMMENT 💬!
In-depth trading ideas
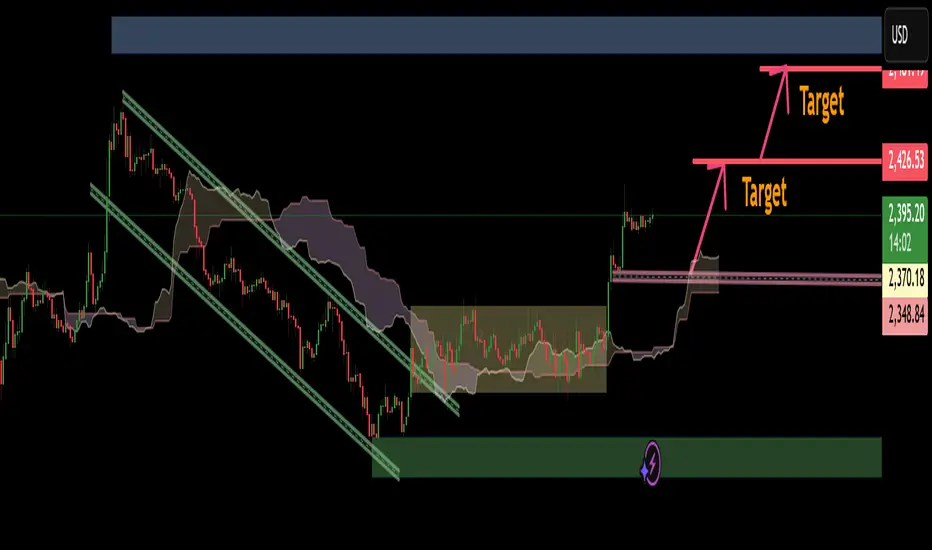
Accumulation Phase Leads to Bullish ExpansionThe chart illustrates a clear shift from a prolonged bearish trend into a consolidation phase, followed by a strong bullish breakout. Initially, price moved within a well-defined descending channel, confirming sustained selling pressure. After reaching a key demand zone, the market formed a sideways accumulation range, indicating absorption of selling liquidity and building bullish strength.
Price has now decisively broken above the range and the Ichimoku Cloud, signaling a strong change in market structure and momentum. The breakout is supported by impulsive bullish candles, showing aggressive buyer entry.
Currently, price is holding above a newly formed support zone (previous resistance), suggesting a healthy continuation setup. If this level holds, the market is likely to continue upward toward the projected targets:
First Target: 2,426.53 (intermediate resistance)
Final Target: 2,481.49 (major supply/liquidity zone)
Overall, the structure supports a bullish continuation scenario, where pullbacks into the support zone may offer potential buying opportunities, as long as price remains above the breakout level and cloud support.
Ethereum - Starting the 100% rally of 2026!🎀Ethereum ( CRYPTO:ETHUSD ) will double during 2026:
🔎Analysis summary:
Ethereum has been correcting over -50% after failing to create new all time highs back in 2025. But with this correction, Ethereum is now retesting a major confluence of support. Following the anticipated crypto bottom, Ethereum could then rally +100% during 2026.
📝Levels to watch:
$2,000
🙏🏻Trusting the Trading Gods

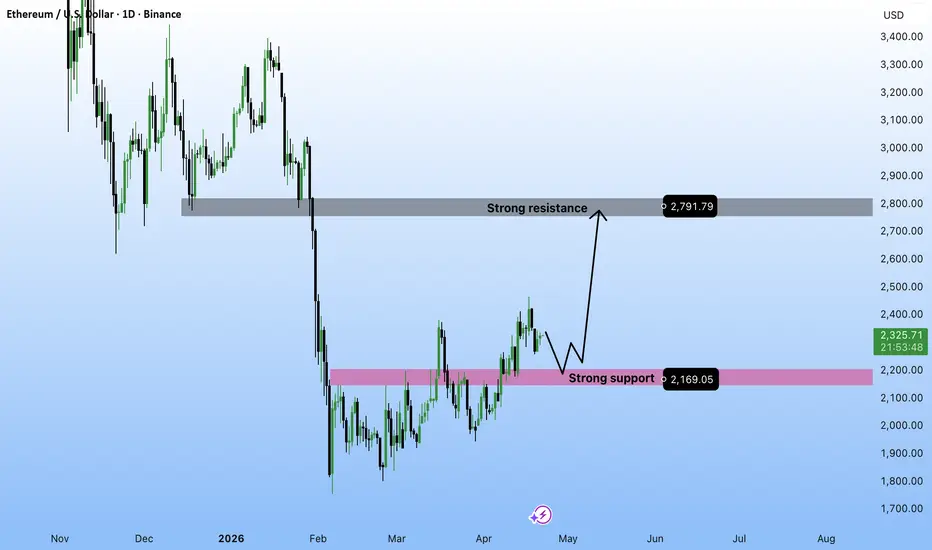
ETH Technical Setup: Accumulation Phase Before Breakout?Ethereum is currently showing a recovery structure after a strong rejection and breakdown earlier. Price has successfully bounced from a major support zone around 2,169, which is acting as a key demand area.
At the moment, ETH is trading near 2,325, attempting to build higher lows and continue its upward momentum.
Key Levels to Watch:
* Strong Support: 2,169
* Current Zone: ~2,300 – 2,350
* Major Resistance: 2,791
As long as price holds above the 2,169 support, the bullish structure remains valid. A continuation could push ETH towards the 2,700–2,800 resistance zone.
However, any rejection from current levels may lead to a pullback towards the support zone before the next move.
Overall, the market is showing signs of gradual accumulation with a potential upside continuation, but confirmation is required near resistance.
Not Financial Advice
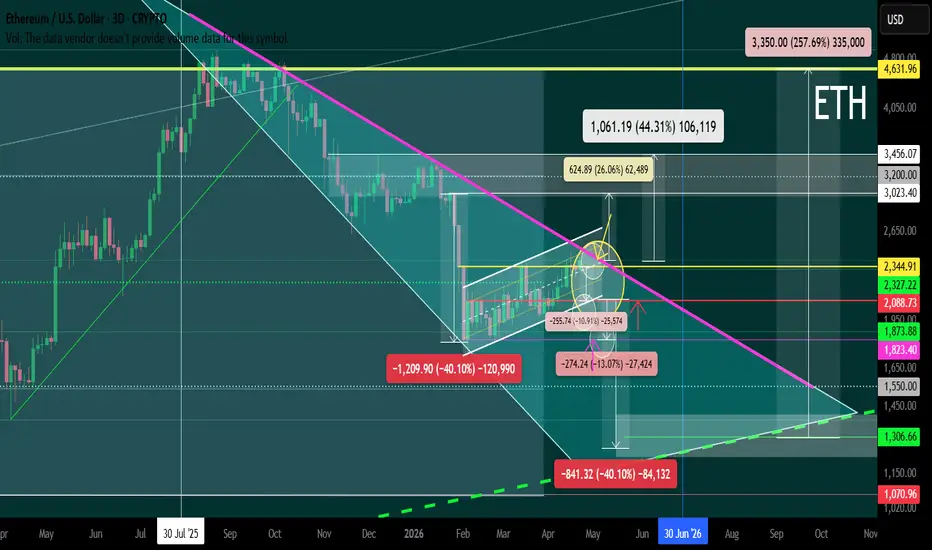
ETH/USD Local Trend. Reversal Zone. 04 2026Logarithm. 3-day time frame.
Main trend — ascending channel .
Secondary trend — horizontal channel.
Local trend — “microphone” pattern (a decline in an expanding cone toward the median of an ascending channel).
Very local — ascending channel toward the resistance of the microphone. In case of a breakout:
a) upward — a sloping pump cup toward the previous consolidation and slightly higher.
b) in case of a downward breakout — a descending pennant.
As always, all percentages from key reversal zones to key support/resistance zones are shown. Have a trading plan and manage your risks; don't exceed them. Be patient; the market doesn't owe you anything...
You can see this local reversal zone on the scale of the main trend of this banking-crypto asset in this previous idea by clicking the “play” button on the chart.
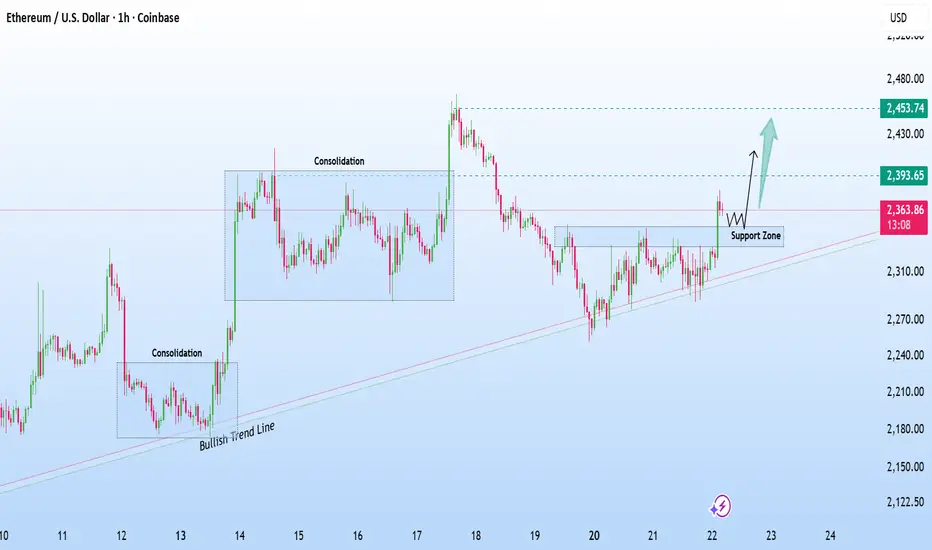
Ethereum is showing a strong bullish trend on the 1-hour📊 ETHUSD BUY SETUP 🚀🔥
🔍 Market Outlook:
Ethereum is showing a strong bullish trend on the 1-hour timeframe, with price respecting a key support zone around 2350. Buyers are stepping in, signaling potential upward momentum continuation.
📈 Trade Idea: BUY
🟢 Entry Zone: 2350 (Support Area)
🎯 Targets:
✅ TP1: 2390
✅ TP2: 2450
⚠️ Risk Management:
Always use a proper Stop Loss and manage your risk per trade. Smart trading is all about protecting your capital and staying consistent.
💡 Follow the trend, manage risk, and stay disciplined!
❤️ Like | 💬 Comment | 🔄 Share
Follow for more professional trade setups! 💰📊
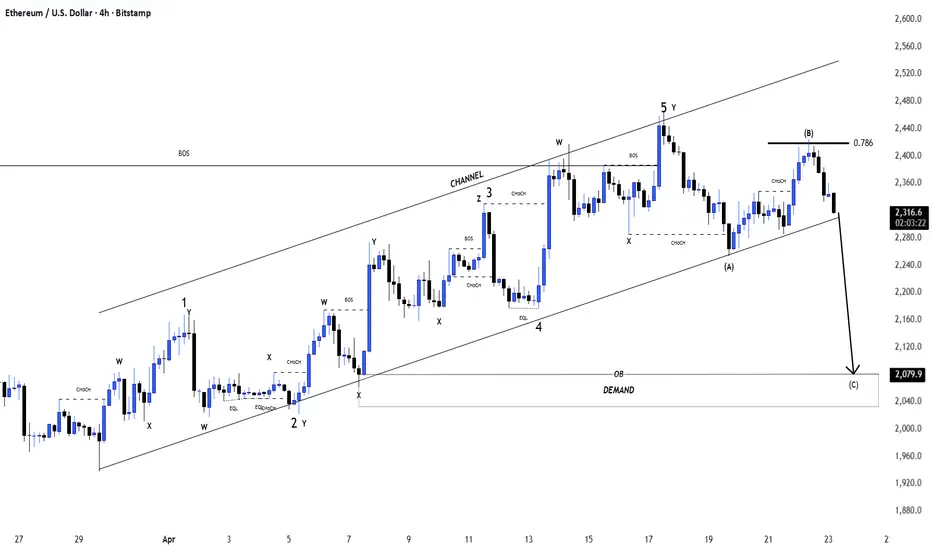
EthereumETHUSD
- Completed " 12345 " Impulsive Waves and " AB " Corrective Waves
- Break of Structure
- Fibonacci Level - 78.60%
- Bullish Channel as an corrective pattern in Short Time Frame
- Order Block
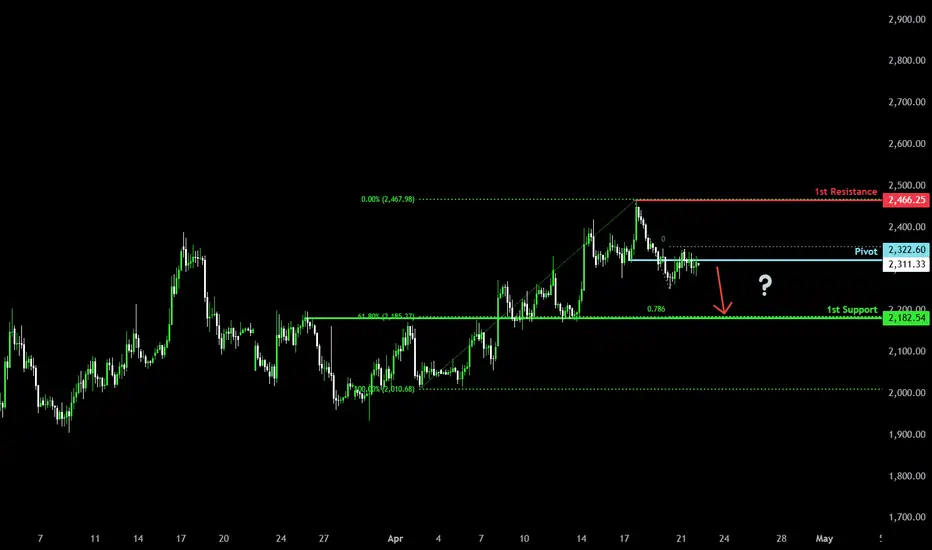
Bearish reversal setup?Ethereum (ETH/USD) is reacting off the pivot, which is a pullback resistance and could reverse towards the 1st support, which acts as an overlap support that aligns with the 61.8% Fibonacci retracement and the 78.6% Fibonacci projection.
Pivot: 2,322.60
1st Support: 2,182.54
1st Resistance: 2,466.25
Disclaimer:
The opinions given above constitute general market commentary and do not constitute the opinion or advice of IC Markets or any form of personal or investment advice.
Any opinions, news, research, analyses, prices, other information, or links to third-party sites contained on this website are provided on an "as-is" basis, are intended to be informative only, and are not advice, a recommendation, research, a record of our trading prices, an offer of, or solicitation for, a transaction in any financial instrument and thus should not be treated as such. The information provided does not involve any specific investment objectives, financial situation, or needs of any specific person who may receive it. Please be aware that past performance is not a reliable indicator of future performance and/or results. Past performance or forward-looking scenarios based upon the reasonable beliefs of the third-party provider are not a guarantee of future performance. Actual results may differ materially from those anticipated in forward-looking or past performance statements. IC Markets makes no representation or warranty and assumes no liability as to the accuracy or completeness of the information provided, nor any loss arising from any investment based on a recommendation, forecast, or any information supplied by any third party.
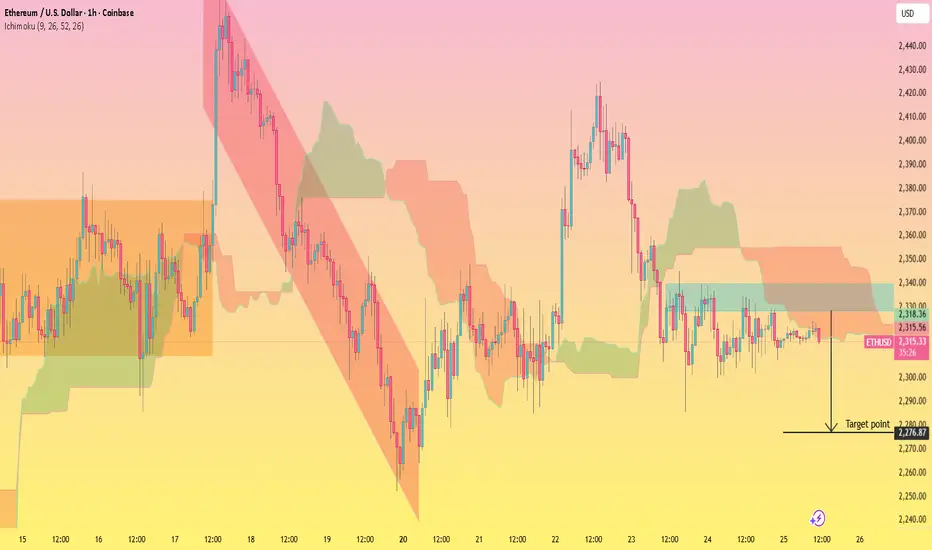
ETHUSD Bearish Range Consolidation with Downside TargetThis 1H ETHUSD chart highlights a clear **bearish trend structure** that originated from a descending channel (marked in red), where price respected lower highs and lower lows. After a strong sell-off, the market formed a temporary base and attempted a bullish push, but momentum weakened near resistance.
Currently, price is **consolidating below a key resistance zone (around 2,330 – 2,340)**, which aligns with the Ichimoku cloud acting as dynamic resistance. The repeated rejection from this area signals a lack of bullish strength, suggesting sellers are still in control.
The sideways movement indicates accumulation before a potential continuation move. If price fails to break above resistance, a bearish breakdown is likely.
**🎯 Target:**
* **Primary Target:** 2,276
* This level represents the next support zone and aligns with the projected breakdown move.
**⚠️ Key Levels to Watch:**
* Resistance: 2,330 – 2,340 (supply + cloud resistance)
* Support: 2,300 → 2,276 (breakdown zone and target)
**💡 Insight:**
As long as ETH remains below the resistance zone and inside the consolidation range, the bias stays **bearish**. A clean breakdown below 2,300 will likely accelerate selling toward the target, while a strong breakout above 2,340 would invalidate this setup.
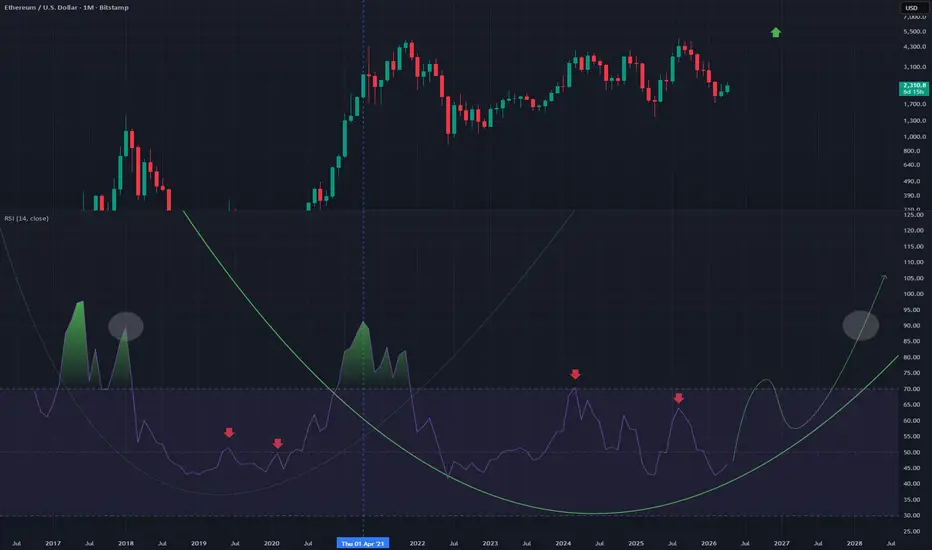
Really Watch ETHUSD RSI This is the Monthly chart for ETH
It shows however a rising RSI on this timeframe, very comparable to a previous situation on the RSI
I suggest a massive run up to complete this "u" shape pattern
Monthly timeframe remember so go long if you want to
ETH Daily – Bullish Shift After Engulfing Key Zone#Ethereum has engulfed the purple zone, which is a positive sign. From now on, our bias is more toward the upside, and we will be looking for long opportunities. There is a possibility of price reaching the yellow zones one after another. The possible scenarios are defined, and for now, we give more weight to the bullish scenario. We’re also keeping an eye on Bitcoin. Note that this is the daily timeframe. This analysis will be updated regularly.
Note that there was also a liquidity zone just behind this purple area, so we need to see how price reacts. Engulfing moves are not always successful. Proceed with caution.

Trade Plan: ETHUSDTrade Plan: ETHUSD
• Direction: Long
• Entry: 2341.82
• Stop Loss: 2280.00
• TP1: 2458.00
• TP2: 2580.00
• TP3: 2688.00
Take partial profits at each target, then trail stop to protect profits.
Analysis based on market structure, volume profile and harmonic pattern.
Not financial advice.

Bullish bounce off pullback support?Ethereum (ETH/USD) is falling towards the pivot, which is a pullback support that aligns with the 50% Fibonacci retracement and could bounce towards the 1st resistance.
Pivot: 2,164.55
1st Support; 1,947.06
1st Resistance: 2,621.89
Disclaimer:
The opinions given above constitute general market commentary and do not constitute the opinion or advice of IC Markets or any form of personal or investment advice.
Any opinions, news, research, analyses, prices, other information, or links to third-party sites contained on this website are provided on an "as-is" basis, are intended to be informative only, and are not advice, a recommendation, research, a record of our trading prices, an offer of, or solicitation for, a transaction in any financial instrument and thus should not be treated as such. The information provided does not involve any specific investment objectives, financial situation, or needs of any specific person who may receive it. Please be aware that past performance is not a reliable indicator of future performance and/or results. Past performance or forward-looking scenarios based upon the reasonable beliefs of the third-party provider are not a guarantee of future performance. Actual results may differ materially from those anticipated in forward-looking or past performance statements. IC Markets makes no representation or warranty and assumes no liability as to the accuracy or completeness of the information provided, nor any loss arising from any investment based on a recommendation, forecast, or any information supplied by any third party.

eth to reclaim the upwards momentum #eth i propose eth is having a small pull back and still with in upwards bullish momentum, to reclaim the blue upward channel and head toward 3400 over the next upand coming days , this supports spot trading and interday trading with low leverage . #eth
I am not a financial advisor , this is my thoughts i like to share, and the direction i am trading

ETH/USD 4H Market Analysis📊 ETH/USD 4H Market Analysis – Bullish Structure with Pullback Opportunity 🚀
🧠 Market Overview
Ethereum is maintaining a clear bullish market structure, printing higher highs and higher lows after a strong impulsive move. Price is currently in a controlled retracement phase, not a reversal.
🔍 Key Technical Insights
📈 Bullish Momentum
Strong upward impulse confirms buyers are in control
Structure remains intact above previous higher low
📦 Demand Zone (Support)
Highlighted zone around 2,240 – 2,280 acting as a key institutional demand area
Price is reacting near this zone → potential accumulation
🔝 Resistance / Liquidity
Major high around 2,480
This level is likely holding liquidity (target for bullish continuation)
🎯 Trading Scenario
🟢 Bullish Setup (Preferred)
Expect a dip into demand zone → liquidity sweep
Followed by strong bullish reaction
Target: 2,480 (previous high / liquidity zone)
🔻 Bearish Risk
If price breaks and closes below demand zone
Structure weakens → possible deeper retracement
⚖️ Conclusion
Market is bullish overall, current move looks like a healthy pullback into demand.
As long as price holds the zone, probability favors a continuation to the upside.

1H chart of Ethereum...1H chart of Ethereum, price just rejected a resistance zone (~2390–2400) and broke down from the short-term structure.
📉 Bearish Target Levels:
Primary target: 2270–2280 (my marked level + trendline support confluence)
If breakdown continues:
2220–2240 (next demand zone)
2150 (stronger lower support)
📊 Key Observations:
Clear rejection from supply zone (top grey box)
Range breakdown after consolidation (middle grey box)
Price losing trendline support → bearish momentum building
⚠️ Invalidation:
If price reclaims 2380–2400, bearish setup weakens

EthUSD. Ethereum USD1. Market Structure (Higher Timeframe)
Price formed a macro range between 2022–2025.
The range high was taken (buy-side liquidity sweep), followed by failure to continue higher.
This indicates distribution after liquidity grab, suggesting bearish intent.
2. Liquidity Overview
Buy-side liquidity (BSL): Taken above previous highs (~4.8k–5k).
Sell-side liquidity (SSL): Resting below equal lows (marked on chart).
Price is currently positioned closer to SSL, making downside the more likely draw.
3. Key Zones Identified
W
eekly Supply / Order Block (Red Zone):
Origin of strong downward displacement.
Likely area for institutional selling.
Mid-Range Demand / Reaction Zone (Blue Zone):
Acting as temporary support.
Not a strong origin, more of a reaction/inefficiency area.
Weekly Demand (Green Zone):
Major higher timeframe support.
Likely target for price if bearish continuation occurs.
4. Current Price Behavior
Price is showing a corrective bounce from mid-range support.
No strong bullish displacement → suggests lack of real buying strength.
Current move appears to be retracement, not reversal.
5. Expected Price Path (Narrative)
Price continues upward into weekly supply (red zone).
Rejection occurs → shift in lower timeframe structure (MSS).
Price sells off, targeting:
Equal lows (SSL)
Then potentially deeper into weekly demand (green zone).
From there, possible higher timeframe accumulation and reversal.
6. Probability Assessment
Primary scenario (bounce → drop): 60–70%
Bullish breakout above supply: 20–25%
Immediate drop without retracement: 10–15%
7. Execution Model (Refined Approach )
Do not blindly sell the supply zone.
Wait for confirmation:
Lower timeframe market structure shift (MSS)
Strong bearish displacement
Enter on retracement into:
Fair Value Gap (FVG) or mitigation zone within supply

Correction Not Over Yet – EthereumOver the past two to three days, as I review some cryptocurrencies, I mostly see a 15–20% move in them, followed by a continuation of their correction.
Regarding Ethereum, save the lines I have drawn somewhere.
Ethereum will more or less continue this path over the next two to three months.

ETH/USD Market Analysis📊 ETH/USD Market Analysis – Bullish Pullback Toward Demand 🚀
The chart shows a clear bullish structure on the 4H timeframe, with price respecting an ascending channel (higher highs & higher lows). However, recent price action suggests a healthy correction phase rather than a full trend reversal.
🔍 Key Observations
📈 Bullish Trend Intact
Price has been moving within a rising channel, confirming strong upward momentum.
🧱 Resistance Rejection
Price faced a sharp rejection from the marked resistance zone (~2450 area), indicating strong supply pressure at the top.
📉 Pullback to Demand Zone
Current retracement is approaching a demand zone (~2285–2255), which aligns with:
Previous structure support
Ascending trendline support
🔄 Potential Reversal Zone
The confluence of demand + trendline suggests a high-probability bounce area.
🎯 Trade Idea
🟢 Bullish Scenario (Preferred)
If price holds the demand zone:
Expect continuation toward target zone (~2450 resistance)
Confirmation needed via bullish candles / rejection wicks
🔴 Bearish Scenario (Invalidation)
If price breaks below demand + trendline:
Structure weakens
deeper correction toward lower support (~2000 zone)
🧠 Smart Insight
This looks like a classic “buy-the-dip” setup in an uptrend — but only if buyers defend the demand zone. Patience for confirmation is key.
⚡ Conclusion:
Market remains bullish overall, and this pullback could offer a strategic entry opportunity if support holds.

ETHUSD: Trade it based on this level.Ethereum has marginally turned bearish on its 4H technical outlook (RSI = 43.360, MACD = 114.300, ADX = 62.840) as it crossed unde its 4H MA50 and is failing to recover it. The 1 month pattern remains a Channel Up though so trade accordingly. As long as the S1 holds, target the R1 and the 4H MA50 (TP = 2,350). If the S1 (and the 4H MA100) fails, target the 4H MA200 and S2 (TP = 2,180).
## If you like our free content follow our profile to get more daily ideas. ##
## Comments and likes are greatly appreciated. ##

ETH/USD: Weekly MACD Bullish Crossover Indicates Potential UpsidObservation:
A review of the Ethereum (ETH/USD) weekly chart reveals a consistent historical correlation between weekly MACD bullish crossovers and significant price appreciation.
Historical Performance:
Over the last three instances where the weekly MACD crossed bullishly, ETH experienced substantial rallies:
Oct 2023: +113%
Nov 2024: +44%
May 2025: +90%
Current Setup:
As of April 2026, the weekly MACD has registered a new bullish crossover. Price action has recently formed higher lows off the $1,740 macro support and is currently trading near the $2,310 level. Based on the historical precedent of this specific indicator setup, the probability favors a bullish continuation.
Trade Parameters:
Entry: Current market price (~$2,310)
Target 1: $3,400 (Previous structural resistance)
Target 2: $4,800 (Re-test of macro highs)
Invalidation / Stop Loss: A weekly close below the recent higher low at $1,940, or the macro support at $1,740.
Disclaimer: This is a technical observation based on historical data, not financial advice. Manage your risk accordingly.

#ETH/USD Buy Trade Scenario.Here’s an up-to-date #ETH/USD Buy trade outlook (technical + fundamental) to help you assess whether positioning for a Upside makes sense right now.
Thank You......

ETHUSD remains under bearish pressure below 2,500 levelThe ETHUSD pair continues to display a bearish outlook, in line with the prevailing downward trend. Recent price action suggests an oversold bounce back, potentially setting up for another move lower if resistance holds.
Key Level: 2,500
This zone, previously a consolidation area, now acts as a significant resistance level.
A failed test and rejection at 2,500 would likely resume the bearish momentum.
Downside targets include:
2,280 – Initial support
2,190 – Intermediate support
2,120 – Longer-term support level
Bullish Scenario (breakout above 2,500):
A confirmed breakout and daily close above 2,500 would invalidate the bearish setup.
In that case, potential upside resistance levels are:
2,556 – First resistance
2,625 – Further upside target
Conclusion
ETHUSD remains under bearish pressure, with the 2,500 level acting as a key inflection point. As long as the price remains below this level, the bias favours further downside. Traders should watch for price confirmation around that level to assess the next move.
This communication is for informational purposes only and should not be viewed as any form of recommendation as to a particular course of action or as investment advice. It is not intended as an offer or solicitation for the purchase or sale of any financial instrument or as an official confirmation of any transaction. Opinions, estimates and assumptions expressed herein are made as of the date of this communication and are subject to change without notice. This communication has been prepared based upon information, including market prices, data and other information, believed to be reliable; however, Trade Nation does not warrant its completeness or accuracy. All market prices and market data contained in or attached to this communication are indicative and subject to change without notice.
