Crude Oil – Sell around 89.00, target 82.00-78.00Crude Oil Market Analysis:
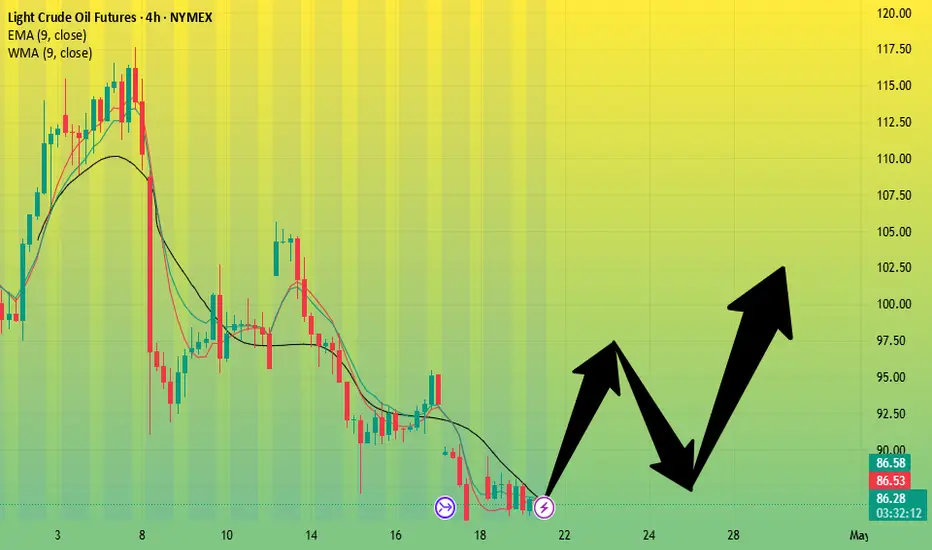
Is the Crude Oil Buying Stuck? The biggest question in the market these past two days has been whether the previously strong crude oil buying trend has any hope. The more tense the situation in the Middle East, the stronger the crude oil buying became. Recently, with the situation easing, crude oil buying has seen a significant pullback. In the short term, I lean towards a continued recovery in crude oil prices. Both buying and selling are possible, but consider selling when crude oil approaches the resistance level around 89.
Fundamental Analysis:
Our current focus is on the new developments in the US-Iran negotiations and the Federal Reserve's new monetary policy.
Trading Recommendation:
Crude Oil – Sell around 89.00, target 82.00-78.00
Light Crude Oil Futures
No trades
In-depth trading ideas
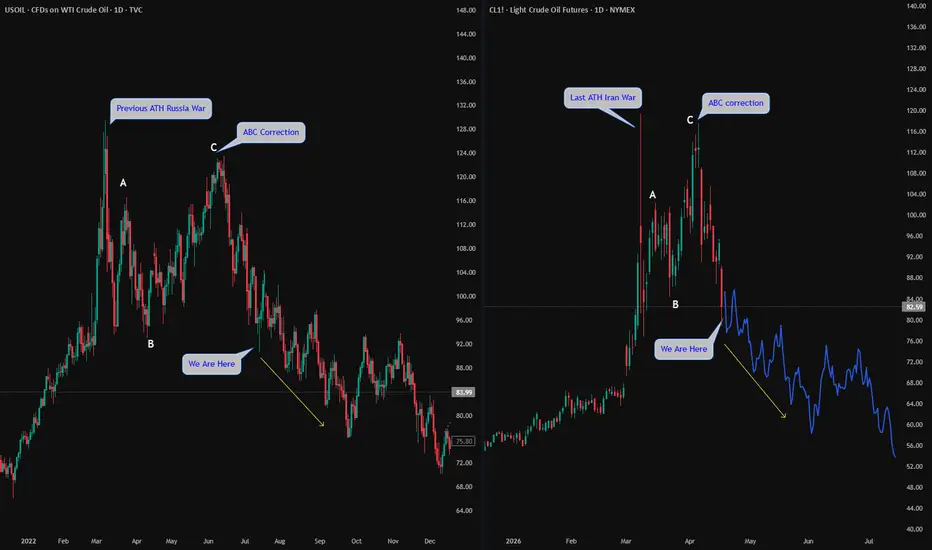
USOIL - Is repeating the Russia war fractalThis fractal is working fine until now.
I have used this information in my last idea:
If this continue, we can expect chopping price action and lower prices.
Please don’t forget to like and share your thoughts in the comments!
Coffee is going higher4.24. In a broader sense coffee has pretty good range if you look at the size of the swings and now it's been going lower but if you open up the chart you'll see that the market gives you very nice swings and you want to take those swings in the opposite direction of where the market.
The market recently had a swing that was very bearish and now it is at a support area where we could take a small stop and then we wait to see if the market continues going higher. It is worth the risk with a very small protective stop.

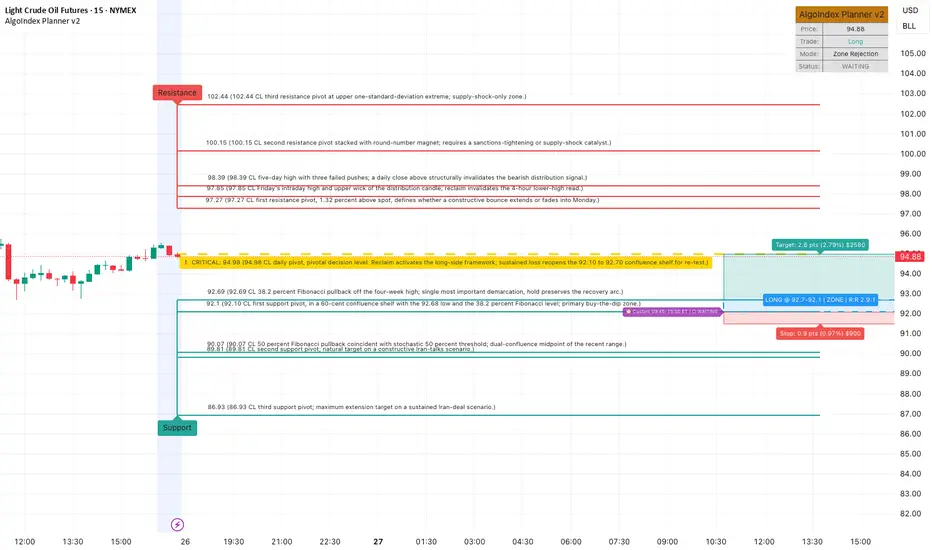
Crude Oil (CL) Analysis, Key Zones & Setup for Monday (April 27)Crude oil settled the week at 94.40 after a violent gap-and-fade session that opened at 96.62, pushed an early swing to 97.85, then unwound 5.17 dollars of range to 92.68 before stabilizing into the 2:30 PM ET pit close. Net change was a 1.45 dollar loss, a 1.51 percent decline, but the close at 33.27 percent of the daily range, lower third, is the more important read: a decisive distribution candle at the upper end of the multi-week recovery off the April 17 low at 78.97. The 92.68 intraday low tagged the 38.2 percent Fibonacci pullback off the four-week high to the basis point, which is where the only material defensive bid of the day stepped in.
The session character was crude-specific rather than macro-driven. The dollar index closed soft at 98.51 (down 0.29 percent), the volatility index dropped to 18.70 (down 3.11 percent), and equities ran risk-on with the S&P 500 E-mini up 0.72 percent and Nasdaq-100 E-mini up 1.86 percent on chip leadership. Crude diverged from that risk-on backdrop, which reads as positioning unwind at the upper end of the recovery range rather than a macro demand signal. The defining moment was the 95.00 round-number break with no defensive bid that opened a thin-liquidity pocket down to the 92.69 Fib zone.
The afterhours and weekend setup is dominated by one binary catalyst. Saturday April 25 is calendared as a tentative all-day round of US-Iran talks, and Treasury Secretary Bessent confirmed late this week that US sanctions waivers on Iranian and Russian crude will not be extended. The Sunday 6:00 PM ET Globex re-open will price whatever readout emerges from Saturday's session. The overnight question is binary: a constructive talks outcome unlocks marginal Iranian supply and pressures the front contract toward the 89-90 zone, a no-deal outcome with sanctions intact preserves the supply premium and reopens the 97 first-resistance pivot. Implied volatility on the May 14 strip at 86.66 percent is correctly pricing this binary. Overnight gap risk is materially elevated.
News & Macro Context:
The dominant catalyst complex is the Saturday April 25 US-Iran talks window. Headlines this week have been mixed: the United States said direct talks are on, Iran disputed via a Pakistan-meeting confusion, and Treasury Secretary Bessent confirmed waivers on Iranian and Russian oil will not be extended. The base case is that no actionable deal emerges from Saturday's session and sanctions persist, which preserves the structural supply premium that has carried crude up 65.58 percent year-to-date. A constructive surprise, however, would price in roughly 1 to 1.5 million barrels per day of marginal Iranian supply over a phased timeline and compress the front contract materially toward the 89.81 second-support pivot. This is the single highest-variance event in the forecast window.
The supply and demand data flow is structured around the next two scheduled catalysts. The most recent weekly inventory report on Wednesday April 22 is the latest official data point in scope. The next API estimate releases Tuesday April 28 at 4:30 PM ET, and the next official EIA Weekly Petroleum Status Report releases Wednesday April 29 at 10:30 AM ET. Tuesday's API and Wednesday's EIA prints are the operative scheduled catalysts: a draw across crude, gasoline, and distillates would extend the bull case on physical tightness, while an unexpected build (especially in Cushing storage) would compound the technical distribution signal from Friday's candle. Refinery utilization heading into peak summer driving prep is seasonally important; a strong utilization print would imply demand pull and is bullish.
The macro horizon includes the FOMC meeting next Wednesday April 29 at 2:00 PM ET, a first-order dollar event that transmits to crude via DXY. OPEC+ remains in compliance hold with no JMMC ministerial calendared inside the next two weeks, leaving Saudi Arabia's voluntary 1 million barrel per day cut and the broader OPEC+ 2.2 million barrel per day collective restraint as the operative supply policy. CFTC Commitment of Traders data published Friday at 3:30 PM ET shows money manager net length still elevated relative to the trailing 12-month range after the 65.58 percent year-to-date rally, with commercial hedgers continuing to add short hedges into the strength. The setup is mature: spec longs are extended, commercial shorts are growing, and a weekly close below the 92.04 moving average shelf would provide the technical trigger for a spec-length unwind.
Volatility and Positioning:
Volatility and positioning context. Crude has no liquid options proxy, COT, inventory, and the macro stack are the primary positioning inputs. Implied volatility on the May 14 monthly options strip is 86.66 percent, modestly above 14-day historic volatility of 82.09 percent, indicating the options market is paying a small risk premium for the binary geopolitical catalyst window. The 14-day average true range of 6.64 dollars (7.03 percent of spot) and the 14-day average daily range of 6.10 dollars (6.46 percent) put crude well above the historical 2-4 percent baseline, which mechanically demands wider stop buffers (minimum 1.50 to 2.00 dollar buffer on directional setups) and reduced position sizing (roughly half of an equity index futures equivalent on a per-contract risk basis).
Physical-market read is structurally tight. Forward curve shape (June front-month versus second-month deferred) held in modest backwardation into the close, indicating physical tightness has not unwound despite the 9.53 percent retracement off the March 9 high at 104.34. Brent-WTI spread held in the normal 4 to 5 dollar premium range with no dislocation flagged. Gasoline and heating oil crack spreads remain firm, supportive of refinery run rates entering the May to September peak driving season. OPEC+ spare capacity estimates remain at the 4 to 5 million barrel per day range, providing the structural ceiling on any sustained supply-shock spike. These physical-market reads matter more for crude positioning than any single options surface and frame the curve as physically-tight with geopolitical premium layered on top.
Technical-volatility context. The 20-day average true range is 6.37 dollars (6.74 percent), the 9-day average true range is 6.66 dollars (7.05 percent), and the one-ATR projected range from Friday's settle frames a 87.76 to 101.04 envelope over the next session. The 14-day stochastic K is 69.52 (firm but not overbought), the 9-day stochastic K is 81.42 (upper territory), and the multi-indicator composite reads 80 percent buy with strong strength and strengthening direction. The 20-day average directional index at 32.25 with positive directional indicator above negative directional indicator confirms the trend is intact and strong. Crude positioning frames as physically-tight with geopolitically-premiumed front-end and a mature spec-long setup vulnerable to a sanctions-positive Iran outcome.
Forecast:
Overnight: The Sunday 6:00 PM ET Globex re-open is the highest-variance event in the forecast window. Base case (55 percent probability), no actionable Iran readout emerges Saturday, expect a flat-to-slightly-firm re-open in the 93.50 to 95.50 band with overnight bias to test the 94.98 daily pivot from below. Constructive Iran scenario (25 percent probability), gap lower 1 to 3 dollars into the 90 to 91 zone with continuation pressure into the 89.81 second-support pivot. Hawkish Iran/sanctions scenario (20 percent probability), gap higher 1 to 2 dollars into the 95.50 to 96.50 zone with momentum continuation toward the 97.27 first-resistance pivot. Asian session liquidity is thin so the magnitude of any gap will be amplified relative to the underlying news.
AM Session: The 9:00 AM ET pit open is the directional confirmation moment. With no first-order US data on Monday morning relevant to crude (Treasury auctions are US-rate events with secondary transmission), the focus is purely on follow-through of the overnight gap and the re-test of the 94.98 daily pivot. Bias is for the morning to set the directional tone for the week heading into Tuesday's 4:30 PM ET API and Wednesday's 10:30 AM ET EIA. Expected first-hour range absent geopolitical headline shock is 1.50 to 2.50 dollars.
PM Session: Treasury auctions land mid-session, US 2-Year Note at 11:30 AM ET (high yield 3.936 percent prior, bid-to-cover 2.440 prior) and US 5-Year Note at 1:00 PM ET (high yield 3.980 percent prior, bid-to-cover 2.290 prior); both are dollar-rate events with secondary transmission to crude via DXY. ECB's Schnabel speaks at 12:30 PM ET, only material if she shifts hawkish on euro path versus dollar. The 2:30 PM ET NYMEX pit close is the structural close. Bias is to fade morning extremes into the close as positioning rebalances ahead of Tuesday's API print.
Daily Close: Bias is mildly bearish-with-distribution into Monday's close given Friday's 33.27 percent close-of-range candle, but mean-reverting to 94.40 in any quiet session. Most likely close range absent fresh geopolitical news: 93.50 to 95.00. Pivotal decision level is 94.98 daily pivot, reclaim activates the long-side framework, sustained loss reopens the 92.10 to 92.70 confluence shelf for re-test.
Expected Range: 92.80 to 96.20 (340 cents). Implied 1-Day Move 3.6 percent on crude (well below the 14-day ATR baseline of 7.03 percent, suggesting a quieter consolidation day absent geopolitical headline shock).
Most Likely Path: Path A (40 percent): "Mean-revert toward 94.40 settle", Sunday opens flat-to-firm 93.50 to 95.50, London pulls back toward 94.40, Monday morning tests 94.98 pivot from below, holds 93.50 to 94.50 zone into close. A flat to mildly negative day. Path B (25 percent): "Constructive Iran gap-down", Sunday gaps lower 1 to 3 dollars on supply-positive readout, breaks 92.10 first support pivot, extends to 89.81 second support with London and AM continuation, closes near 90 zone. A 4 to 5 percent down day. Path C (20 percent): "Hawkish Iran gap-up", Sunday gaps higher 1 to 2 dollars on sanctions-tightening rhetoric, AM session pushes 96.50 to 97.30 R1 zone, fade-the-rally crowd takes profits in PM, closes 95 to 96. A 1 to 2 percent up day. Path D (15 percent): "Surprise-supply geopolitical spike", Hormuz-region escalation or Saudi or Russia signal, gaps above 97.30, runs the 100.15 round, closes 98 to 100. A 4 to 6 percent up day. Crude's elevated 7 percent daily ATR makes Paths C and D not optional, both must be respected even on a "quiet" day, and Path B requires explicit gap-risk management on Sunday open.
Monday Events:
- 01:00 ET Japanese Leading Indicator Change Revision (prior 0.3)
- 03:00 ET German GfK Consumer Sentiment (forecast minus 30, prior minus 28.0)
- 06:00 ET UK CBI Distributive Trades (forecast minus 40, prior minus 52)
- 11:30 ET US 2-Year Note Auction (high yield prior 3.936 percent, bid-to-cover 2.440)
- 12:30 ET ECB's Schnabel Speaks
- 13:00 ET US 5-Year Note Auction (high yield prior 3.980 percent, bid-to-cover 2.290)
- Saturday April 25 Tentative All-Day US-Iran Talks (KEY first-order overnight catalyst for crude)
- Tuesday April 28 16:30 ET API Weekly Statistical Bulletin (next scheduled supply data point)
- Wednesday April 29 10:30 ET EIA Weekly Petroleum Status Report (key first-order weekly catalyst)
Resistance:
- 97.27 CL First resistance pivot, 1.32 percent above spot, prior session rejection wicks within 60 cents over the past five sessions, defines whether a constructive bounce extends or fades
- 97.85 CL Friday's intraday high and upper wick of distribution candle, reclaim invalidates the 4-hour lower-high read and re-engages the prior week's high zone
- 98.39 CL Five-day high with three failed pushes, caps the recent recovery and defines the near-term distribution ceiling, daily close above structurally invalidates the bearish distribution signal
- 100.15 CL Second resistance pivot stacked with round-number psychological magnet, last printed during 1-month high run April 7, requires sanctions-tightening or supply-shock catalyst
- 101.17 CL One-month high (April 7), local recovery target if structural uptrend reasserts on a sanctions-positive Iran outcome
- 102.44 CL Third resistance pivot at upper one-standard-deviation extreme, supply-shock-only zone
- 104.34 CL Fifty-two-week high (March 9), the all-time-high marker for the current cycle, maximum extension target in any blow-off scenario
Support:
- 94.98 CL Daily pivot, spot closed below by 58 cents into the weekend, first level to recover on a constructive Globex re-open
- 93.16 CL Where price crosses 18-day moving average shows stalling, sub-pivot below the daily pivot
- 92.69 CL 38.2 percent Fibonacci pullback off four-week high, the single most important demarcation, hold preserves recovery arc, break opens the lower 90s
- 92.68 CL Friday's intraday low, tagged the 38.2 percent zone to the basis point, only material defensive bid of the session, clean break is the structural sell signal
- 92.10 CL First support pivot, stacked with the 92.68 low to form a 60-cent confluence shelf with the 38.2 percent Fibonacci level, primary buy-the-dip zone on a no-deal Iran outcome
- 92.04/92.06 CL 5-day and 20-day moving averages essentially overlapping, break triggers trend-following sell signals on multiple systems simultaneously, first technical break of the broader uptrend
- 90.94 CL Lower one-standard-deviation band, first volatility-extreme support after the Fib zone fails
- 90.07 CL 50 percent Fibonacci pullback off four-week high coincident with stochastic 50 percent threshold, dual-confluence midpoint of the recent range
- 89.81 CL Second support pivot, natural target on a constructive Iran-talks scenario
- 86.93 CL Third support pivot, maximum extension target on a sustained Iran-deal scenario
How I'm seeing it:
- Friday's session printed a decisive distribution candle at the top end of the multi-week recovery: gap up open at 96.62, push to 97.85, full unwind through 5.17 dollars of range to 92.68, close in the lower third at 94.40. The character was crude-specific selling against a risk-on equity backdrop, which reads as positioning unwind rather than macro demand rotation. The 92.68 low tagged the 38.2 percent Fibonacci pullback off the four-week high to the basis point, where the only material defensive bid of the day stepped in.
- The daily candle is a long-upper-wick, lower-third-close formation against a still-bullish moving average stack. Spot remains above the 5, 20, 50, 100, and 200-day moving averages, the multi-indicator composite remains 80 percent buy with strong strength and strengthening direction, and the 20-day average directional index at 32.25 with positive directional indicator above negative directional indicator confirms the trend remains intact and strong. The pullback is inside trend, not a trend break.
- The mechanical activation threshold for Monday is the 92.10 to 92.70 confluence shelf (first support pivot stacked with 38.2 percent Fibonacci pullback and the 5 and 20-day moving average pair at 92.04 to 92.06). A constructive defense of this zone on the Sunday Globex re-open or Monday morning re-engages the structural uptrend; a clean loss of 91.50 with negative directional indicator crossing positive triggers a spec-length unwind toward 89.81 then 86.93.
- The geopolitical fat-tail driver is binary: Saturday April 25 tentative US-Iran talks. A constructive readout unlocking a phased path to lifting Iran sanctions prices in roughly 1 to 1.5 million barrels per day of marginal supply, gap risk is a 1 to 3 dollar Sunday open lower into the 90 to 91 zone. A no-deal outcome with sanctions intact preserves the supply premium and reopens 97.27 for re-test. Crude gaps on geopolitical headlines more than any other major futures contract, the Sunday Globex open requires explicit gap-risk position management.
- Cross-asset signal frame is supportive in aggregate. Dollar index at 98.51 down 0.29 percent and softer through the week is constructive for dollar-denominated crude. The volatility index at 18.70 down 3.11 percent is risk-on. Brent-WTI spread held normal 4 to 5 dollar premium with no dislocation. Gasoline and heating oil cracks remain firm into the seasonally-bullish summer driving setup. The cross-asset backdrop favors the long-side technical framework absent geopolitical override.
- Broader trend framing: crude is up 65.58 percent year-to-date, 14.30 percent over the past five sessions, and currently sits 9.53 percent off the March 9 fifty-two-week high at 104.34. The 14-day relative strength index at 56.05 has room to either side, the 14-day average directional index at 26.32 is moderate-strong, and the moving average stack remains in clean bullish alignment. This is consolidation pause inside trend, not a trend-ender, unless the 92.04 weekly moving average shelf gives way on a sustained close, which would be the first technical signal of broader trend deterioration.
- Primary Setup: Long crude 92.10 to 92.70 entry zone, stop 91.50 (below the 5 and 20-day moving average pair, structural break of the trend, 60 to 120 cent buffer), T1 94.98 (daily pivot reclaim), T2 97.27 (first resistance pivot), T3 runner 100.15 (second resistance pivot and round-number magnet, contingent on sanctions-tightening Iran outcome). R:R to T2 roughly 4.7 to 1
- Alternate Setup: Short crude rallies into 96.50 to 97.30 entry trigger after a Sunday Globex hawkish-Iran gap higher that fails to breach R1 with momentum, stop 98.10 (above the 97.85 Friday high with 25 cent buffer, total risk roughly 90 cents), T1 94.98 (daily pivot return), T2 92.70 (38.2 percent retracement re-test), T3 runner 89.81 (second support pivot, contingent on geopolitical shock that resolves bearish). R:R to T2 roughly 5.2 to 1. Sizing note: crude's 7 percent ATR demands roughly half the contract count of an equivalent equity index futures setup at the same notional risk
- Invalidation: A daily close above 98.39 with positive directional indicator strengthening on the 14-day average directional index negates the bear-distribution thesis from Friday's candle. Equally, a daily close below 91.50 with negative directional indicator crossing positive on the 14-day reading negates the long buy-the-dip thesis and unlocks the 89.81 then 86.93 downside extension targets. A sustained session above 97.27 with held momentum unlocks the 100.15 round figure for re-test.
Monday is a positioning day inside a binary catalyst window: Saturday's tentative US-Iran talks resolve Sunday's Globex open, and Tuesday's API plus Wednesday's EIA inventory prints frame the supply-data path through the FOMC at 2:00 PM ET Wednesday. The structural read remains an intact uptrend with the multi-indicator composite at 80 percent buy and positive directional indicator dominating, vulnerable only to a constructive Iran outcome that compresses the supply premium. Trade size and stop placement should reflect crude's 7 percent daily ATR and the 86.66 percent implied volatility on the May expiration strip.
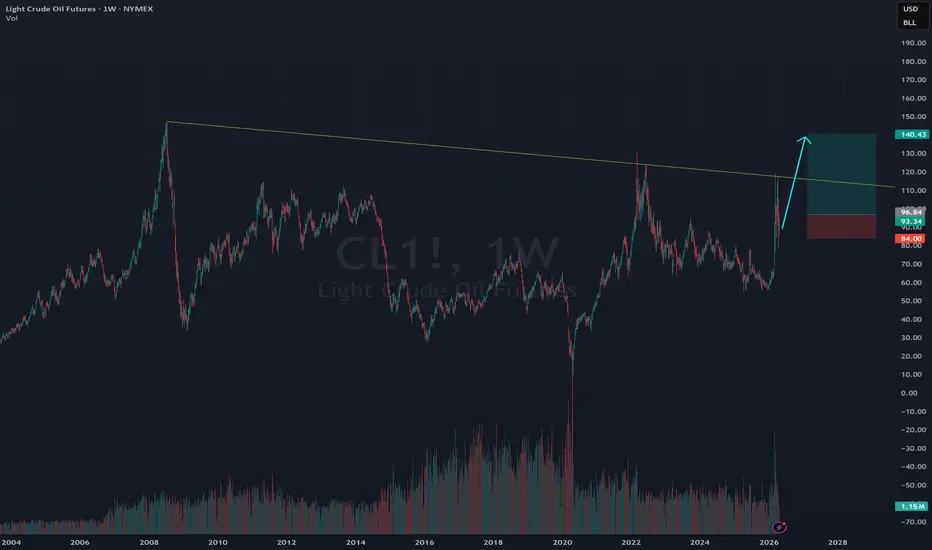
WTI to $150supply shock has not been priced in yet, paper oil is being manipulated. Physical oil deliveries are being sold at 20,30,40 USD premium to paper oil. $200 brent is coming soon during the Summer.
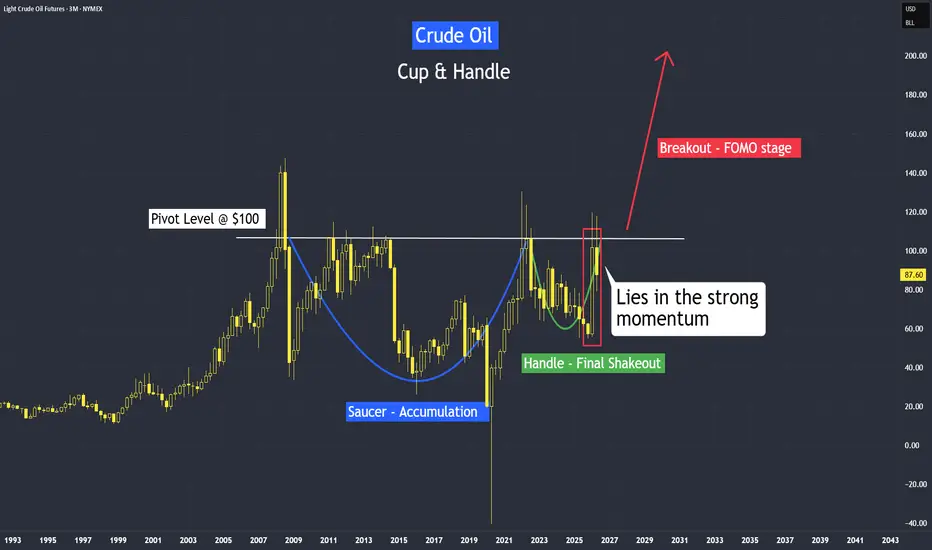
The Key to Cup and Handle BreakoutThe Key to Cup and Handle Breakout -
It lies in its strong momentum in either:
i) Before Or
ii) At Or
iii) After
The pivot level. The pivot level is its former resistance, it needs either a strong momentum to break through before or at. Even after the resistance level, with the strong momentum, it indicates a psychological clearance; the former resistance, now a support level.
The "Before" example with crude oil:
The "At" or "Through" example with gold and copper:
The "After example with silver:
Micro WTI Crude Oil Futures and Options.
Micro WTI Crude Oil
Ticker: MCL
Minimum fluctuation:
0.01 per barrel = $1.00
Disclaimer:
• What presented here is not a recommendation, please consult your licensed broker.
• Our mission is to create lateral thinking skills for every investor and trader, knowing when to take a calculated risk with market uncertainty and a bolder risk when opportunity arises.
CME Real-time Market Data help identify trading set-ups in real-time and express my market views. If you have futures in your trading portfolio, you can check out on CME Group data plans available that suit your trading needs www.tradingview.com
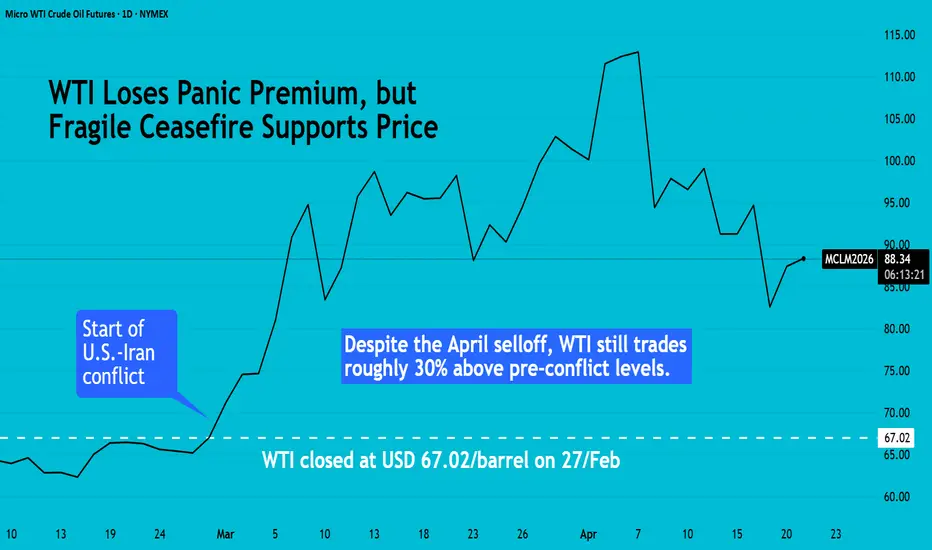
WTI Loses Panic Premium, but Fragile Ceasefire Supports PriceWTI crude oil has pulled back sharply from its April highs, but the market is far from normal. Prices remain elevated, volatility has eased, and options positioning shows traders are still wary of fresh disruption.
With the Strait of Hormuz still central to the outlook, WTI now sits between two paths: deeper normalisation or a renewed geopolitical spike.
WTI RETREATS FROM HIGHS, BUT FRAGILE CEASEFIRE KEEPS RISK PREMIUM INTACT
WTI crude oil futures have pulled back from the highs seen at the start of April, but prices remain elevated and still trade above pre-U.S.-Iran conflict levels. This suggests that a geopolitical risk premium is still built in.
Sentiment changed sharply on 08/Apr, when traders began taking diplomatic efforts more seriously. Prices fell 16.4% intraday, the biggest one-day drop since April 2020, after the U.S. and Iran agreed to a two-week ceasefire aimed at restoring safe passage through the Strait of Hormuz.
However, the selloff did not signal a full resolution. Markets quickly realised the ceasefire was fragile, with uncertainty over whether it would hold and whether tanker traffic would return to normal.
Price action in the days that followed reflected the same theme. Any sign of progress in talks pushed crude lower, while setbacks quickly brought buyers back in.
Later in the week, prices rose again as talks appeared to shift toward temporary arrangements rather than a lasting settlement.
By 17/Apr, futures closed 12.8% lower after Iran said the Strait of Hormuz would remain open to commercial shipping for the rest of the ceasefire period. Additional relief came from a 10-day Israel-Lebanon truce and renewed hopes that U.S.-Iran talks could resume.
That optimism was short-lived. Prices moved higher again on 20/Apr after weekend reports showed shipping through the Strait of Hormuz remained restricted.
Overall, periods of de-escalation have repeatedly been followed by renewed tension. The market is no longer pricing an immediate supply shock, but it is still unwilling to fully remove the geopolitical premium while the ceasefire remains uncertain.
VOLATILITY EASES, UPSIDE RISK REMAINS
WTI options markets show that the early panic from Middle East supply fears has eased, but traders remain cautious.
Source: CME CVOL
Implied volatility has fallen steadily from its early April peak, suggesting the market is less concerned about an immediate disruption through the Strait of Hormuz. Ceasefire headlines and diplomatic efforts helped calm sentiment.
Source: CME CVOL
Skew also declined through mid-April, showing reduced demand for aggressive upside call protection as fears of a sharp oil spike faded.
However, skew has started rising again even as overall volatility stays lower. That suggests traders are calmer about near-term price swings but still want protection against a sudden flare-up in tensions.
In short, panic has faded, but uncertainty remains.
NAVIGATING A FRAGILE CEASEFIRE
With geopolitical risk still embedded in WTI and the ceasefire remaining fragile, the market is caught between two very different outcomes.
Resolution scenario: A durable agreement is reached, and traffic through the Strait of Hormuz gradually returns to normal; the war premium could unwind quickly.
Goldman Sachs expects WTI to average USD 78/b in 2026. This outlook assumes a gradual normalisation of oil shipments through the Strait of Hormuz by mid-May, balancing risks from softer global demand against potential geopolitical supply disruptions.
The IEA recently cut its 2026 global oil demand forecast from growth of 730,000 bpd to a contraction of 80,000 bpd, which would mark the first annual decline since 2020.
Escalation scenario: If talks collapse, strikes resume, or Hormuz flows remain severely disrupted, prices could move sharply higher again. Goldman has warned that if the Strait of Hormuz remains closed for another month, Brent could average above USD 100/b through 2026, with prices potentially reaching USD 120/b in Q3, likely pulling WTI sharply higher alongside it.
Source: TradingView
For now, the forward curve and elevated skew suggest the market is cautiously leaning toward de-escalation, but without full confidence.
WTI OPTIONS POSITIONING TURNS DEFENSIVE
The options PCR is skewed toward puts (1.04), which means there is more demand for downside protection than for outright bullish exposure.
In practice, that usually signals caution: traders may be hedging against a failed ceasefire, renewed supply disruption, or a sudden spike in volatility.
Source: CME QuikStrike
Most of the put OI is clustered between 50 and 70, with decent activity extending to 75, 80, and even 90. Calls are concentrated at 90, 100, and 120, but overall positioning still leans more toward puts. During this conflict, prices peaked around USD 120/b.
Source: CME QuikStrike
Looking at the table, calls saw the most change in OI at 90, 95, 100, 120, and 150 strikes, while puts saw the biggest increases at 43, 48, 65, 70, and 80. That mix suggests the market is positioning for volatility, with a slight defensive bias.
HISTORICAL TRADE ILLUSTRATION
Just as diplomatic progress in April 2026 triggered a sharp unwinding of the geopolitical risk premium in WTI, a similar pattern was seen in June 2025.
In June 2025, markets were dealing with rising tensions, tougher rhetoric, visible military positioning, and persistent reports that a direct Israel-Iran confrontation was becoming more likely.
By 11/Jun, WTI implied volatility had already moved sharply higher as traders priced in the risk of disruption to Gulf oil flows.
Source: CME CVOL
Once diplomatic efforts began to look more credible, and markets started taking them seriously, implied volatility turned lower from 18/Jun. Trump’s ceasefire announcement on 23/Jun accelerated that decline further.
However, prices did not fully lose the geopolitical premium. The ceasefire was viewed as fragile, while underlying tensions remained unresolved, leaving a residual risk premium in the market.
This easing of geopolitical risk was reflected in prices, leading to a sharp unwind in crude. A trader who went short MCLQ2025 on 18/Jun/2025 and exited on 02/Jul/2025 would have realised a gross mark-to-market gain of USD 725 per contract.
Short CME Micro WTI Futures (MCLQ2025)
Entry = USD 73.75/barrel
Exit = USD 66.50/barrel
P&L: 100 x (73.75 – 66.50) = USD 725
Market participants can also utilise CME WTI futures to implement similar positioning.
A similar pattern is visible today: diplomatic progress can quickly remove the risk premium, but lingering uncertainty continues to keep a floor under crude prices.
This content is sponsored.
MARKET DATA
CME Real-time Market Data helps identify trading setups and more effectively express market views. If you have futures in your trading portfolio, you can check out on CME Group data plans available that suit your trading needs at tradingview.com/cme .
DISCLAIMER
This case study is for educational purposes only and does not constitute investment recommendations or advice. Nor are they used to promote any specific products, or services.
Trading or investment ideas cited here are for illustration only, as an integral part of a case study to demonstrate the fundamental concepts in risk management or trading under the market scenarios being discussed.
CRUDE OIL: Buyers Are In Control!This is an update to the analysis of Crude Oil presented last Sunday.
Crude Oil (WTI) is currently trading in a volatile, headline-driven range, roughly between $85 and $100 per barrel, with strong, immediate support near $92–$95. While geopolitical risks—specifically in the Strait of Hormuz—are driving bullish sentiment, the market is constrained by technical resistance near $100 and potential downside towards $85 if tension eases.
Enjoy!
May profits be upon you.
Leave any questions or comments in the comment section.
I appreciate any feedback from my viewers!
Like and/or subscribe if you want more accurate analysis.
Thank you so much!
Disclaimer:
I do not provide personal investment advice and I am not a qualified licensed investment advisor.
All information found here, including any ideas, opinions, views, predictions, forecasts, commentaries, suggestions, expressed or implied herein, are for informational, entertainment or educational purposes only and should not be construed as personal investment advice. While the information provided is believed to be accurate, it may include errors or inaccuracies.
I will not and cannot be held liable for any actions you take as a result of anything you read here.
Conduct your own due diligence, or consult a licensed financial advisor or broker before making any and all investment decisions. Any investments, trades, speculations, or decisions made on the basis of any information found on this channel, expressed or implied herein, are committed at your own risk, financial or otherwise.

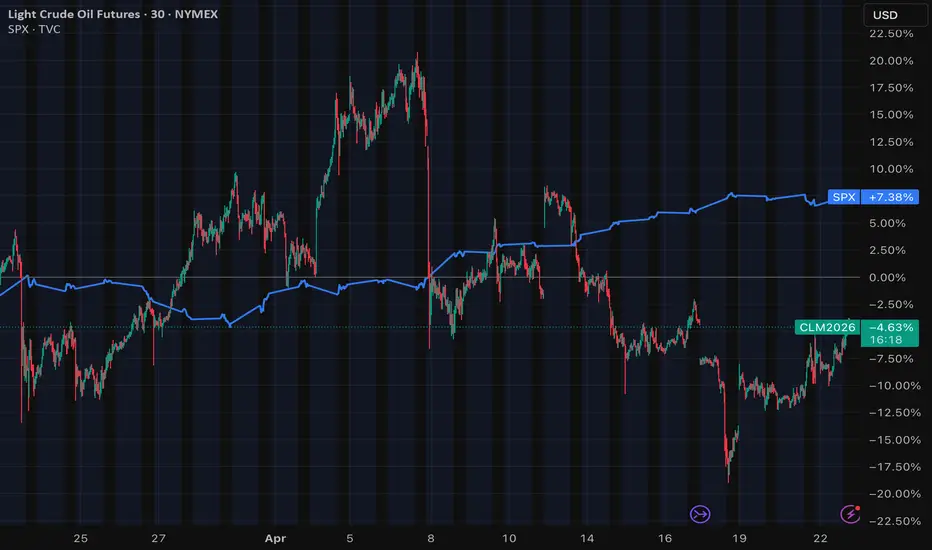
When Macro Stops Driving MarketsOver this period, a clear divergence has developed:
Oil Spiked on geopolitical tensions and then retraced
Meanwhile, equities have continued to trend higher
But that transmission mechanism appears to be weakening.
Even as oil has moved lower from recent highs, equities have continued to push higher- suggesting that markets are not responding to Macro inputs in a consistent or traditional way.
What may be driving this shift:
Retail participation has been more muted
Systematic strategies have increased exposure following momentum signals
Corporate buybacks remain a steady source of demand
In other words price action appears to be more sensitive to flows and positioning rather than macro inputs alone
Another factor potentially to this dynamic is index concentration
With a significant portion of S&P 500 performance driven by relatively small group of AI-linked names, the index may be less sensitive to traditional macro inputs such as energy prices and inflation data.
The question is no longer just what macro is doing, but whether markets are still responding to it in the same way
Cup and Handle Setup in Crude OilThere is a cup and handle setup in the crude oil.
Silver
In the past tutorial in 2024, we discussed this setup in the silver, and it has performed well.
Gold
So is the gold, a cup and handle setup we discussed in 2023, and it has also performed well.
Copper
And recently, in our copper tutorial, we also discussed about the cup and handle setup, and it is beginning to take shape.
Today, I am going to do things a little different, I going to bring you to understand the different stages of the cup and handle setup, its behavioural science behind its ultimate, the potential Breakout.
Micro WTI Crude Oil Futures and Options.
Micro WTI Crude Oil
Ticker: MCL
Minimum fluctuation:
0.01 per barrel = $1.00
Disclaimer:
• What presented here is not a recommendation, please consult your licensed broker.
• Our mission is to create lateral thinking skills for every investor and trader, knowing when to take a calculated risk with market uncertainty and a bolder risk when opportunity arises.
CME Real-time Market Data help identify trading set-ups in real-time and express my market views. If you have futures in your trading portfolio, you can check out on CME Group data plans available that suit your trading needs www.tradingview.com

Oil bearish Will see a drop during the open to fill orders below, then going bullish pre war next week talks.

Why I'm long Crude Oil with a target of $127Fundamentals:
Forget the fundamentals. Markets are currently 99% News driven!
Technical Analysis:
- Broken CIB Line = slightly bullish.
- Open above the red U-ML = Very bullish; even more if the close is also above the Red U-MLH.
- Hagopian -> Red CL = Bullish.
- 4th consecutive higher Bar-Lows.
Abbreviations
Hagopian = Price moves more in the opposite direction than from where it came.
U-MLH = Upper Medianline Parallel
L-MLH = Lower Medianline Parallel
CL = Centerline
SL = Sliding Parallel
WL = Warning Line
QL = Quarter Line

Crude Oil Support at 81.90: Volume Profile Buyers Step InCrude Oil is approaching a key support at 81.90, built from a strong rejection of lower prices.
Heavy buying volume entered this zone, showing where institutions stepped in and reversed the move. This makes it a high-probability reaction area on a pullback. Watch for a bounce, but stay cautious around Iran-related news that could spike volatility.

CRUDE OIL: Look For Valid Buys As Tensions Heighten!In this Weekly Market Forecast, we will analyze the CRUDE OIL for the week of April 20-24th.
Crude Oil is seeking buyers amid high volatility.
Following a sharp 16% drop late the previous week on reports of a reopened Strait of Hormuz, crude oil enters the April 20-24 trading week looking for buyers to establish a floor. While the immediate panic subsided, traders should watch for renewed volatility as market participants verify if supply disruptions truly ease.
- Outlook: Buyers are likely looking to enter on dips, seeking a "valid" level if tensions
re-escalate or if OPEC+ maintains a tight supply stance.
- Key Driver: The sustainability of the ceasefire and its impact on the $100+ "war premium".
Enjoy!
May profits be upon you.
Leave any questions or comments in the comment section.
I appreciate any feedback from my viewers!
Like and/or subscribe if you want more accurate analysis.
Thank you so much!
Disclaimer:
I do not provide personal investment advice and I am not a qualified licensed investment advisor.
All information found here, including any ideas, opinions, views, predictions, forecasts, commentaries, suggestions, expressed or implied herein, are for informational, entertainment or educational purposes only and should not be construed as personal investment advice. While the information provided is believed to be accurate, it may include errors or inaccuracies.
I will not and cannot be held liable for any actions you take as a result of anything you read here.
Conduct your own due diligence, or consult a licensed financial advisor or broker before making any and all investment decisions. Any investments, trades, speculations, or decisions made on the basis of any information found on this channel, expressed or implied herein, are committed at your own risk, financial or otherwise.

OIL STARTING TO LOOK BEARISH AGAIN WITH CLOSE BELOW SUPPORT!Bullish- as mentioned yesterday in my Monday Morning Market open Video unless the straight closes again I think the bulls out of the picture for now. But if you are bullish wait for close back above 50% retracement level. Then conisider buying a pullback at support.
Bearish- Yes I am because she just closed on the daily chart below the 50% Fibonacci Retracement level 84.00. Also with the fundamental supposedly peace talks that should also continue to way heavy on prices. Unless major demand hits the market unexpectedly then I think there might be a top trying to carve out by summer or before. I would look to sell the rally if we see struggle at reistance or hesistation.
Commitment of Traders- they are still long about 209,000 contracts it is now overcroweded longs yet. But the last time they were this long was June 2025 and market topped.
Good Luck & Always use Risk Management!
(Just in we are wrong in our analysis most experts recommend never to risk more than 2% of your account equity on any given trade.)
Hope This Helps Your Trading 😃
Clifford
RISK DISCLOSURE
TRADING IN THE FUTURES AND FOREX MARKET INVOLVES SIGNIFICANT RISK. ALWAYS CONSULT A FINANCIAL ADVISOR AS HIGH RISK ASSET CLASSES MAY NOT BE SUITABLE FOR ALL INVESTORS. THIS IS NOT A RECOMMENDATION TO BUY OR SELL ANY ASSETS. ALL IDEAS ARE MADE FOR EDUCATIONAL PURPOSES. PAST PERFORMANCE DOES NOT GUARANTEE FUTURE RESULTS.
CFTC RULE 4.41 – HYPOTHETICAL OR SIMULATED PERFORMANCE RESULTS HAVE CERTAIN LIMITATIONS. UNLIKE AN ACTUAL PERFORMANCE RECORD, SIMULATED RESULTS DO NOT REPRESENT ACTUAL TRADING.

CL (Crude Oil) Analysis, Key-Zones, Setup for Wed (Apr 22)Crude oil futures spent Tuesday chopping between a quiet globex session and a violent afternoon spike, settling at 89.94 (+0.30%) on the continuous contract and 90.49 on the front-month June contract. The real story is not the 30-cent settlement print but the 92.23 high registered during the late New York session, a 6-handle rally off the 87.86 NYPM low that left the week running at roughly +9% through only two trading days.
The forward curve held its modest backwardation structure into the close, with front-month premium over the July contract widening as physical supply concerns intensified. That structural signal matters more than the headline print for an instrument this reactive to supply risk.
After the bell, a sequence of Iranian statements between 17:07 and 17:34 ET reset the overnight setup. Tasnim News Agency relayed that Iran will not reopen the Strait of Hormuz while a US naval blockade persists, will use force if necessary to break that blockade, and that US policy should treat Hormuz as effectively fully closed. Iran's military then warned of a powerful strike on predetermined targets in response to repeated threats from the administration. API inventories released at 16:44 ET printed a 4.47 million barrel crude draw against a 1 million barrel consensus, alongside a 5.16 million barrel gasoline draw and a 4.59 million barrel distillate draw, the largest combined pull in months. The dollar index finished near 98.32, down modestly, which removed the usual inverse headwind.
News & Macro Context:
The geopolitical premium that was being priced out two weeks ago has fully returned. Persian Gulf producers have been forced to reduce output by roughly six percent as local storage reached capacity behind the Hormuz closure, and the US-Iran ceasefire is scheduled to expire at the end of Wednesday. President Trump indicated it is highly unlikely he extends that agreement, and Vice President Vance's trip to Pakistan for negotiations was put on hold after Iran failed to respond to US positions. The commentary feed captured White House trade adviser Navarro framing the Iran risk as a hidden tax on global oil prices, a tell that the administration sees removing that risk as worth significant political capital.
Wednesday morning's 10:30 ET EIA petroleum status report is the immediate catalyst. Consensus heading in was a 0.913 million barrel draw, but the API estimate just ran four and a half times larger. A confirming print would extend the rally directly into the 92.23 post-close spike high and the R1 pivot at 92.77, where the 38.2 percent retracement from the four-week high at 92.69 also sits. A disappointing EIA print alongside any softening in ceasefire language would unwind a meaningful portion of the late-Tuesday move.
Secondary headlines to watch include the OPEC and IEA monthly reports scheduled for later in the week, the US ambassador to Israel joining a delegation for Israel-Lebanon talks, and any escalation from Iran's threatened strikes on predetermined targets. Each of these reprices the premium in real time.
Supply and Technical Context:
The 14-day ADX sits at 29.49 with the negative directional indicator at 22.73 versus the positive at 19.62, which flags a mildly bearish technical bias that the macro catalyst has not yet flipped on the daily frame. The 20-day directional index runs higher at 34.17 with the two lines nearly balanced, the signature of an inflection point rather than a confirmed trend change. Composite indicator opinion reads 8 percent buy overall, sitting against 40 percent sell on short-term studies and 67 percent buy on long-term studies, an unusually wide disagreement that almost always resolves once a fresh catalyst breaks the pattern.
The 14-day ATR stands at 6.44 points, or 7.12 percent of notional, and the 14-day ADR at 6.01 points. Historic volatility on the 14-day window is 85.88 percent, with the June monthly options implying a 77 percent forward read. Expected one-day range sits wide at roughly six full dollars, so position sizing and stop placement both need to respect the environment.
Multi-timeframe structure shows the weekly bar printing a +9 percent advance through two sessions and extending into the prior weekly high shelf near 92.23. The daily bar is an inside consolidation candle with open, high, low, and close all clustered between 89.71 and 90.71, leaving a compression setup ahead of the catalyst. Four-hour structure broke upward on the New York afternoon push before fading to 89.50 on profit-taking. The 30-minute session map carries a volume-weighted average at 89.44, a prior-day low at 86.62, a yesterday value area high at 90.74, a yesterday point of control at 89.78, and an initial balance envelope of 86.62 to 88.03 that the afternoon spike cleared decisively.
Forecast:
Overnight (18:00 ET Tue through 06:00 ET Wed): Globex is digesting the API beat and the Tasnim headlines inside a 89.00 to 90.80 range, with the afternoon 92.23 spike acting as an overhead magnet if Iran follows through on the strike language before London. Any fresh Hormuz escalation in Asia hours extends directly into the 91.62 moving-average cross and the 92.23 to 92.77 supply band. Failure below 89.13 into the London open opens 88.38 and the 87.86 NYPM low.
Morning Session (06:00 ET through 12:00 ET): Europe trades the Iran situation and the 08:15 ET ECB Lane remarks, with the 02:00 ET UK CPI print as a dollar-sensitivity checkpoint. The defining event is the 10:30 ET EIA crude inventories release. A print larger than the API estimate of negative 4.47 million barrels is an immediate squeeze catalyst toward 92.77 and 93.12. A print smaller than the consensus negative 0.913 million barrel draw fades the afternoon spike and targets 88.71 to 89.13.
Afternoon Session (12:00 ET through 17:00 ET): The 13:00 ET 20-year Treasury auction affects the dollar backdrop, and the 13:30 ET Lagarde appearance is a second ECB headline risk. The pit close at 14:30 ET is the settlement stamp that often decides whether the Iran premium holds overnight. Price action into 15:30 ET then keys on whether the White House confirms or refuses a ceasefire extension before the Wednesday evening expiry. A no-extension confirmation keeps the bid; a surprise extension or diplomatic backchannel compresses the curve quickly.
Daily Close: Most likely settlement range is 89.50 to 92.50. A close above 91.62 confirms the moving-average reclaim and sets up 92.77 as Thursday's first test. A close below 88.71 invalidates the afternoon breakout and reopens the 86.62 shelf.
Expected Range: 87.80 to 92.80 for Wednesday. Implied one-day range from the 77 percent ATM volatility sits at roughly plus or minus 4.40 points on the June contract.
Most Likely Path: Path A (45%): EIA confirms a larger-than-expected draw, price pops toward 91.62 to 92.23 within the first hour, consolidates midday, then pushes into 92.77 on ceasefire non-extension language. Path B (35%): EIA prints in line or modestly below API, price fades to 88.40 to 89.00, holds the 50 percent retracement shelf, and rebuilds toward 90.70 on Iran headlines. Path C (20%): ceasefire-extension surprise or a soft EIA combined with a Lane or Lagarde dovish shock compresses the premium to 87.45 to 87.86, with a potential washout to 86.62 if the 40-day moving average fails.
Wednesday Events:
- 02:00 ET - UK CPI and Core CPI year-on-year, plus UK PPI input and output
- 08:15 ET - ECB's Lane speaks
- 10:00 ET - Eurozone Consumer Confidence Flash
- 10:30 ET - EIA Crude Oil Inventories (consensus -0.913 million barrels, API estimate -4.47 million)
- 13:00 ET - US 20-Year Bond auction
- 13:30 ET - ECB's President Lagarde speaks
- 14:30 ET - NYMEX pit close and settlement
- 16:05 ET - Tesla Q1 2026 earnings
- 17:10 ET - IBM earnings
- Evening - US-Iran ceasefire scheduled to expire
Resistance:
- 90.71 to 90.74 - Tuesday settlement-day high and yesterday value area high
- 91.15 to 91.62 - 18-day moving average stall and cross zone, first meaningful ceiling
- 92.23 - Tuesday NYPM session high, the spike that reset the weekly trend
- 92.69 to 92.77 - 38.2 percent retracement from four-week high plus computed R1 pivot, confluence band
- 93.12 - Plus one standard deviation band
- 94.55 to 95.86 - Plus two standard deviation band and computed R2 pivot
- 99.50 to 101.17 - Computed R3 pivot and one-month high, stretch target
Support:
- 90.07 - 50 percent retracement of the four-week high-low and 14-3 stochastic 50 percent trigger
- 89.71 to 89.78 - Tuesday session low, yesterday point of control, 9-day moving average stall
- 89.13 - Daily pivot point
- 88.71 - 9-day moving average cross
- 88.38 - Yesterday value area low
- 87.86 - Tuesday NYPM session low
- 87.45 - 38.2 percent retracement from four-week low
- 86.47 to 86.62 - 40-day moving average and prior-day low shelf
- 86.04 - Computed S1 pivot
- 84.79 - Minus two standard deviation band
- 82.40 - Computed S2 pivot, structural downside
How I'm seeing it:
- The geopolitical catalyst has done what two weeks of quiet supply data could not do, which is put a real bid under the front of the curve. The Iran statements between 17:07 and 17:34 ET are not negotiating language, they are escalation language, and the after-hours API draw confirms the physical market is tightening alongside the headline risk.
- Composite indicator opinion is already compressed at 8 percent buy despite a 9 percent weekly advance. That disagreement between short-term mean-reversion studies and long-term trend studies is exactly the pattern that resolves violently when a fresh catalyst breaks through, and the EIA print is designed to do precisely that.
- Volatility is elevated and sizing needs to respect it. A 6.44-dollar 14-day ATR means a standard two-point stop on either side of 90.00 is well inside the noise, and a four-point stop is the minimum that survives normal intraday swings around a geopolitical headline.
- The 92.23 to 92.77 band is the single most important decision zone for Wednesday. Price rejecting twice at that level without a confirming EIA beat flags short-term exhaustion. Price holding above 92.77 on EIA confirmation opens 93.12 and then the 94.55 standard deviation band with very little technical in between.
- Dollar index at 98.32 with modest weakness removes the inverse-correlation drag that would otherwise cap the rally. Watch the 10:30 ET EIA print and the dollar reaction simultaneously, because a dovish UK CPI or a soft ECB tone strengthens the crude bid even further.
- Primary Setup: Long 88.40 to 89.00 on a morning pullback into the yesterday point of control and 9-day moving average, stop 87.70, target 90.71 first leg and 92.23 on EIA confirmation. Rationale is that the API surprise and the Iran escalation sequence are not priced at 89.00, which puts the risk-reward heavily in favor of the pullback entry.
- Alternative: Long 90.50 to 91.00 on a confirmed break of the moving-average stall band after the 10:30 ET EIA print, stop 89.40, target 92.23 first leg and 92.77 on ceasefire-expiry language. Only valid if EIA confirms a draw larger than the 0.913 million barrel consensus.
- Invalidation of bullish bias: close below 87.45, which would eliminate the geopolitical premium in the price and reopen the 86.04 pivot support.
- Primary risk to both setups: a Trump announcement extending the Iran ceasefire, which Navarro's framing suggested the administration has political incentive to avoid, but which would collapse the premium and trigger a 3-to-4 dollar unwind within minutes.
Good Luck !!!

APRIL 22 CRUDE OIL - LONG Entry Criteria - 3 Point Touchline Break
Strong confluences
FVG's Respected
Loads of data on the 3-point touch
Yesterday Highs
Asia & London movements
Entry @ 90.90
TP @ 91.37
Profit - $1,440 USD

CL (Crude Oil) Analysis, Key-Zones, Setup for Thursday (Apr 23)June WTI crude settled sharply higher on Wednesday, closing up 3.29 or 3.67 percent at 92.96 before easing modestly into the Globex reopen near 92.67. The session high of 93.73 marked a fresh weekly peak and stretched the five-session advance off the 78.97 print on April 17 to nearly nineteen percent. The weekly candle is now plus 12.43 percent, the most aggressive weekly move in this contract since the opening thrust off the mid-December 52-week low at 55.12.
The rally is not a technical story. It is a physical-supply shock layered onto a market that had already climbed from a January 59.70 trough to a March cycle peak at 104.34 before correcting. Persian Gulf producers have throttled output by an estimated six percent as local storage approaches capacity during the continued Strait of Hormuz disruption, and intraday headlines oscillated between escalation and de-escalation, leaving the contract pinned in a 92.33 to 92.98 afternoon range, a proven exhaustion pattern after a vertical move.
The forward curve remains in backwardation despite the price surge, signalling the market is pricing this as a near-term squeeze rather than a structural shift. That creates two Thursday implications, fresh escalation still produces gap continuation, while any credible diplomatic progress unwinds the premium rapidly.
News and Macro Context:
The central driver remains the Strait of Hormuz closure and the Iran-US standoff. Tehran continues to regulate traffic through the strait, fire on vessels, and seize tankers, while the US maintains a naval blockade on Iranian-linked shipping and intercepted at least three Iranian oil tankers in Asian waters on Wednesday. Persian Gulf oil producers are now running roughly six percent below normal output as local storage hits capacity, a genuine physical constraint rather than a positioning story.
Offsetting the supply-shock is the White House decision to extend the Iran ceasefire beyond the original Wednesday deadline. That extension took some immediate escalation risk out of the market and contributed to the pullback from the 93.73 high into the close. Executive-branch messaging remains open-ended, with the press secretary repeating there is no firm deadline for an Iran proposal, that public and private Iranian messaging diverges, and that any resumption of hostilities is at the president's discretion. Treat each headline cycle as binary, the difference between a one-dollar pullback and a five-dollar spike is a single wire bulletin.
The Wednesday weekly government inventory report was characterized as mixed for crude and products, which is why the headline trade dominated over the standard inventory-surprise reaction. Refinery utilization remains firm heading into the seasonal transition to summer driving demand, and crack spreads widened alongside the RBOB gasoline contract, which closed up 3.84 percent and posted a fresh three-week high. Brent settled near 102 a barrel, reflecting the same war premium.
Equities printed fresh all-time highs on Wednesday on strong corporate earnings and the ceasefire extension, with the S&P 500 up one percent. The risk-on tone is supportive for crude demand at the margin, but the bull case from here depends on whether the blockade-and-seizure cycle continues or diplomatic channels gain traction.
Supply and Technical Context:
The 20-day average directional index reads 32.86 with positive directional strength at 21.87 edging above negative at 19.65, confirming a trending environment with bulls in modest control. The 50-day ADX at 27.75 with plus-DI 24.60 over minus-DI 16.76 confirms a firmer medium-term uptrend. The multi-indicator composite registers 40 percent buy overall with strengthening direction, up from 16 percent the prior week and a step below the 80 percent reading one month ago. The split is long-term 67 percent, short-term 40 percent, medium-term 25 percent, a profile consistent with a trend that has paused to digest its recent thrust.
The statistical expected range computed from the 14-day measure sits near 6.36 points per day, which, from the 92.67 reference, produces a Thursday envelope of roughly 88.90 to 96.40. Options implied volatility at 90.47 percent implies a slightly wider one-day band of approximately 88.00 to 97.40. The 14-day RSI of 54.61 and 14-3 stochastic percent-K at 57.40 both sit in neutral territory.
Weekly structure holds a third consecutive higher-high, higher-low candle above the 5- and 20-week averages, with resistance at the 104.34 March high and an intermediate shelf at 101.17 to 101.34. The daily candle closed above the 5-day average at 89.03, the 20-day at 91.71, the 50-day at 82.72, and every longer-term benchmark down to the 200-day at 66.05. The 4-hour and 1-hour charts show the same Wednesday 92.33 to 92.98 range that has not broken in either direction overnight. Liquidity pools sit above 93.73 at the weekly high and below 91.44 at the standard pivot, with 92.69 corresponding to the 38.2 percent pullback level from the 4-week high and aligning with retail order concentrations visible in market-depth tools.
Forecast:
Overnight: Consolidation within 92.30 to 93.10 is the base case as the pullback from 93.73 to 92.67 has not violated the 92.33 session low. A break below 92.33 opens 91.55 and the 91.44 pivot, a break above 93.10 reopens 93.73 and 94.19.
Morning Session: The 09:45 ET US Services and Manufacturing PMI flash prints are the first scheduled macro catalyst. A firm Services read above 50.5 supports demand expectations and leans price toward the 93.73 to 94.19 supply zone, a miss below 50 reintroduces growth concerns and pressures price toward 91.55. The first 15 minutes of regular trade are historically a whipsaw window for crude, position after 09:45 ET.
Afternoon: Volume tapers into the afternoon and the session is susceptible to trend continuation when directional conviction builds. A break above 93.10 with follow-through targets the pivot first resistance at 95.25. A break below 92.33 targets the 91.44 pivot first, then 89.16 on capitulation flow. A range-bound morning argues for holding the 92.33 to 93.10 box through the pit close at 14:30 ET.
Daily Close: Highest-probability close is a retest of the 92.96 Wednesday settle, secondary outcome 93.50 on residual bullish pressure. A close above 93.73 marks a seventh consecutive higher close and leans structure toward 95.25 to 97.20 into Friday. A close below 92.33 would be the first bearish engulfing off the Hormuz rally and invites a test of 91.44 Friday.
Expected Range: 88.90 to 96.40 on the 14-day measure, slightly wider 88.00 to 97.40 on implied-volatility math. Implied 1-day range is approximately 6.36 points.
Most Likely Path: Path A (55%), range consolidation 92.30 to 93.20 with two-way rotation around the 92.67 reference. Path B (30%), continuation higher on a 93.10 break, grind toward 95.25 on fresh Hormuz headlines or firm US PMIs. Path C (15%), mean-reversion selloff through 92.33 on ceasefire progress, test of 91.44 to 90.07.
Thursday Events:
, 08:30 ET, US Initial Jobless Claims (fcst 210k, prior 207k) and Continued Claims
, 09:45 ET, US S&P Services PMI Flash (fcst 50.6, prior 49.8), Manufacturing PMI (fcst 52.5), Composite
, 10:00 ET, US Trade Rep. Greer speaks
, 11:00 ET, ECB Nagel speaks
, 13:00 ET, US 5-Year TIPS auction
, No weekly government inventory report (Wednesday was release day)
, No API inventory report (Tuesday was release day)
, Iran-Hormuz diplomatic headlines remain the binary risk through the full session
Resistance:
, 93.73, weekly high and session rejection, first line of defense for bears
, 94.19, 18-day moving average stall zone
, 95.25, pivot first resistance point
, 95.45, target price (computed)
, 97.20, 1 standard deviation resistance
, 97.53, pivot second resistance point
, 101.17, 1-month high
Support:
, 92.96, Wednesday settle and immediate demand base
, 92.69, 38.2 percent pullback level from 4-week high
, 92.33, Wednesday low and session anchor
, 91.55, 18-day moving average
, 91.44, standard pivot point
, 90.07, 50 percent pullback level from 4-week high/low
, 89.16, pivot first support point
, 88.72, 1 standard deviation support
How I'm seeing it:
, The dominant driver is geopolitical supply disruption, not technicals. Every chart-based setup must account for binary headline risk through the full session.
, The rally from 78.97 to 93.73 in five sessions is a supply-shock premium, not a demand acceleration. Wednesday's pullback signals the market has absorbed the initial shock and now needs fresh inputs to extend.
, Composite technical opinion at 40 percent buy with strengthening direction is a constructive backdrop for long entries on pullbacks. The medium-term 25 percent read reflects the correction from 104.34, not fresh bearish positioning.
, 20-day and 50-day ADX readings with positive directional strength above negative confirm a trending environment favoring buy-the-dip over fade-the-rally on directional setups.
, Implied volatility at 90.47 percent compresses edge for premium sellers and argues for smaller size on any directional entry, with stops wider than a typical session would suggest.
, Primary Setup: Long 91.50 to 91.80 on pullback to the 18-day average and standard pivot zone, stop 90.85, target 93.60 first leg and 95.20 on extension. Leverages intact uptrend structure, 67 percent long-term composite buy, strengthening 20-day ADX, and the still-active Hormuz supply constraint.
, Alternative: Short 95.00 to 95.40 on tag of pivot first resistance, stop 96.20, target 93.70 to 92.00. Only valid if the 95.25 tag occurs without a fresh Hormuz escalation accompanying it, pure mean-reversion fade of the 3 to 5 dollar overshoot.
, Invalidation of the long-side bias, daily close below 90.00 breaks the 50 percent pullback level at 90.07 and the 5-day average at 89.03.
, Primary risk to both setups, a formal Iran-US ceasefire agreement or credible Hormuz reopening would compress the war premium by 4 to 7 dollars in a single session.
Good Luck !!!

CRUDE OIL: Off to new highs!What’s changed?
WTI futures prices dropped sharply on Friday. During the decline, WTI reached our Target Zone. We believe WTI has established the low of its downward move and should now break above resistance at $119.48.
Primary Scenario
WTI is already in an upward move and should next break above resistance at $95.03 and then $119.48. After these respective peaks, we expect significant sell-offs into our blue Long-Term Entry Range, where the ongoing corrections should finally conclude.
Alternative Scenario
In our alternative scenarios, prices could fall below support at $54.98 sooner, forming early correction lows in the blue Long-Term Entry Ranges (probability: 33%).
Long-Term Outlook
Weekly charts indicate that the current corrective upward series should stall below resistance at $130.50, allowing the corrections to continue. After correction lows in the blue Long-Term Entry Range, we expect a strong rally above $147.27.

BUY OIL NOW. RR 2.5I am betting on the upward trend of oil in the near future, and even further ahead.
The current oil price has dropped to a strong support zone on the monthly, 3-month, and 6-month charts. You can notice that the 60-90 price range is the range where oil had accumulated for a long time before breaking through during the recent geopolitical conflicts in the Middle East.
I expect the current price around 90 to be a good buying zone with a target of $180 in the long term.
BUY OIL NOW (88.20)
SL $60
TP $150
RR 1:2. Good luck!

WTI Crude Oil Futures (Dec 2026). Bull structure. AccumulationThe Dec 2026 Crude Oil (CL) futures contract offers a compelling long opportunity, trading around $76 with strong technical support and mounting geopolitical catalysts poised to ignite a multi-month rally.
As shown in the provided below TradingView chart, CL exhibits a classic bullish flag pattern after rebounding from the $55 multi-year support zone, with contracting volatility signaling an imminent breakout above $68 resistance.
December 2026 CL Futures (Daily, Weekly)
Technical Setup
The chart highlights higher lows forming since early 2026, stabilizing after decline from 2026 peaks, now entering a descending triangle resolution phase favoring upside. Key indicators align: RSI climbing from oversold levels, MACD histogram flipping positive, and volume spiking on up days. A close above $70 targets $75 initially, with extension to $80 and $100+ again by contract expiry in November 2026.
Near-term catalysts include EIA inventory draws and a "Buy" technical rating on front-month contracts, spilling into Dec 2026.
Fundamental Drivers
OPEC+ compensation cuts totaling 4.6 million bpd through mid-2026 will tighten supply, countering recent bearish demand revisions from IEA amid Middle East tensions. Persistent low OECD inventories have prompted Goldman Sachs to hike Q4 2026 Brent forecasts to $60 (WTI $56 equivalent), but escalating Iran-related disruptions could slash supply far more, flipping markets to deficit.
Surging global travel demand post-winter and U.S. production plateaus add tailwinds, with President Trump's pro-energy policies accelerating domestic constraints.
This setup combines chart symmetry from the linked contract snapshot with real-world supply squeezes, positioning Dec 2026 CL for further potential gains.
Weekly chart points also on a "accumulation mode", a potential "Cup and Handle" structure.

WTI Crude Spikes to $89 on Hormuz Fears. Is $100 the Next Stop?WTI crude oil is trading at $89.37 with Brent at $96.41 — and the Iran war just made traditional price models obsolete. The Strait of Hormuz, through which roughly 21% of global oil supply transits daily, has been officially rated a WAR ZONE (70/100) with active Iranian naval activity and an ongoing blockade risk. Flow is already down -1.4 mb/d (7% of baseline). When the world's most critical energy chokepoint is under active military threat, oil doesn't track demand curves — it tracks war headlines.
───────────────────────
MACRO CONTEXT
───────────────────────
Reuters reported this week that "the Iran war has shattered oil's price compass," and the data backs it up: U.S. crude inventories fell -5,057k barrels week-over-week (as of April 10), the SPR is drawing at -4,144k barrels WoW, and energy analysts now suggest the conflict could push the U.S. to become a net crude exporter for the first time since World War II — a structural shift that normally takes a decade, compressed into a conflict timeline.
Simultaneously, an unprecedented fire at an Australian oil facility has knocked additional supply offline, and the CFTC has launched a probe into suspicious oil futures trading on CME and ICE — a signal that sophisticated money was positioned ahead of this escalation. Big oil is reaping "$30 million per hour" in war windfall profits, and energy conservation programs are now active in 58 countries.
The last time geopolitical supply disruption of this magnitude converged with inventory draws and a strategic reserve drawdown, WTI went from $70 to $147 in under 18 months (2007–2008). A replay of that magnitude is not the base case — but the directional setup is clearly bullish.
───────────────────────
TECHNICAL ANALYSIS
───────────────────────
Monthly: WTI is back above the $85 psychological level that capped price for most of 2025. Weekly: Price has broken above a descending resistance trendline connecting the October 2023 ($95) and September 2024 ($78) swing highs — the breakout at ~$83 is a significant structural shift. Daily: An ascending channel is forming with support at $85.50 and resistance at the $92–$95 zone.
Confluences supporting the long thesis:
① The $85.50 level aligns with both the 200-day moving average (rising for the first time since 2023) and the prior descending trendline breakout — a double confluence of technical support below current price.
② Weekly volume on the breakout candle was approximately 1.7x the 20-week average — well above the 1.5x threshold for a confirmed breakout.
③ The Fibonacci retracement of the 2023–2025 decline (from $95 to $65) places the 61.8% level at $83.50 (already broken and holding as support) and the 100% recovery at $95.00 — aligning with the primary target.
RSI (Daily): ~60 — above 50, confirming bullish momentum without being overbought. Room to run.
MACD (Daily): Positive crossover with expanding histogram since early April. Signal line above zero — continuation mode.
The 4H chart shows a bull flag consolidation following the rally from $80 to $90, with a measured move projecting to $97–$99. On the 1H, price is coiling between $87.80–$90.50 ahead of the next directional expansion.
───────────────────────
TRADE PLAN
───────────────────────
Direction: LONG
Entry Zone: $87.50 — $89.50
Stop Loss: $84.00 (below 200-day MA and ascending channel support)
Target 1: $95.00 (prior swing high + psychological resistance)
Target 2: $99.50 (measured bull flag move)
Target 3: $107.00 (Fibonacci 1.618 extension of the 2023–2025 swing)
R:R Ratio: 1:2.4 to T1 | 1:3.4 to T2 | 1:5.4 to T3
Timeframe: Daily / Swing (2–4 weeks)
Scale in: 60% at $87.50–$88.50. Add remaining 40% on a confirmed daily close above $91.00.
───────────────────────
RISK & INVALIDATION
───────────────────────
Thesis invalidated on a daily close below $84.00 — this breaks the 200-day MA and ascending channel support, signaling the war premium is fading faster than fundamentals can support. Primary binary risk: a formal Iran-Israel ceasefire or U.S.-Iran diplomatic breakthrough — expect a $5–$10 intraday selloff on that headline. Secondary risk: EIA inventory build greater than +3M barrels. Monitor CFTC probe developments for futures volatility.
───────────────────────
EDUCATIONAL TAKEAWAY
───────────────────────
This setup demonstrates the Geopolitical Risk Premium — how assets price in conflict uncertainty through supply disruption probability and fear premium. The key insight: geopolitical premiums tend to overshoot on the way up (fear drives buying) and unwind sharply when the headline risk resolves (relief selling). The most profitable approach is to trade with the premium while it's building, and use Fibonacci retracements to understand how much of the current price is war premium vs. fundamental value — which helps you size risk correctly and set realistic invalidation levels.
This is not financial advice. Always manage your risk.

CL Daily_Down Fibonacci_-887 Ticks to targetCL Daily time frame broke the up trend line
and entered into the sell zone. The market has
a down Fibonacci with an extension price point
74.62 about -887 ticks below the market. As long
as the market stays in the sell zone it is expected
the market to push bearish towards 74.62.
