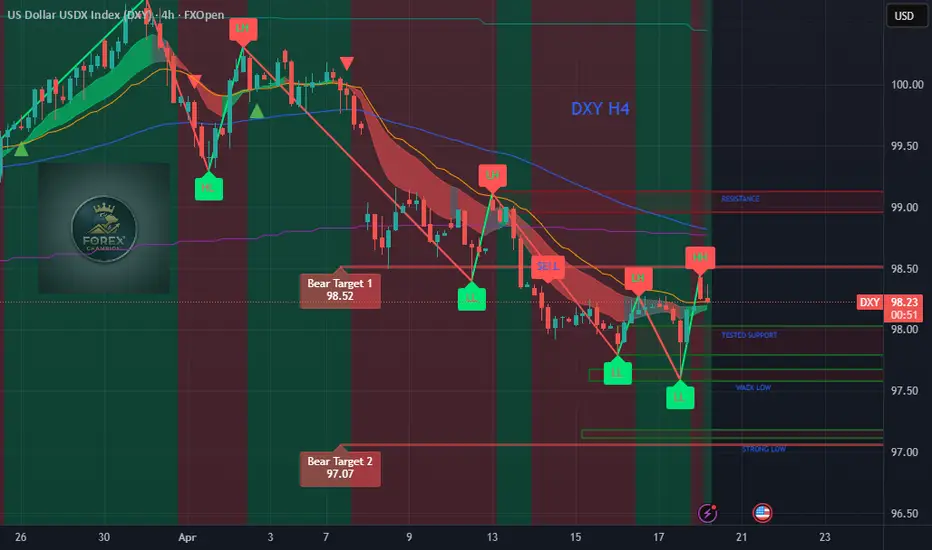
Current price: around 98.23
Instrument: DXY (US Dollar Index)
Timeframe: H4 (4-hour candles)
Technical levels marked:
Resistance zone: near 99.00 – 99.10 (red horizontal lines)
Mid resistance/support: around 98.50
Tested support: around 98.00
Weak low: around 97.50
Strong low: around 97.00
Indicators / Signals:
Colored trend lines and moving averages are visible.
Labels such as:
HH = Higher High
LH = Lower High
LL = Lower Low
These indicate market structure analysis.
Current Market View:
Price is below the resistance zone (99.00)
It recently bounced from lower support areas
Short-term recovery is visible, but resistance overhead remains strong
Disclaimer
The information and publications are not meant to be, and do not constitute, financial, investment, trading, or other types of advice or recommendations supplied or endorsed by TradingView. Read more in the Terms of Use.
Disclaimer
The information and publications are not meant to be, and do not constitute, financial, investment, trading, or other types of advice or recommendations supplied or endorsed by TradingView. Read more in the Terms of Use.