DXY – Market Structure Analysis
Following a prolonged consolidation phase, the Dollar Index (DXY) established a strong base near the support region, indicating accumulation. Price recently showed a bullish reaction from this demand zone, suggesting a potential shift in short-term sentiment as buyers step back into the market.
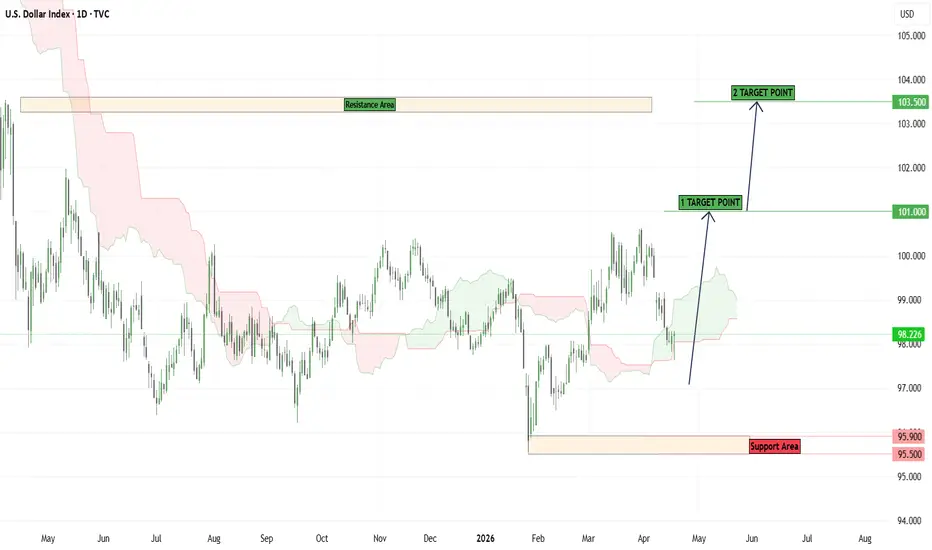
Currently, price is attempting to build momentum after bouncing from support and is moving toward higher levels within the range. Holding above the current structure would signal strengthening bullish intent and open the path for a continuation toward key resistance zones.
📊 Key Trading Scenarios
✅ Bullish Scenario 🚀
* Price sustains above the 97.00 – 96.50 support region
* Continued higher low formation confirms recovery structure
🎯 Target 1: 101.00
🎯 Target 2: 103.50
❌ Bearish Scenario ⚠️
* A breakdown below 95.50 may invalidate the bullish outlook
🎯 Downside Target 1: 95.00
🎯 Downside Target 2: 94.00
📍 Critical Levels to Monitor
🔴 Immediate Resistance: 101.00
🔴 Major Resistance: 103.50 (Resistance Area)
🟢 Key Support Zone: 97.00 – 95.50
⚠️ Trading Insight
Price is currently reacting from a well-defined support zone and showing early signs of bullish recovery. Sustaining above this region would support further upside toward resistance, while rejection or breakdown could lead to renewed downside pressure.
Note:
This analysis is based on current market structure and price action. Market conditions may evolve—always use proper risk management.
Following a prolonged consolidation phase, the Dollar Index (DXY) established a strong base near the support region, indicating accumulation. Price recently showed a bullish reaction from this demand zone, suggesting a potential shift in short-term sentiment as buyers step back into the market.
Currently, price is attempting to build momentum after bouncing from support and is moving toward higher levels within the range. Holding above the current structure would signal strengthening bullish intent and open the path for a continuation toward key resistance zones.
📊 Key Trading Scenarios
✅ Bullish Scenario 🚀
* Price sustains above the 97.00 – 96.50 support region
* Continued higher low formation confirms recovery structure
🎯 Target 1: 101.00
🎯 Target 2: 103.50
❌ Bearish Scenario ⚠️
* A breakdown below 95.50 may invalidate the bullish outlook
🎯 Downside Target 1: 95.00
🎯 Downside Target 2: 94.00
📍 Critical Levels to Monitor
🔴 Immediate Resistance: 101.00
🔴 Major Resistance: 103.50 (Resistance Area)
🟢 Key Support Zone: 97.00 – 95.50
⚠️ Trading Insight
Price is currently reacting from a well-defined support zone and showing early signs of bullish recovery. Sustaining above this region would support further upside toward resistance, while rejection or breakdown could lead to renewed downside pressure.
Note:
This analysis is based on current market structure and price action. Market conditions may evolve—always use proper risk management.
Trade active
🔔 Join Telegram for more charts & updates:
👉 t.me/+gdlWuPahqfw2M2Rk
👉 t.me/+gdlWuPahqfw2M2Rk
Free Forex Signal's
👉 t.me/THEKINGOFGOLD75
👉 t.me/+gdlWuPahqfw2M2Rk
👉 t.me/+gdlWuPahqfw2M2Rk
Free Forex Signal's
👉 t.me/THEKINGOFGOLD75
Disclaimer
The information and publications are not meant to be, and do not constitute, financial, investment, trading, or other types of advice or recommendations supplied or endorsed by TradingView. Read more in the Terms of Use.