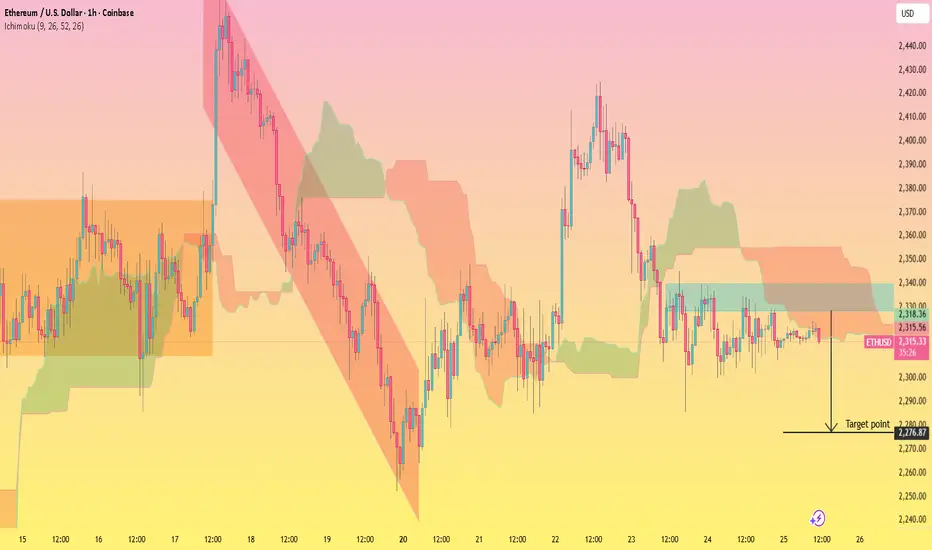
This 1H ETHUSD chart highlights a clear **bearish trend structure** that originated from a descending channel (marked in red), where price respected lower highs and lower lows. After a strong sell-off, the market formed a temporary base and attempted a bullish push, but momentum weakened near resistance.
Currently, price is **consolidating below a key resistance zone (around 2,330 – 2,340)**, which aligns with the Ichimoku cloud acting as dynamic resistance. The repeated rejection from this area signals a lack of bullish strength, suggesting sellers are still in control.
The sideways movement indicates accumulation before a potential continuation move. If price fails to break above resistance, a bearish breakdown is likely.
**🎯 Target:**
* **Primary Target:** 2,276
* This level represents the next support zone and aligns with the projected breakdown move.
**⚠️ Key Levels to Watch:**
* Resistance: 2,330 – 2,340 (supply + cloud resistance)
* Support: 2,300 → 2,276 (breakdown zone and target)
**💡 Insight:**
As long as ETH remains below the resistance zone and inside the consolidation range, the bias stays **bearish**. A clean breakdown below 2,300 will likely accelerate selling toward the target, while a strong breakout above 2,340 would invalidate this setup.
Trade active
Active telegram channel link
t.me/+r9_PoETjAr85Nzlk
join to get daily basis 2-3 free signal for educational purpose
t.me/+r9_PoETjAr85Nzlk
get information about Gold, BTC and forex market
t.me/+r9_PoETjAr85Nzlk
t.me/+r9_PoETjAr85Nzlk
join to get daily basis 2-3 free signal for educational purpose
t.me/+r9_PoETjAr85Nzlk
get information about Gold, BTC and forex market
t.me/+r9_PoETjAr85Nzlk
Related publications
Disclaimer
The information and publications are not meant to be, and do not constitute, financial, investment, trading, or other types of advice or recommendations supplied or endorsed by TradingView. Read more in the Terms of Use.
telegram channel link
t.me/+r9_PoETjAr85Nzlk
join to get daily basis 2-3 free signal for educational purpose
t.me/+r9_PoETjAr85Nzlk
get information about Gold, BTC and forex market
t.me/+r9_PoETjAr85Nzlk
t.me/+r9_PoETjAr85Nzlk
join to get daily basis 2-3 free signal for educational purpose
t.me/+r9_PoETjAr85Nzlk
get information about Gold, BTC and forex market
t.me/+r9_PoETjAr85Nzlk
Related publications
Disclaimer
The information and publications are not meant to be, and do not constitute, financial, investment, trading, or other types of advice or recommendations supplied or endorsed by TradingView. Read more in the Terms of Use.