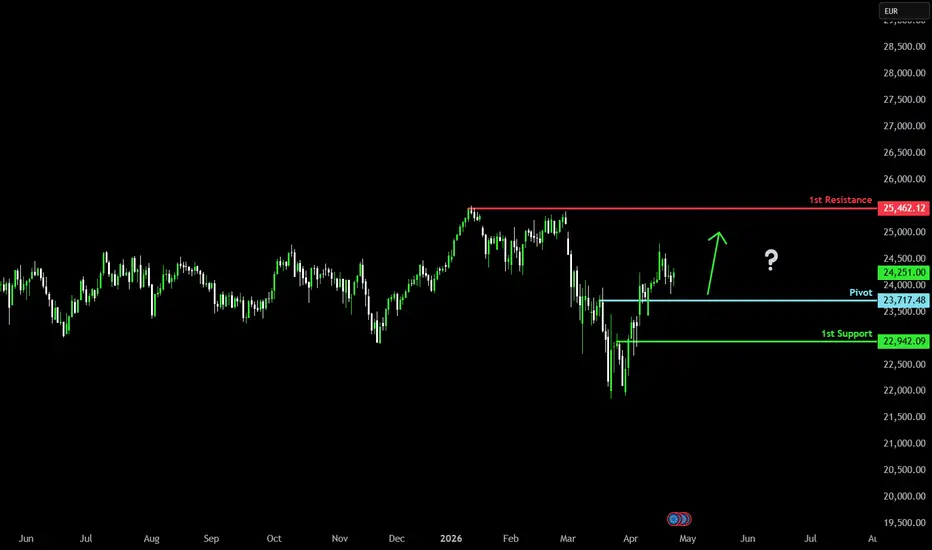
Potential bullish bounce?DAX40 (DE40) is falling towards the pivot and could bounce towards the 1st resistance.
Pivot: 23,717.48
1st Support: 22,942.09
1st Resistance: 25,462.12
Disclaimer:
The opinions given above constitute general market commentary and do not constitute the opinion or advice of IC Markets or any form of personal or investment advice.
Any opinions, news, research, analyses, prices, other information, or links to third-party sites contained on this website are provided on an "as-is" basis, are intended to be informative only, and are not advice, a recommendation, research, a record of our trading prices, an offer of, or solicitation for, a transaction in any financial instrument and thus should not be treated as such. The information provided does not involve any specific investment objectives, financial situation, or needs of any specific person who may receive it. Please be aware that past performance is not a reliable indicator of future performance and/or results. Past performance or forward-looking scenarios based upon the reasonable beliefs of the third-party provider are not a guarantee of future performance. Actual results may differ materially from those anticipated in forward-looking or past performance statements. IC Markets makes no representation or warranty and assumes no liability as to the accuracy or completeness of the information provided, nor any loss arising from any investment based on a recommendation, forecast, or any information supplied by any third party.
DAX Index
No trades
In-depth trading ideas
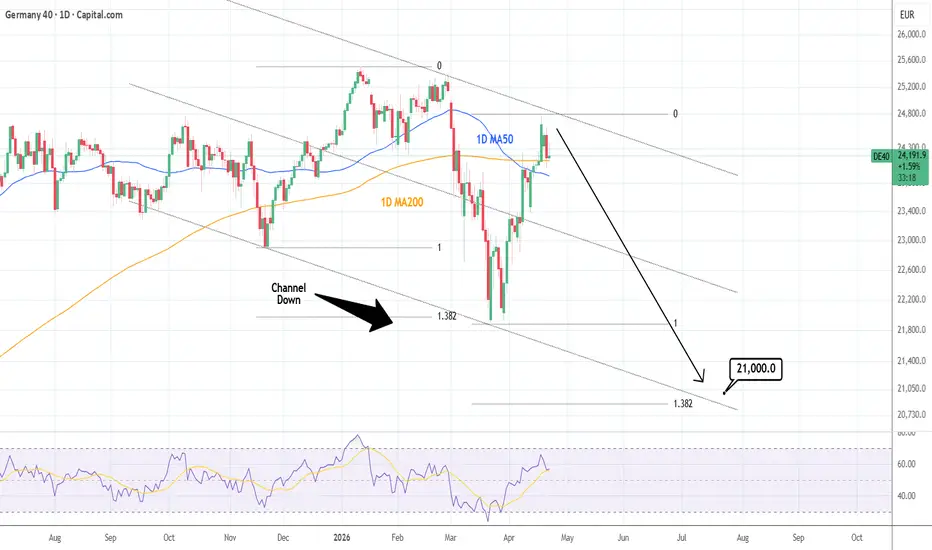
DAX: Channel Down formed a new top.DAX remains marginally bullish on its 1D technical outlook (RSI = 56.055, MACD = 147.200, ADX = 25.024) but has turned bearish on the 1H and 4H timeframes as the recent 4 week rally got rejected at the top of the wider Channel Down pattern. Technically that was its bullish wave and got completed. A cross under the 1D MA50 would serve as validation for the start of the bearish wave. The one prior targeted the 1.382 Fibonacci extension. Expect a similar target (TP = 21,000).
## If you like our free content follow our profile to get more daily ideas. ##
## Comments and likes are greatly appreciated. ##
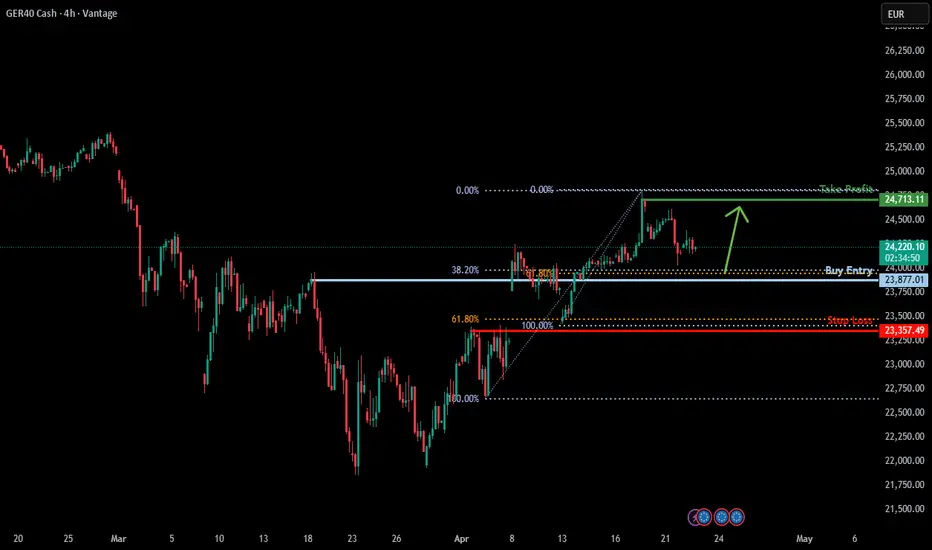
Bullish bounce off Fib support?GER40 is falling towards the support level, which is an overlap that aligns with the 38.2% and 61.8% Fibonacci retracements, and could bounce from this level to our take profit.
Entry: 23,877.01
Why we like it:
There is an overlap support level that aligns with the 38.2% and the 61.8% Fibonacci retracement.
Stop loss: 23,357.49
Why we like it:
There is an overlap support level that lines up with the 61.8% Fibonacci retracement.
Take profit: 24,713.11
Why we like it:
There is a pullback resistance.
Enjoying your TradingView experience? Review us!
Please be advised that the information presented on TradingView is provided to Vantage (‘Vantage Global Limited’, ‘we’) by a third-party provider (‘Everest Fortune Group’). Please be reminded that you are solely responsible for the trading decisions on your account. There is a very high degree of risk involved in trading. Any information and/or content is intended entirely for research, educational and informational purposes only and does not constitute investment or consultation advice or investment strategy. The information is not tailored to the investment needs of any specific person and therefore does not involve a consideration of any of the investment objectives, financial situation or needs of any viewer that may receive it. Kindly also note that past performance is not a reliable indicator of future results. Actual results may differ materially from those anticipated in forward-looking or past performance statements. We assume no liability as to the accuracy or completeness of any of the information and/or content provided herein and the Company cannot be held responsible for any omission, mistake nor for any loss or damage including without limitation to any loss of profit which may arise from reliance on any information supplied by Everest Fortune Group.
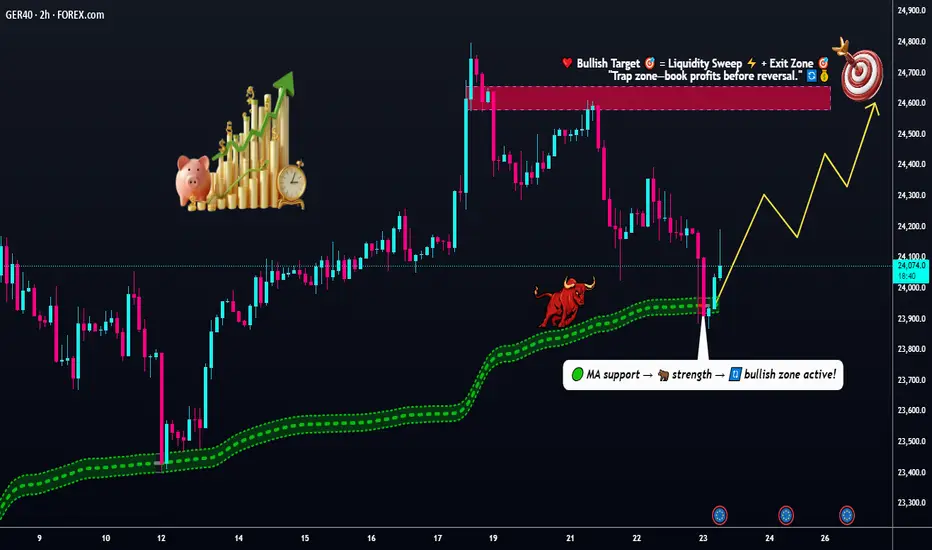
GER40 Setup – Liquidity Trap + Continuation🔥 GER40 | DAX 40 (Germany 40 Index CFD) — Day/Swing Trade Opportunity 🇩🇪📊
🎯 TRADE PLAN — BULLISH SMA PULLBACK SETUP
💡 Asset: GER40 — Germany 40 Index CFD (DAX 40 | Frankfurt Stock Exchange Benchmark)
📅 Timeframe: Day Trade / Swing Trade
📐 Bias: Bullish — SMA Pullback Entry Technique
⚡ Strategy: Ride the pullback wave on the Simple Moving Average — enter smart, exit smarter!
🚀 ENTRY ZONE — THE HEIST BEGINS
🟢 Entry: ANY PRICE LEVEL near current market price — this is a flexible zone entry, not a fixed sniper shot. Watch the SMA pullback on your preferred timeframe and enter with confirmation. The market rewards the patient thief, not the impulsive one!
📌 Pro Tip: Wait for a clean candle close above the SMA on the 15M or 1H chart before pulling the trigger. Confluence is king 👑
🎯 TARGET — THE ESCAPE ROUTE (TAKE PROFITS & RUN!)
🏴☠️ Primary Target: 24,600 📍
⚠️ Why 24,600?
This level is acting as a strong resistance fortress 🏰 — a confluence of:
🔴 Overbought zone — momentum exhaustion approaching
Bull trap territory — smart money may flip here
🔄 Potential reversal zone — price has historically respected this ceiling
👮 Police Force Resistance — the market's own law enforcement stopping the rally cold!
🎩 Dear Ladies & Gentlemen — Thief OG's! I am NOT recommending you lock in ONLY my TP level. The market is YOUR playground, and YOUR pocket is YOUR responsibility. Take money when money is there! Collect your profits and escape the scene before the reversal police arrive! 💸💨
🛑 STOP LOSS — THE SAFETY VAULT
🔴 Thief SL: 23,700 📍
This is the fortress wall below — a critical structural support zone. If price breaks and closes below this level, the bullish thesis is INVALID and we must respect the market's decision.
🎩 Dear Ladies & Gentlemen — Thief OG's! I am NOT recommending you set ONLY my SL level as a rule. Risk management is YOUR own game. Size your positions right, protect your capital like it's the crown jewels, and never risk more than you can afford to lose! 🛡️
🌍 CORRELATED PAIRS & ASSETS TO WATCH 👀
These assets move in sync or show meaningful correlation with GER40 — monitor them for confluence and confirmation signals:
📌 European Index Peers (Direct Correlation)
🇫🇷 FRA40 (CAC 40) — France's top 40, mirrors GER40 sentiment closely. If CAC drops, DAX usually follows.
🇪🇺 EUSTX50 (Euro Stoxx 50) — The Eurozone's headline benchmark. GER40 is its largest component driver.
🇬🇧 UK100 (FTSE 100) — Moderate correlation; diverges on GBP/EUR dynamics but tracks risk-on/risk-off flows.
🇮🇹 ITA40 (FTSE MIB) — Peripheral European cousin; moves on same ECB policy newsflow.
💱 FX Pairs (Critical Correlation)
💶 OANDA:EURUSD — Negative correlation with GER40. A weaker Euro = cheaper German exports = potential DAX tailwind. Watch 1.1776 (current level) closely. A EUR/USD rally CAN cap GER40 upside.
💷 OANDA:EURGBP — Cross to monitor for broader Euro sentiment shifts impacting German equities.
💴 FX:USDJPY (159.15) — Risk appetite barometer. Rising USD/JPY = risk-on globally = DAX supportive.
🇨🇭 OANDA:USDCHF (0.7837) — Swiss Franc is a safe haven. Rising USD/CHF = risk appetite returning = bullish signal for GER40.
🛢️ Commodities (Key Drivers)
🛢️ TVC:USOIL / BLACKBULL:WTI Crude — Middle East tensions are currently driving oil. Higher oil = energy cost pressure on German industrials = potential DAX headwind. Watch Strait of Hormuz news closely.
🥇 OANDA:XAUUSD (Gold) — Safe haven flows. If Gold spikes, it signals risk-off — negative for GER40.
📰 REAL-TIME FUNDAMENTALS & ECONOMIC FACTORS 🌐
Based on live verified market data — London Time (BST) — as of 23 April 2026
🏦 ECB MONETARY POLICY
The European Central Bank held interest rates unchanged at its March 2026 meeting, with the main refinancing rate at 2.15%, deposit facility at 2.0%, and marginal lending rate at 2.4%. TRADING ECONOMICS No immediate cut is expected — the ECB is in a "wait and watch" mode, which keeps borrowing costs stable but doesn't add fresh fuel to equity rallies.
📈 CURRENT DAX PRICE ACTION
The DAX 40 rose approximately 0.4% to around 24,370 on Wednesday, attempting a recovery after two consecutive sessions of decline, as investors weighed geopolitical developments in the Middle East that pulled back oil prices. TRADING ECONOMICS
The DAX's all-time high was recorded on 13 January 2026 at 25,507.79 EUR. TradingView Current price is well below that ATH — meaning there is headroom to the upside IF risk sentiment recovers.
⚡ KEY MARKET MOVERS (Live)
Technology and energy-sensitive industrials are standout performers — Infineon surged over 3%, Siemens Energy gained approximately 2%, while Deutsche Telekom fell sharply after reports of a potential full merger with its US mobile arm T-Mobile US. Retailers Zalando and Adidas also faced selling pressure. TRADING ECONOMICS
🌐 GEOPOLITICAL RISK — THE BIGGEST WILDCARD
The DAX's sharper sell-off in recent sessions reflects Germany's particular vulnerability to energy price shocks, given its status as Europe's largest industrial economy and one of the continent's most oil-dependent manufacturing nations. BBN Times
The ECB has acknowledged that the Middle East war has significantly increased uncertainty, creating upside risks for inflation and downside risks for growth. Headline inflation is now projected at 2.6% in 2026. TRADING ECONOMICS
🏗️ GERMAN FISCAL TAILWINDS
Starting in Q2 2026, the Bundesbank expects economic growth to strengthen, driven mainly by government spending and a resurgence in exports — with additional defence and infrastructure expenditure set to push up government demand sharply. Deutsche Bundesbank This is a structural positive for German equities over the medium term.
📊 UPCOMING HIGH-IMPACT EVENTS TO MONITOR 🗓️
🔴 ECB Press Conference / Rate Decision — next scheduled meeting is a major volatility trigger
🔴 German CPI / Inflation Data — any surprise higher = potential ECB hawkishness = bearish for DAX
🔴 US Non-Farm Payrolls (NFP) — global risk sentiment driver
🔴 Strait of Hormuz / Middle East ceasefire developments — direct oil price and DAX mover
🔴 EUR/USD movement above 1.18 — could become a headwind for German export earnings
🧠 Trader Psychology Insight
“Overbought doesn’t mean sell.
It means smart money is preparing liquidity.”
Most traders enter late.
Professionals wait for pullbacks.
🔥 Thief Trader Mindset
“Take profit like a professional — not like a dreamer.”
“The market doesn’t pay for opinions, it pays for discipline.”
Stay sharp. Stay patient. Take what’s yours — not what’s hyped.
⭐ Engagement Boost
If this setup aligns with your view:
👍 Like | 💬 Comment | 🔔 Follow
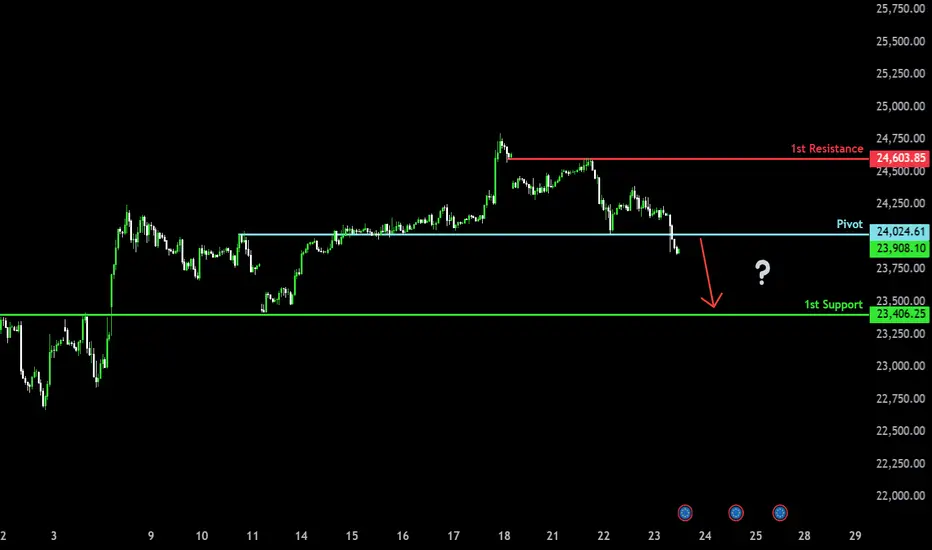
Potential bearish reversal?DAX40 (DE40) is rising towards the pivot and could drop towards the overlap support.
Pivot: 24,024.61
1st Support: 23,406.25
1st Resistance: 24,603.85
Disclaimer:
The opinions given above constitute general market commentary and do not constitute the opinion or advice of IC Markets or any form of personal or investment advice.
Any opinions, news, research, analyses, prices, other information, or links to third-party sites contained on this website are provided on an "as-is" basis, are intended to be informative only, and are not advice, a recommendation, research, a record of our trading prices, an offer of, or solicitation for, a transaction in any financial instrument and thus should not be treated as such. The information provided does not involve any specific investment objectives, financial situation, or needs of any specific person who may receive it. Please be aware that past performance is not a reliable indicator of future performance and/or results. Past performance or forward-looking scenarios based upon the reasonable beliefs of the third-party provider are not a guarantee of future performance. Actual results may differ materially from those anticipated in forward-looking or past performance statements. IC Markets makes no representation or warranty and assumes no liability as to the accuracy or completeness of the information provided, nor any loss arising from any investment based on a recommendation, forecast, or any information supplied by any third party.
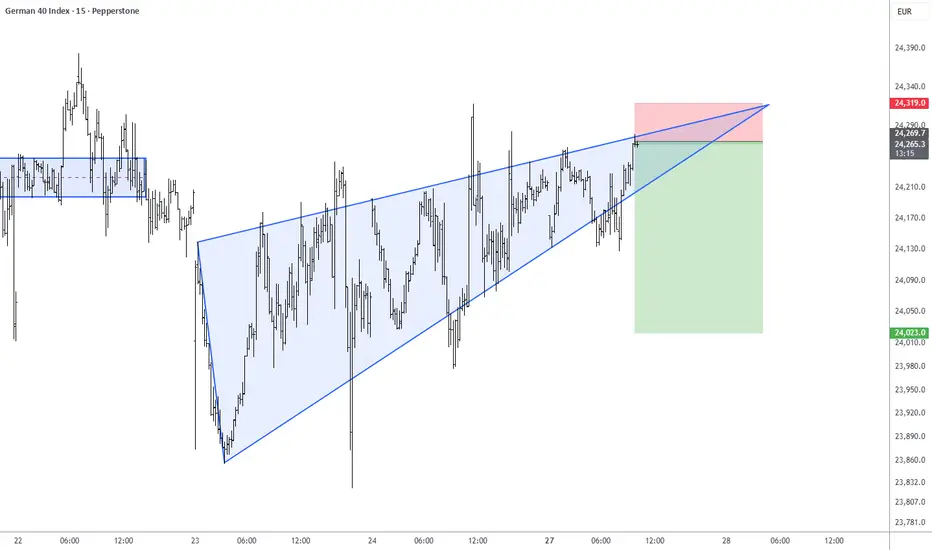
GER40 - Channel Pullback Signals Breakout AheadPrice is correcting within a descending channel after the recent high near 24,790 , with structure showing lower highs and controlled downside. The key level to watch is the support zone around 23,600 – 23,650 , which aligns with the lower boundary of the channel. A dip into this area is likely, and how price reacts here will decide the next move. Immediate resistance stands near 24,261 , and a move above this level is needed to shift short-term momentum.
From an Elliott Wave perspective, the correction looks like a WXY structure, with the current leg potentially completing wave (Y) near the support zone. If price holds 23,600 – 23,650 and breaks above the channel resistance, it can trigger a fresh impulsive move toward 24,790 and higher. However, a breakdown below this support would weaken the setup and open downside toward 23,200 .
We will update further information soon.
@BrightRally_Research

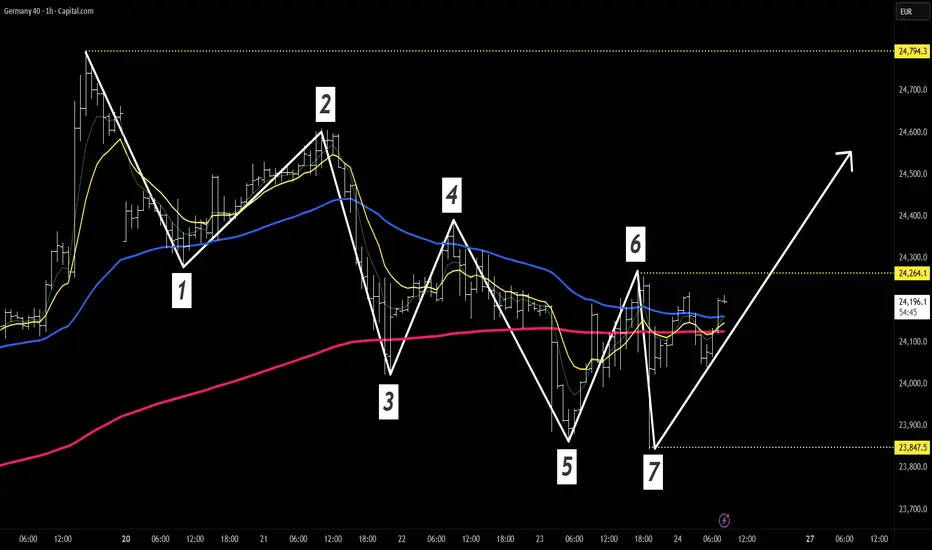
7-Wave Correction Suggests Upside Reversal Potential in DAXFrom an Elliott Wave perspective, the decline from the recent highs is unfolding in a 7-wave sequence, which strongly suggests a corrective structure rather than an impulsive move.
This is a key distinction.
A 5-wave move would imply trend continuation to the downside.
A 7-wave sequence, instead, typically reflects a complex correction, meaning the market is absorbing liquidity rather than initiating a new bearish trend.
At this stage, price action is compressing near the lows, and the structure appears to be maturing.
The confirmation level to watch is 24,264.
A sustained break above this level would signal that the corrective phase is likely complete, opening the door for a trend resumption to the upside.
If this scenario plays out, the DAX has the potential to reclaim higher ground and rotate back toward — and possibly above — 24,794, which marks the prior key high.
Until that confirmation is triggered, the structure remains corrective, but the asymmetry is clearly shifting.
Conclusion:
Corrective market → waiting for confirmation → upside potential building.
DAX30/GER40 -WHERE ARE YOU GOINGTeam, strong momentum continues — and so do we.
Six out of six winning days since going LIVE again is exactly the kind of disciplined, controlled execution we stand for. The goal now is simple: stay sharp, stay patient, and see if we can push past our previous 96‑day streak without a single losing day.
Now back to business — DAX is moving aggressively, just as we projected 2–3 weeks ago when we said NAS, DAX, and DOW would push toward the upper end of their ranges. That move is now unfolding in real time.
DAX Trade Plan — LONG Position
Entry Zone: 24,260 – 24,230
Stop Loss: 24,065
Target 1: 24,300 – 24,325
Target 2: 24,345 – 24,396
Target 3: 24,410 – 24,600
Risk Management
Once T1 is hit:
Take partial profits
Move stop loss to BREAKEVEN
Let the rest run with zero emotional pressure
LETS GO

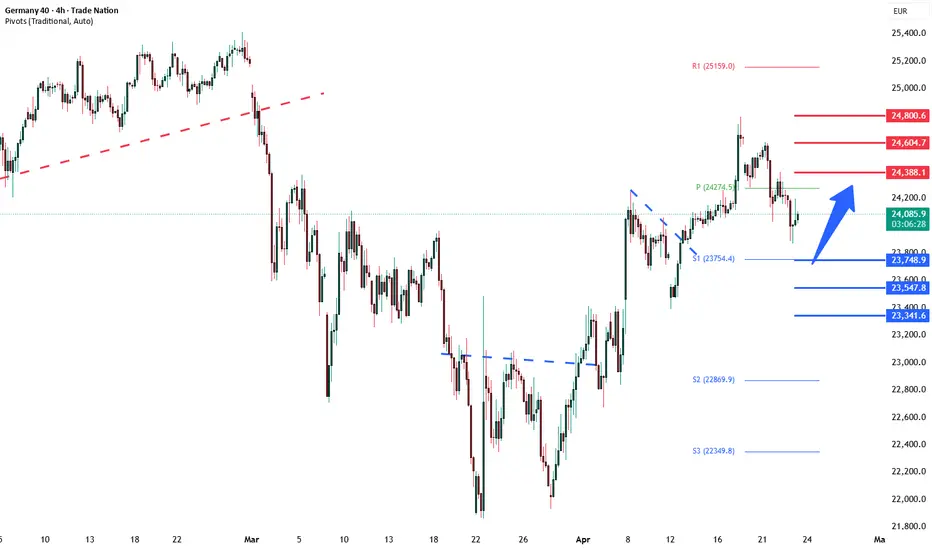
DAX corrective pullback support at 23750The DAX remains in a bullish trend, with recent price action showing signs of a corrective pullback within the broader uptrend, potentially setting up for another move higher if support holds.
Support Zone: 23750 – a key level from previous consolidation. Price is currently testing or approaching this level.
A bullish rebound from 23750 would confirm ongoing upside momentum, with potential targets at:
24390 – initial resistance
24600 – psychological and structural level
24800 – extended resistance on the longer-term chart
Bearish Scenario:
A confirmed break and daily close below 23750 would weaken the bullish outlook and suggest deeper downside risk toward:
23550 – minor support
23340 – stronger support and potential demand zone
Outlook:
Bullish bias remains intact while the DAX holds above 23750. A sustained break below this level could shift momentum to the downside in the short term.
This communication is for informational purposes only and should not be viewed as any form of recommendation as to a particular course of action or as investment advice. It is not intended as an offer or solicitation for the purchase or sale of any financial instrument or as an official confirmation of any transaction. Opinions, estimates and assumptions expressed herein are made as of the date of this communication and are subject to change without notice. This communication has been prepared based upon information, including market prices, data and other information, believed to be reliable; however, Trade Nation does not warrant its completeness or accuracy. All market prices and market data contained in or attached to this communication are indicative and subject to change without notice.
Elliott Wave Outlook — DAX at a Decision PointWe are currently at a critical inflection zone, where confirmation is required before committing to directional bias.
From the 24,794.3 high, price has developed a three-wave corrective structure within a broader uptrend. This type of price action typically suggests a corrective pullback rather than a completed top, implying that the primary trend could still resume higher.
However, this bullish continuation scenario remains unconfirmed.
👉 Key level for confirmation: 24,606.7
Only a sustained move above this level would validate that the correction is complete and that the market is resuming its impulsive structure to the upside.
Alternative Scenario — B Wave Top in Place
At the same time, we must consider the possibility that the recent high marks a wave (B) top of a larger corrective structure.
In this case, the market would be preparing for a wave (C) decline of higher degree, implying a broader downside move.
The recent bounce from 24,020.0 is also unfolding in a three-wave structure, which is corrective in nature and does not yet support a bullish impulsive reversal.
👉 Key downside trigger: 24,193.7
A break below this level would suggest that sellers are regaining control, increasing the probability that wave (C) to the downside is underway.
Tactical Conclusion
At this stage, the market is neutral and waiting for confirmation.
Above 24,606.7 → bullish continuation (trend resumption)
Below 24,193.7 → bearish acceleration (wave C in progress)
Until one of these levels is decisively broken, price action remains corrective and non-directional.
Time to wait for confirmation — not to anticipate.

DAX/GER — NEXT MEAL PLANTeam, Yesterday we cleaned up with all 3 targets hit, and even with the wild volatility an hour ago while you were at the gym.
Now it’s about patience, precision, and letting the market come to US — not chasing.
Trump can drop a threat or a peace tweet at any moment, so volatility is guaranteed. That’s why we stick to levels, not emotions.
ENTRY LEVELS
Main Limit Buy Zone: 23727–23778
This is our primary liquidity pocket. This is where we want size.
Optional Small Entry: 23815–23845
Only if price action is clean at the moment of reading. This is a scout entry, not a full position.
Target 1: 23885–23932
Target 2: 23945–23986
Target 3: 24000–24120
Take partials at T1 -Move stop to break-even
Let the rest run with zero stress
TEAM — LET’S BE PATIENT, LET’S BE PREPARED
We wait. We execute. We collect.
LETS GO

GER30 SHORTSell side shift on the monthly TF, strong W1 FVG, D1 Shift to the downside now looking to sell toward the weekly support level. It's a good swing setup..

THE SHORT ON GER30From the daily FVG we will look to short ger30 but we needed a 4h fvg to give the entry a line so now that the market gave us a bearish engulfing candle we will shot it.

CARTELA | GER40 SELL IDEAPrice is reacting off of pullback resistance. I anticipate selling pressure to emerge from that level. A sell opportunity is envisaged once we get confirmation from the lower timeframe.

DAXLate post of Idea. Clear sweep on 1H and Shift model on 5m. Target is compression bellow. Let's see


DAX Into Key Inflection Zone (23,000–23,250)European markets are starting to reprice a more difficult macro backdrop after the latest PMI data pointed toward early stagflation dynamics — slowing growth with persistent inflation pressure.
That matters because it removes the clean “soft landing” narrative and replaces it with something more unstable:
Growth rolling over (especially services)
Costs still rising
Limited room for policy support
For equities, that typically leads to margin pressure before earnings revisions catch up.
Technical Focus — DAX
From a price perspective, the DAX is now approaching a high-probability reaction zone:
Key Area: 23,000 – 23,250
This zone combines multiple technical factors:
50% – 61.8% Fibonacci retracement
Anchored VWAP from March 20th lows
Prior structure where positioning can shift
This makes it less of a random level and more of a true decision point.
Scenarios to Watch
1, Rejection at 23,000–23,250 (Higher Probability Initially)
Price taps into the zone and fails
Momentum slows / sellers step in
Signals exhaustion + start of repricing
- This aligns with the macro backdrop (stagflation risk)
2, Acceptance Above the Zone (Lower Probability Near-Term)
Price holds above and builds structure
Would require improving data or sentiment shift
Less likely unless macro stabilises quickly


DAX (DE40): Corrective Rally vs Structural BottomThe current DAX structure presents a clear corrective rebound within a broader bearish sequence, but with a credible alternative scenario suggesting a completed bottom and the start of a new impulsive cycle.
Primary Count (Corrective Structure — ABC in Progress)
The dominant interpretation sees the market unfolding a corrective ABC structure following a completed impulsive decline from the highs.
The move into 21,850 is labeled as Wave (A) — a capitulation leg with strong momentum and volume expansion.
The current rally is developing as Wave (B), retracing a significant portion of the decline.
Price is now approaching a key resistance zone around 24,700 – 25,000, where corrective rallies typically exhaust.
Structurally, the current leg shows:
→ Overlapping price action
→ Lack of impulsive acceleration
→ Reaction-based buying rather than initiative flow
If this count holds, the next phase should be:
→ Wave (C) lower, targeting a retest or break of the lows
→ Potential extension toward the 20,500 – 21,000 region
This would complete a higher-degree correction before any sustainable upside.
Alternative Count (Bottom in Place — New Impulse Starting)
The alternative scenario assumes that 21,850 marked a completed correction, and the market has already transitioned into a new bullish cycle.
The rally off the lows can be interpreted as Wave (1) of a new impulse.
The current structure may be a developing Wave (2) or early Wave (3) depending on continuation.
The reclaim of key moving averages and acceptance above prior value areas supports accumulation dynamics.
For this scenario to gain validity, we need:
→ A clean breakout above 24,800 – 25,500
→ Expansion in momentum and range
→ Reduced overlap and stronger trend structure
If confirmed, the market could enter:
→ A Wave (3) expansion, typically the strongest phase
→ Upside continuation toward new highs over time
Key Levels & Triggers
24,800 – 25,500 → Critical resistance (decision zone)
23,300 area → Structural support / pivot
21,850 → Invalidates bullish scenario if broken
Conclusion
DAX is currently at a critical inflection point between:
A corrective rally within a broader bearish structure (primary count)
A completed bottom and early-stage bullish cycle (alternative count)
Until price confirms with a decisive breakout, this remains a reaction-driven market.
Let price confirm the count — not the other way around.

GER30 H4 | Heading Towards Overlap ResistanceBased on the H4 chart analysis, we could see the price rise towards our sell entry level at 24,288.54, which has been identified as an overlap resistance.
Our stop loss is set at 24,720.20, which is a pullback resistance that aligns with the 145% Fibonacci extension and the 78.6% Fibonacci projection.
Our take profit is set at 23,593.09, which is a pullback support.
High Risk Investment Warning
Stratos Markets Limited fxcm.com Stratos Europe Ltd fxcm.com
CFDs are complex instruments and come with a high risk of losing money rapidly due to leverage. 69% of retail investor accounts lose money when trading CFDs with this provider. You should consider whether you understand how CFDs work and whether you can afford to take the high risk of losing your money.
Stratos Global LLC fxcm.com Losses can exceed deposits.
Please be advised that the information presented on TradingView is provided to FXCM (‘Company’, ‘we’) by a third-party provider (‘TFA Global Pte Ltd’). Please be reminded that you are solely responsible for the trading decisions on your account. Any information and/or content is intended entirely for research, educational and informational purposes only and does not constitute investment or consultation advice or investment strategy. The information is not tailored to the investment needs of any specific person and therefore does not involve a consideration of any of the investment objectives, financial situation or needs of any viewer that may receive it. Past performance is not a reliable indicator of future results. Actual results may differ materially from those anticipated in forward-looking or past performance statements. We assume no liability as to the accuracy or completeness of any of the information and/or content provided herein and the Company cannot be held responsible for any omission, mistake nor for any loss or damage including without limitation to any loss of profit which may arise from reliance on any information supplied by TFA Global Pte Ltd.
Stratos Trading Pty. Limited fxcm.com
Trading FX/CFDs carries significant risks. FXCM AU (AFSL 309763), please read the Financial Services Guide, Product Disclosure Statement, Target Market Determination and Terms of Business at fxcm.com

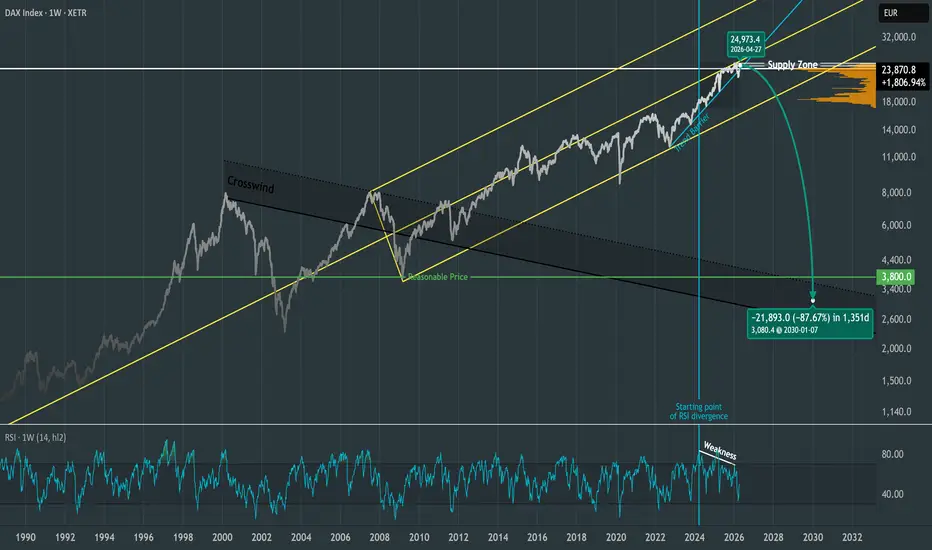
Forecast: DAX Revisiting 2009 LevelsI know this is a depressing suggestion — that equities could lose 70% or more of their current value. If you entered the market after the 2008 crisis, you have only known 17 years of growth. I do not blame you if this idea sounds unthinkable and I hope that I am wrong, but I think this setup is technically credible. It matches the mechanics I have seen across different markets and timeframes. For reference, see my similar idea "Later, Bitcoin!", which played out exactly as expected.
Technicals
The overall trend is still bullish, but because the 2020 pullback failed to fully reset the market, it has advanced in what I consider an unsustainable way. That has created a divergence between price and momentum, visible in RSI. From a pitchfork perspective, price tends to gravitate toward the next median line, where it can stall, break through, or reverse. The DAX has already hesitated around the middle line several times, and with the trend barrier now broken, I think a reversal may begin once we bid farewell to the nearby supply zone.
Once the decline starts, I expect price to at least reach the dotted line of the crosswind channel through what I call a nostalgia retracement — a return to old, broken, downsloping structures that often occurs before the trend resumes. In my experience, where horizontal support intersects with downsloping structures often becomes an attraction point for price. On the linear chart, I see the next meaningful support around 3,800.
Macro backdrop
The global fiat system, built on debt expansion and growing liquidity, can support rising asset prices for a long time — but that does not mean bubbles cannot burst. Germany has already been losing momentum, and the country’s 2026 growth forecast was just cut to 0.5% while inflation expectations were revised higher as rising energy costs weigh on the economy. That matters for the DAX because Germany remains highly exposed to industrial and energy-sensitive sectors.
Now add the war involving the U.S., Israel, and Iran. Major forecasters including the IEA have warned that the conflict has already disrupted oil supply, driven up energy prices, and worsened the global growth outlook. In that kind of environment, stagflation risk rises and both households and investors are forced to prioritize essentials like fuel and food over risk assets.
As for timing, the yield curve adds another warning signal. Historically, inversions have often preceded recessions, and normalization after inversion has frequently happened close to the downturn rather than far ahead of it. I do not treat that as a fixed rule, but in the current backdrop it adds to the view that the macro picture is fragile rather than supportive.
DAX back on its 1W MA50 eyes rejection to 20000.DAX (DE40) is having a massive 3-week rebound after touching its 1W MA100 (green trend-line) that brought it back to its 1W MA50 (blue trend-line). So far it's been rejected there last week, closing below it, and this is a critical level as it was the break below the 1W MA50 that confirmed the start of the current Bear Cycle.
As long as DAX stays below, we should see Phase 2 of the Bear Cycle starting. The pattern is so far identical to the 2022 Bear Cycle both structurally and in terms of timing. It was in April 2022 when the index after a similar aggressive rebound (see how both took place on an oversold 1W RSI) recovered losses up to the 0.618 Fibonacci (blue) but in the coming weeks failed to restore the bullish sentiment and eventually dropped to Lower Lows.
The total decline was -27.50% but since the current start has been slower so far, DAX may settle for 'just' a 1W MA200 (orange trend-line) test. As a result, we expect the index to target 20000 at least.
---
** Please LIKE 👍, FOLLOW ✅, SHARE 🙌 and COMMENT ✍ if you enjoy this idea! Also share your ideas and charts in the comments section below! This is best way to keep it relevant, support us, keep the content here free and allow the idea to reach as many people as possible. **
---
Disclosure: I am part of Trade Nation's Influencer program and receive a monthly fee for using their TradingView charts in my analysis.
💸💸💸💸💸💸
👇 👇 👇 👇 👇 👇
