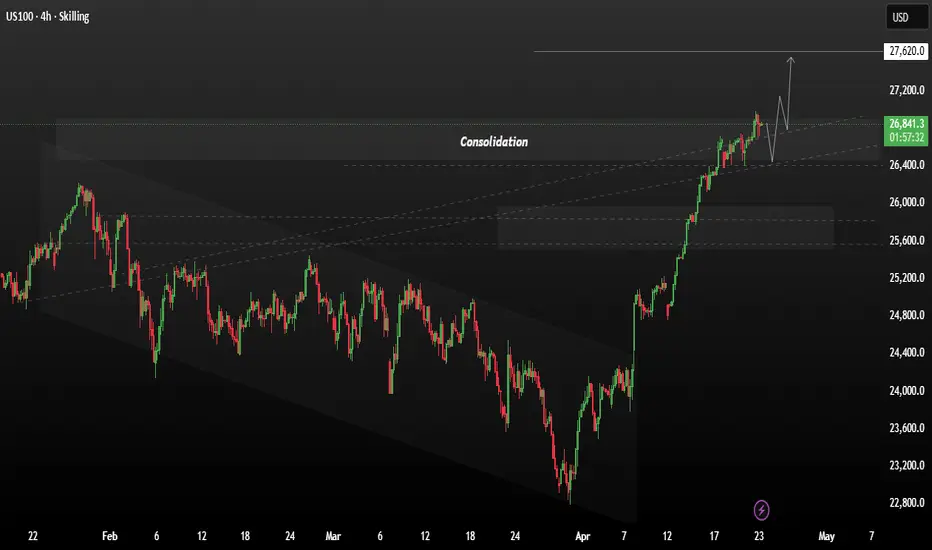
US100 Balanced Structure: Next Move Depends on BreakUS100 is currently showing a strong bullish trend, backed by both technical structure and fundamental strength.
Furthermore, improving geopolitical conditions and reduced global uncertainty are creating a risk-on environment, encouraging investors to move into equities. Institutional buying and consistent capital inflows are also adding strength to the trend, while seasonal momentum during this period is supporting continued upside pressure.
At the same time, the bullish movement is strongly supported by key market drivers. The Nasdaq continues to benefit from strong corporate earnings, especially from major tech companies, which is increasing investor confidence. In addition, the ongoing AI-driven growth is pushing tech stocks higher, making US100 one of the strongest-performing indices.
Tecnically the market has successfully broken out of a prolonged bearish channel, confirming a clear shift in momentum. After the breakout, price delivered a strong impulsive move upward, forming higher highs and higher lows a classic bullish structure at the moment, price is consolidating between 26,400 – 26,900, which indicates a healthy pause after the rally. This consolidation is acting as an accumulation phase, suggesting the market is preparing for the next move higher rather than reversing.
You may find more details in the chart,
Trade wisely best of luck buddies.
Ps; Support with like and comments for better analysis Thanks for Supporting.
Nasdaq 100 Index
No trades
In-depth trading ideas
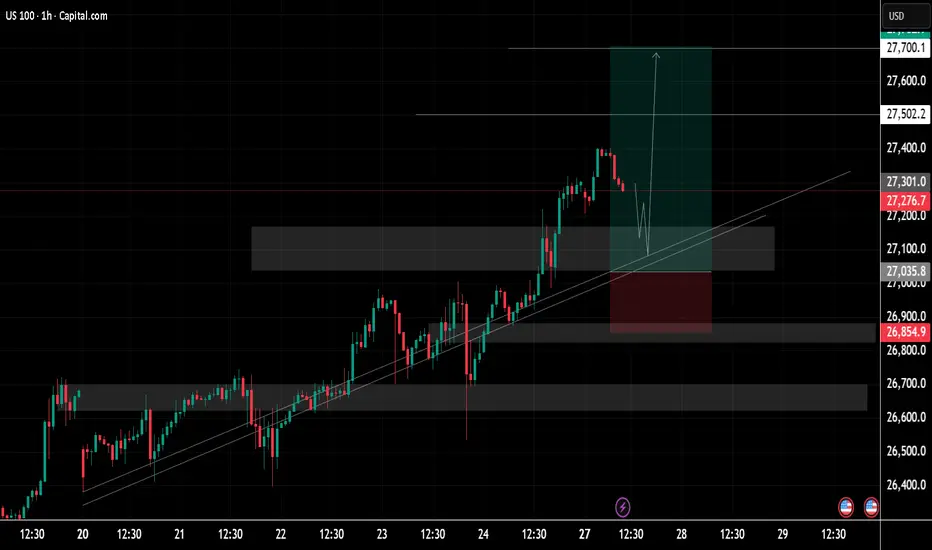
US100 Price Update – Clean & Clear ExplanationUS 100 a strong upward trend, where the price has been consistently respecting an ascending trendline. This suggests the market is bullish and likely to continue moving higher if the support levels remain intact.
In terms of risk management, the stop-loss is set at 26,854, a critical support level. This level is essential for determining the trend's strength; if the price dips below this, the market might experience a significant reversal. The gray areas on the chart indicate possible resistance levels, and the current price action suggests that if the index can break through these levels, it will likely continue its upward momentum, aiming for the next resistance level at 27,700.
For traders, the best strategy right now would be to consider entering a long position as the price approaches the ascending trendline support. This entry should aim for a target at the upper resistance zone around 27,700, with a stop-loss positioned just below the recent low near 26,854 to manage risk. This approach takes advantage of the current bullish momentum while safeguarding against potential downside movement.
Ps; Support with like and comments for better analysis Thanks for Supporting.
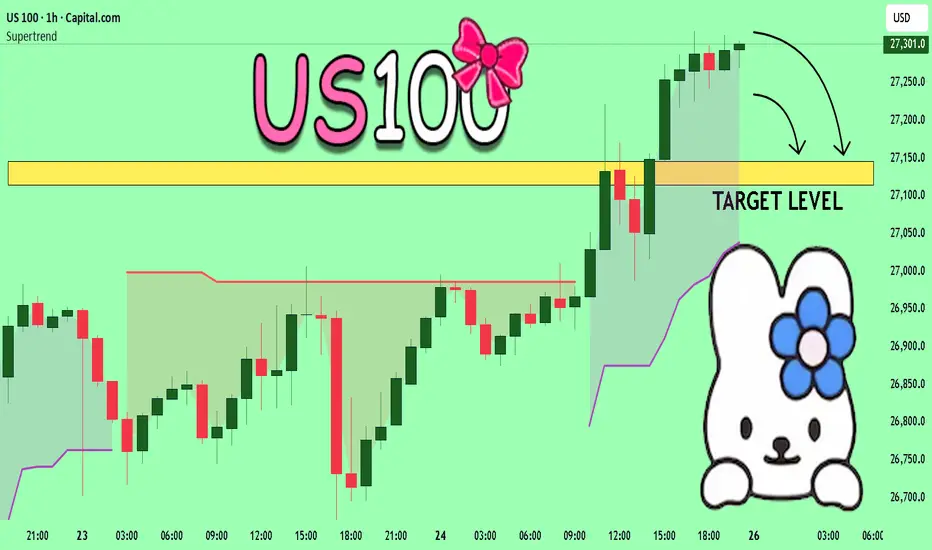
US100 Massive Short! SELL!
My dear friends,
My technical analysis for US100 is below:
The market is trading on 27301 pivot level.
Bias - Bearish
Technical Indicators: Both Super Trend & Pivot HL indicate a highly probable Bearish continuation.
Target - 27145
About Used Indicators:
A pivot point is a technical analysis indicator, or calculations, used to determine the overall trend of the market over different time frames.
Disclosure: I am part of Trade Nation's Influencer program and receive a monthly fee for using their TradingView charts in my analysis.
———————————
WISH YOU ALL LUCK
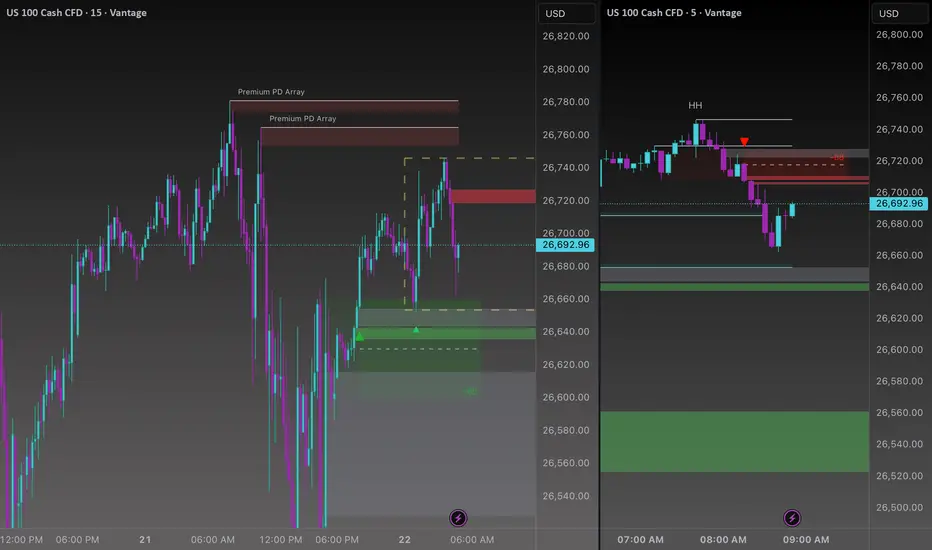
Trap Below. Run Above.VANTAGE:NAS100 26,740 – 26,660 is my key trading range for today.
This range is formed between:
• Equal highs / HH area near 26,740 (buy side liquidity)
• Discount PD Array + demand zone around 26,660 (where price already reacted)
CAPITALCOM:US100 Price already showed rejection from the bearish OG zone (BB) near 26,720–26,740, and we saw displacement to the downside, tapping into discount.
Now we are sitting inside a discount PD array, where buyers are expected to step in.
If price sweeps below 26,660 (taking sell side liquidity resting under the lows) and then reclaims the range with a strong bullish 5M close, I’m looking for long continuation back to 26,740, targeting the buy side liquidity above.
Why this setup makes sense:
• Bearish OG zone already delivered reaction (sellers got their move)
• Price is now in discount → favorable for longs
• Liquidity resting both sides, but sell-side likely to be taken first
• Reclaim = confirmation smart money shifted direction
Entry will be based on:
• Strong bullish displacement candle on 5M
• Volume expansion confirming buyers stepping in
• Holding above the range after reclaim (no weak fakeouts)
Target: 26,740 (Buy side liquidity / equal highs)
Invalidation: Acceptance back below 26,660
This is a liquidity grab → discount reaction → reclaim → expansion setup.
No reclaim, no trade📈
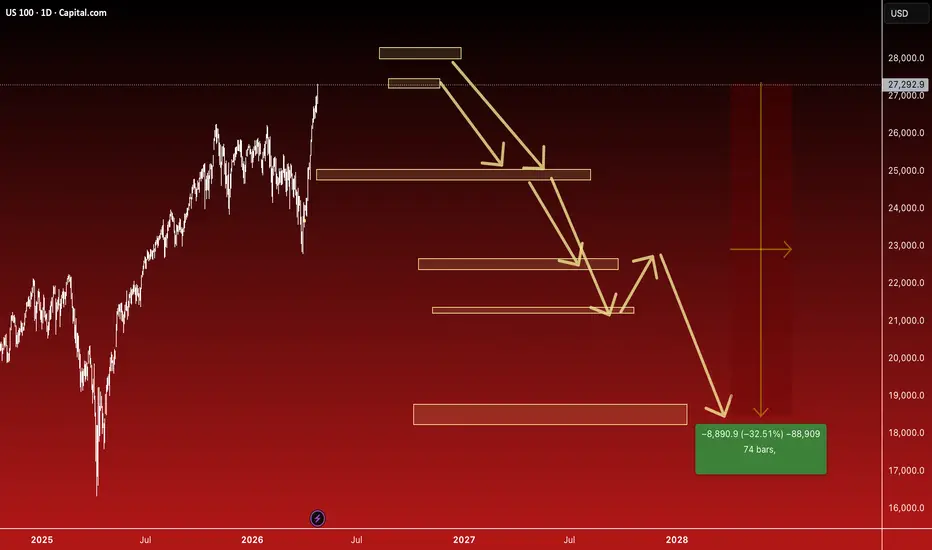
#Nasdaq Strategic Outlook Amid Geopolitical & Inflationary Risks
The Nasdaq (US100) is reaching critical technical thresholds that coincide with a resurgence of systemic macro risks. The confluence of rising energy costs and escalating geopolitical instability suggests that the index is primed for a significant corrective phase.
### **🔹 Fundamental Drivers**
* **Inflationary Pressure:** Anticipated spikes in inflation reports—driven by rising oil prices—are expected to weigh heavily on growth-sensitive tech stocks, potentially forcing a more hawkish stance from central banks.
* **Geopolitical Instability:** The looming threat of full-scale regional conflict, specifically concerns regarding the closure of the Strait of Hormuz and the lack of clarity surrounding ceasefire negotiations, has introduced a "risk-off" sentiment across global markets.
### **🔹 Technical Landscape**
We are identifying two primary "Danger Zones" where bullish momentum is expected to exhaust:
1. **Primary Resistance:** The **27,300 – 27,500** range.
2. **Secondary Resistance:** The psychological ceiling at **28,100**.
---
### **📉 Proposed Trading Plan**
* **Short Entry Strategy:** Monitor for reversal patterns within the identified resistance zones (**27.3k – 27.5k** or **28.1k**).
* **Target 1:** **25,000** (Initial liquidity hunt).
* **Target 2:** **22,000** (Confirmed upon a sustained daily close below 25,000).
* **Final Corrective Target:** **18,000 – 19,000**.
* *Note: This represents a total peak-to-trough correction of approximately **30%**.*
### **⚠️ Risk Disclaimer**
Despite the compelling bearish thesis, price action remains volatile. We recommend waiting for a confirmed break of local support levels or a clear technical rejection from the resistance zones before committing to a high-exposure short position.
**Good luck to all traders.**
US100 Local Long!
HI,Traders !
#US100 is trading in an
Uptrend and the INDEX is
About to retest a horizontal
Support of 26122.0 and as
We are locally bullish biased
We will be expecting a
Local bullish rebound !
Comment and subscribe to help us grow !
Long / Short / Stay AwayWhile retailers are buying every dip at the ATH due to FOMO, big monies are taking profits. Sooner or later, retailers are trapped at high, and big monies have full of cash. At this moment, it is either Short or stay out of it. Don't you think so?
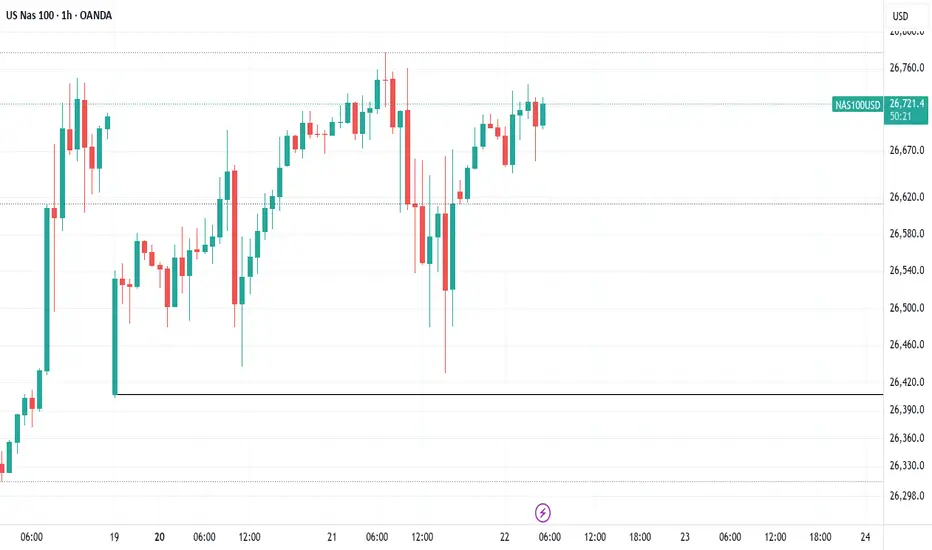
Bearish NAS100 Short Term Idea. OANDA:NAS100USD Looking at The Weekly Open on NAS100 this week starting 20 April,2026, Price has traded above the weekly open. My idea is that, last week proved to be heavily bullish, wide expansion. Should Today being Wednesday create the High of The Week or Thursday Create The High of The Week, then I would look at the 10AM New York open for optimal entry (in this case a rejection from the upside caused by the 9;30AM volatility) and target the weekly open on NAS100.
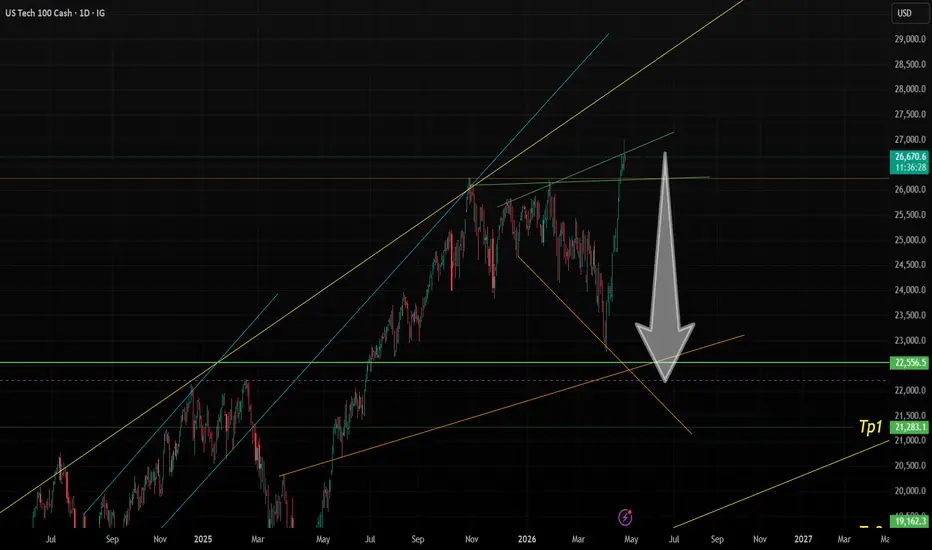
US 100! Be ready to a drop equal to 4000+ Moustafa MareiWell, it is one of those times when you see me saying so since my expectation of the last big drop of US 100
Here we go again
As you see on the chart on the day frame, that we will visit the top i pointed at!
Fundamentally no way to believe that US could allow Iran to keep the uranium and that will be the spark! or whatever could happen, that is not my problem now
What i see technically enforces that view strongly especially that we reached to a point where i can expect from here total exhaustion if the buying power and extreme push to the down side
May i be wrong yes, but worth to share my view with you as you always ask me to announce before the big moves take place
I expect a big drop too on Bitcoin to 68855 when majority of traders expect now more than ever, that Bitcoin will reach to 80,000 yes it will happen, but with the right moves and even later you will see Bitcoin reaches to 140,000 and will be pretty impossible to see Bitcoin week candle closes under 60.000 from now on
The black gold (oil) will shine again by the way!
I connected in last year my birth date on 26/8 with the big drop if you remember my post on Minds still
and we are not far at all from 26800
That drop will be significant and it is a complex of technical skills on the chart but I tried to draw it simply for you with the most critical levels, zones and lines!
Note:
Please do not share or copy my own work! It reflects my own vision and view to that index and it is advertised to not be taken as a legal advice for traders to follow, however, it is not more than an own opinion and analysis to be shared with you!
Good luck ;)
NDX Top Short! or..Two ways to short. At the top, like now, or on the CRACK!
Wave 3 up in the channel.
If you enjoy the work: 👉 Drop a solid comment. Let’s push it to 7,000 and keep building a community grounded in raw truth, not hype.
NASDAQ (NQ) – Short Bias Below ResistanceNASDAQ – Buy to Sell Setup 📉
Price pushed above recent highs to grab liquidity and is now showing signs of weakness.
With price back in a premium area, sellers are likely stepping in for a move lower.
Momentum is shifting, and this looks like a setup for continuation to the downside.
Bias: Bearish
Entry: Premium / resistance zone
Invalidation: Break and hold above highs
Targets: demand zone

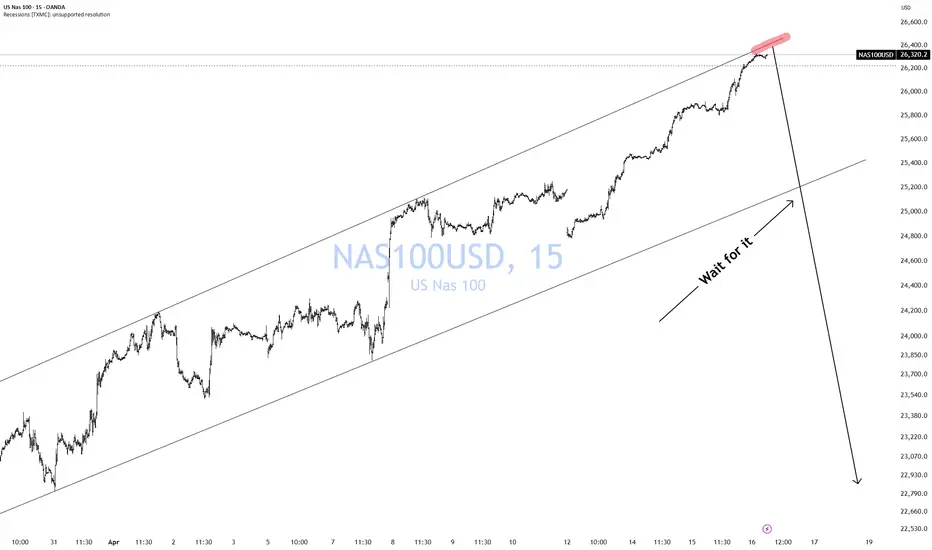
NASDAQ Channel Up is 'good until it's not'.Last week (April 20, see chart below), we took a short-term approach on Nasdaq (NDX) as it opened with the same gap down as the week before it (April 13):
This pattern is 'good until it's not'. In simple words, as long as the Channel Up holds and the 4H MA50 (blue trend-line) supports, the price should keep rising slowly on a short-term scale. As again we opened the week on a (small this time) drop, we can see the price targeting 27800.
If the 4H MA50 breaks, we expect a strong accelerated correction, targeting the 4H MA200 (orange trend-line) around 25200.
---
** Please LIKE 👍, FOLLOW ✅, SHARE 🙌 and COMMENT ✍ if you enjoy this idea! Also share your ideas and charts in the comments section below! This is best way to keep it relevant, support us, keep the content here free and allow the idea to reach as many people as possible. **
---
💸💸💸💸💸💸
👇 👇 👇 👇 👇 👇

NASDAQ 'The Channel Up of ceasefire'Nasdaq (NDX) has been rising non-stop within a Channel Up since the March 30 Low, which has accelerated at a historic pace ever since the first U.S. - Iran ceasefire rumors surfaced on April 07.
The pattern seems to be recurring with the 4H RSI and MACD sequences indicating the buy spots with the 4H MA50 (blue trend-line) supporting. Today the market opened with a gap down, which is exactly what happened last Monday on negative weekend news but the market instantly recovered.
As a result, as long as the 4H MA50 holds, every pull-back is a buy, targeting 27200. If the 4H MA50 breaks, we can see an accelerated decline towards the 4H MA200 (orange trend-line), targeting 24700.
---
** Please LIKE 👍, FOLLOW ✅, SHARE 🙌 and COMMENT ✍ if you enjoy this idea! Also share your ideas and charts in the comments section below! This is best way to keep it relevant, support us, keep the content here free and allow the idea to reach as many people as possible. **
---
Disclosure: I am part of Trade Nation's Influencer program and receive a monthly fee for using their TradingView charts in my analysis.
💸💸💸💸💸💸
👇 👇 👇 👇 👇 👇

US100 Is Very Bearish! Sell!
Take a look at our analysis for US100.
Time Frame: 1D
Current Trend: Bearish
Sentiment: Overbought (based on 7-period RSI)
Forecast: Bearish
The market is on a crucial zone of supply 27,301.2.
The above-mentioned technicals clearly indicate the dominance of sellers on the market. I recommend shorting the instrument, aiming at 24,690.5 level.
P.S
Please, note that an oversold/overbought condition can last for a long time, and therefore being oversold/overbought doesn't mean a price rally will come soon, or at all.
Like and subscribe and comment my ideas if you enjoy them!

NASDAQ100 Broke All Time HighNASDAQ 100,Broken out of previous ATH at 26278. Weekly solid performance indicates that the rally may continue towards 28650 level as short term target. Long term ABCD target 32688 is on the cards with some pauses/corrections of course. Right now it is reaching a trendline/channel top. So it will be interesting to see how it reacts in coming weeks i.e. either the rally will continue to hit short term target 28650 , or an immediate rejection from the trend line will trigger a short term correction/pullback towards 26300 area; the retest of recent breakout before going forward. Overall a very bullish outlook.

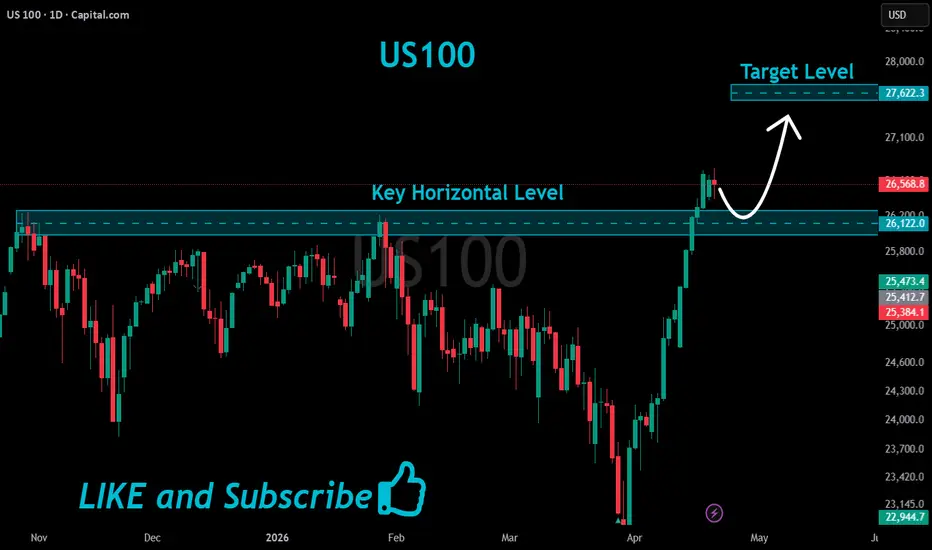
Nasdaq Clean Range Breakout | Momentum in Play NowHello Traders,
The US100 has been trading within a well-defined horizontal range, respecting both support and resistance levels over an extended period. This phase reflects a classic accumulation structure, where price compresses before expansion.
Repeated rejections from the resistance zone (highlighted) confirmed strong supply presence, while the support zone consistently attracted demand, preventing further downside.
Recently, price revisited the support area and reacted sharply, forming a strong bullish impulse. This move has now resulted in a decisive breakout above the range resistance, signaling a potential transition from accumulation to a markup phase.
Key Structural Insights:
Multiple failed attempts at resistance, confirming supply absorption
Strong demand reaction from support zone
Clear range-bound consolidation, indicating accumulation
High-momentum breakout, suggesting strength from buyers
Projection & Expectations:
The current breakout opens the door for a measured move, calculated using the height of the range projected upward from the breakout point.
At the same time, a retest of the breakout zone is still pending, which would be considered a healthy confirmation of the breakout. If price revisits this level and finds support, it can further strengthen the bullish continuation scenario.
As long as price sustains above the broken resistance, the structure supports a move toward higher levels.
Invalidation Scenario:
A sustained move back inside the range would indicate a failed breakout, potentially shifting the structure back into consolidation.
Conclusion:
The market appears to be transitioning from compression to expansion, and the breakout suggests increasing bullish momentum. A successful retest could act as a catalyst for the next leg higher.
Thanks for reading mates.
Regards- Amit.

The Market Rallied on Fantasy While Wall Street Masks the Truth
“The Market Illusion: Political Headline Games, Oil Reality, and the Rally That Defies Fundamentals”
Stocks Soar. Reality Deteriorates.
The S&P 500 and Nasdaq Composite sit near highs as if nothing is wrong.
But beneath the surface:
global GDP is being revised lower
recession risk is rising
private credit stress is worsening
inflation risks remain elevated
energy supply risks remain unresolved
And now an even louder warning has emerged:
👉 Major airlines are beginning to price in the energy shock the stock market still appears to ignore.
Airlines Are Pricing Reality. Wall Street Is Pricing Fantasy.
Three major U.S. airlines have slashed outlooks and reportedly warned of billions in additional fuel costs, with some guidance cuts near 50%.
Read that again.
Businesses that consume enormous amounts of fuel are preparing for a radically different cost environment.
They are not trading headlines.
They are pricing reality.
And that reality says:
Energy risk is rising.
While equity markets celebrate.
That disconnect is staggering.
If Airlines See It, Why Doesn’t the Market?
Airlines live and die by Crude Oil.
They cannot pretend paper barrels solve physical shortages.
They cannot ignore supply disruptions.
They cannot trade narratives.
They pay the real price.
And they are warning investors.
Which raises a brutal question:
👉 Why are operating companies pricing energy stress while equity indices act as if no shock exists?
The Oil Market Distortion
Critics argue this is where the illusion becomes obvious.
Despite geopolitical risk and supply concerns, oil repeatedly struggles near key levels.
Why?
Many point to massive paper positioning overwhelming physical signals.
Whether one calls that suppression or distortion, one fact remains:
👉 paper contracts do not replace physical supply.
And when physical shortages dominate pricing, derivatives cannot hide it forever.
Meanwhile Markets Keep Chasing a Headline Rally
A repeated pattern has emerged:
Political optimism headline
Stocks rip higher
Oil pressure eases temporarily
Contradictions emerge later
Markets move on as if nothing happened
This is not ordinary price discovery.
This increasingly looks like a market levitating on narrative.
The Warning Signs Keep Multiplying
While indices celebrate:
the Shiller P/E Ratio sits near historically extreme levels
growth is slowing
private credit cracks are widening
some Nasdaq firms face securities litigation
unusual trading activity around major announcements has drawn scrutiny
And now corporations exposed directly to fuel costs are effectively saying:
We see a shock coming.
That may be the clearest signal of all.
Companies Are Hedging for Pain While Investors Chase Momentum
This may be the most dangerous divergence in the market today.
Corporations are preparing for:
higher energy costs
weaker margins
slower growth
Meanwhile index buyers chase record highs.
One side is pricing cash flow risk.
The other is pricing euphoria.
Both cannot be right forever.
A Rally Built on Exit Liquidity?
Skeptics increasingly ask whether this melt-up resembles something darker:
A late-stage liquidity chase where higher prices pull in buyers…
while larger players quietly distribute risk.
Call it momentum.
Call it structural distortion.
But many call it something simpler:
👉 a trap.
Reality Usually Wins
Markets can ignore contradictions.
For a while.
They can ignore:
fuel shocks
valuation extremes
slowing growth
geopolitical instability
Until they can’t.
And when repricing comes, it tends not to be polite.
It tends to be violent.
Conclusion: The Market May Be Ignoring the Companies Living the Truth
This may be the most important signal investors are missing:
The companies consuming the fuel…
are warning.
The market speculating on the fuel…
is not.
That gap may define what comes next.
Because if airlines are already pricing billions in added fuel costs—
while equities celebrate all-time highs—
then someone is mispricing reality.
And history suggests it is usually the crowd.

NasdaqOn the Nasdaq, if the price fails to break through the 27373 level, I expect a short-term downtrend.
🔥Trading futures, forex, CFDs and stocks carries a risk of loss.
Please consider carefully whether such trading is suitable for you.
This content is not financial advice. Always conduct your own financial due diligence.
>>GooD Luck 😊
❤️ Like and subscribe to never miss a new idea!

27022 is a strong fibonacci levelHere is a simple analysis based on fibonacci levels in the monthly timeframe. The price of 27022 might be a strong resistance that could push the price back down.

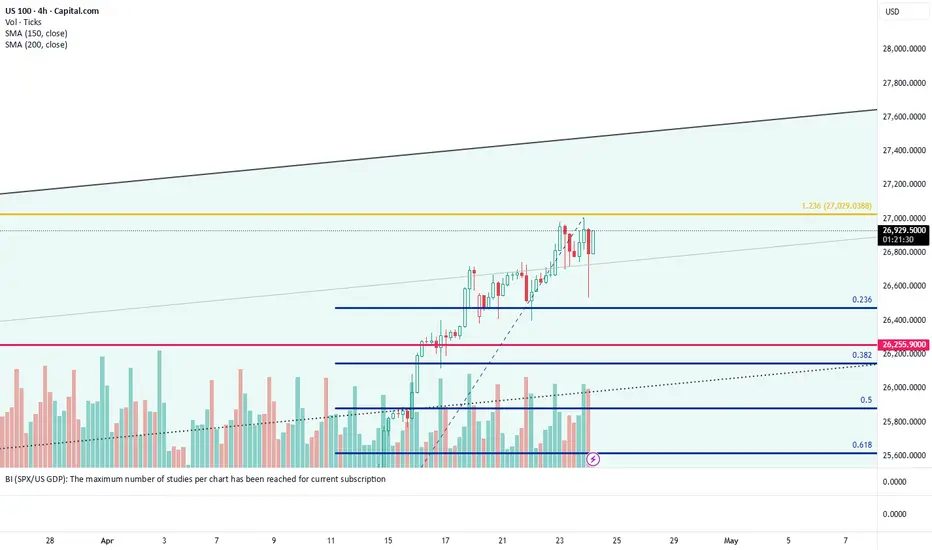
NASDAQ - Looking To Buy PullbacksH4 - Strong bullish move followed by a pullback.
No opposite signs.
Until the two Fibonacci support zones hold I expect the price to move higher further.
If you enjoy this idea, don’t forget to LIKE 👍, FOLLOW ✅, SHARE 🙌, and COMMENT ✍! Drop your thoughts and charts below to keep the discussion going. Your support helps keep this content free and reach more people! 🚀
--------------------------------------------------------------------------------------------------------

NAS100 Sell-OffThe NAS100 is currently testing a significant all-time-high region while pressing into the upper boundary of a rising channel. This creates a potential exhaustion setup rather than a confirmed bearish reversal. The recent advance has been aggressive and price appears extended relative to the channel structure, suggesting that upside momentum may be vulnerable to profit-taking if buyers fail to maintain acceptance above the high. A valid short thesis would require confirmation through a failed breakout, such as a sweep of the all-time high followed by a close back below the upper channel boundary or the most recent breakout area. If that rejection develops, the first downside objective would be the recent breakout shelf, followed by the channel midpoint and lower value areas. A deeper continuation of the rejection could target the 24,500 region, which aligns with the lower projected channel/value area shown on the chart. The setup would be invalidated by a strong close and sustained acceptance above the all-time-high zone, which would indicate continuation rather than exhaustion.

US100 Weekly : approaching to recent Top around 28k ?Applying reverse fib, we may find that we have already entered a selling zone from 26k to 28k.
Weekly divergence is slowly appearing on the chart.
Around this zone approaching to 28k, we will make a 2nd top and then a healthy correction will be seen till 20k-18k.
let's see how it plays in the end.

27,000 Trap ZoneVANTAGE:NAS100 Price is currently pushing higher and I’m expecting a test of the 27,000 area, aligning with:
• Descending trendline resistance
• Premium PD Array (unfavorable for longs)
• Prior distribution zone where sellers stepped in
This makes 27,000 a high probability reaction zone.
CAPITALCOM:US100 If price reaches this area and shows rejection, I’m looking for a move back down toward 26,800, where we previously saw demand and internal liquidity.
Why this setup makes sense:
• Price is moving from discount into premium → better area for shorts
• Trendline acting as dynamic resistance
• Previous bearish displacement leg came from this region
• OG zones show supply pressure above
Entry will be based on:
• Bearish rejection candle on 15M or 5M at/near 27,000
• Weak continuation attempts (wicks, no acceptance above)
• Volume spike on rejection confirming sellers stepping in
Target: 26,800
Invalidation: Clean acceptance and hold above 27,000
This is a premium delivery → rejection → downside continuation setup.
If price breaks and accepts above, we don’t fight it… we flip bias.
