Key stats
About iShares Bitcoin Trust
Home page
Inception date
Jan 5, 2024
Structure
Grantor Trust
Replication method
Physical
Dividend treatment
Capitalizes
Distribution tax treatment
Ordinary income
Income tax type
Capital Gains
Max ST capital gains rate
39.60%
Max LT capital gains rate
39.60%
Primary advisor
BlackRock Fund Advisors
Identifiers
3
ISIN US46438F1012
Established on June 8, 2023, iShares Bitcoin Trust (IBIT) was launched by BlackRock, a leading global asset manager and ETF provider. The trust allows investors to incorporate Bitcoin into a standard brokerage account. In addition to its pricing aspect, IBIT's appeal lies in its ability to alleviate the operational challenges linked to the direct holding of Bitcoin, along with the potential mitigation of substantial trading expenses and complexities in tax reporting.
Related funds
Classification
Symbol
Geography
Global

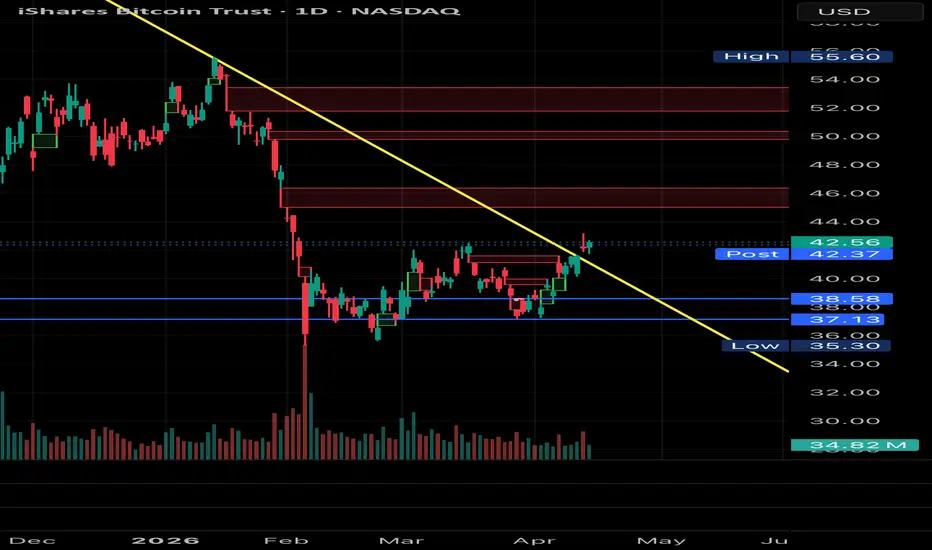
IBIT & BTC To fill the gaps?!We have a breakout of the daily down trend that was established in Oct. 2025.
We have now broken out of said trend line while forming a dbl bottom “W” reversal formation.
Currently IBIT is showing that it is above the neckline of that dbl bottom. (BTC hasn’t quite broken it yet)
Idea here are 5/2
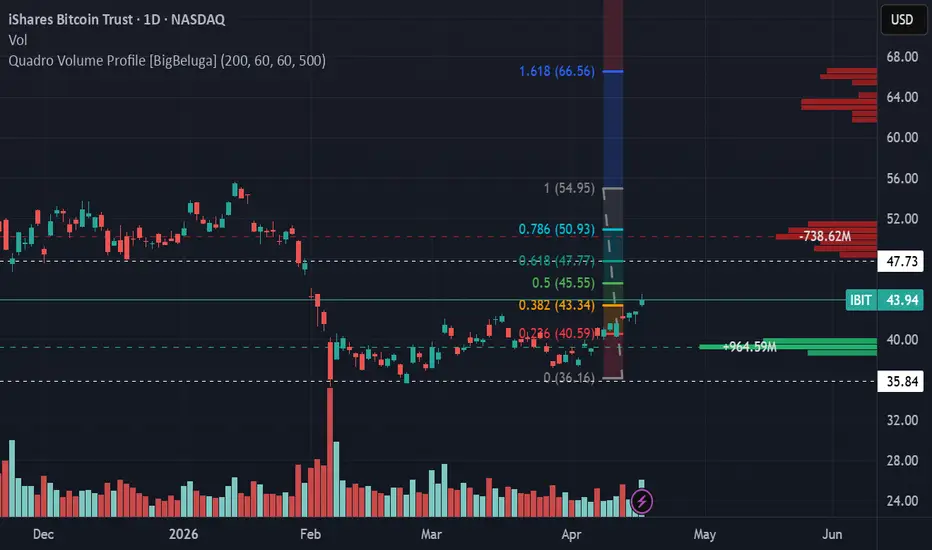
Bullish bitcoin options call flowSorry, I have not posted in awhile. I have mainly been swinging gold and silver 2x etfs.
Seasonailty - Bitcoin ETF has a good rating for april and may.
Options data - There are over 99,000 $45 call options OI in May 15, 2026 expiry
iSHARE Bitcoin ETF - Part 2 - Sailing against the currentsA visual walkthrough using sailing as analysis.
Here you see how to combine multiple pitchfork for analysis

IBIT Long Position Trade [29 Jan 2026]29 Jan 2026
Took a smaller long position on IBIT (less than 10% of portfolio) with an average entry around $46.36, accounting for its higher volatility by setting a wider stop loss. Entry is based on a reaction from a key support zone after a sharp sell-off, with price showing signs of stabilisatio

Opening (IRA): IBIT March 20th -43P... for a 1.30 credit.
Comments: Adding at intervals at strikes/break evens better than what I currently have on.
Metrics:
Max Profit: 1.30 ($130)
Buying Power Effect: 41.70
ROC at Max: 3.12%
Will generally look to take profit starting at 50% max or take assignment of shares and sell call again

Assignment: IBIT at $46/shareThe last rung of short puts on which I will be assigned shares. I still have a -42P that I rolled out to April on which I could be assigned, but will roll that down and out if that continues to be productive from a credit received standpoint.
Will look to sell call against once the shares are in m

Assigment: IBIT at $48/shareI haven't been assigned these yet, but will be after today.
Will look to sell call against once they're in my account, gradually reducing my break even over time.

Assignment: IBIT at $52/shareI haven't been assigned these yet, but will be after today.
Will look to sell call against once they're in my account, gradually reducing my break even over time.

Opening (IRA): IBIT March 20th -46P... for a 1.42 credit.
Comments: Adding/laddering out at intervals at the 25 delta strike, assuming I can get in at break evens/strikes better than what I currently have on.
Metrics:
Max Profit: 1.42 ($142)
BPE: 44.58
ROC at Max: 3.19%
Will generally start to look to take profit at 50% max/roll

See all ideas
Summarizing what the indicators are suggesting.
Oscillators
Neutral
SellBuy
Strong sellStrong buy
Strong sellSellNeutralBuyStrong buy
Oscillators
Neutral
SellBuy
Strong sellStrong buy
Strong sellSellNeutralBuyStrong buy
Summary
Neutral
SellBuy
Strong sellStrong buy
Strong sellSellNeutralBuyStrong buy
Summary
Neutral
SellBuy
Strong sellStrong buy
Strong sellSellNeutralBuyStrong buy
Summary
Neutral
SellBuy
Strong sellStrong buy
Strong sellSellNeutralBuyStrong buy
Moving Averages
Neutral
SellBuy
Strong sellStrong buy
Strong sellSellNeutralBuyStrong buy
Moving Averages
Neutral
SellBuy
Strong sellStrong buy
Strong sellSellNeutralBuyStrong buy
Displays a symbol's price movements over previous years to identify recurring trends.
Frequently asked questions
An exchange-traded fund (ETF) is a collection of assets (stocks, bonds, commodities, etc.) that track an underlying index and can be bought on an exchange like individual stocks.
IBIT trades at 43.56 USD today, its price has fallen −1.04% in the past 24 hours. Track more dynamics on IBIT price chart.
IBIT net asset value is 44.00 today — it's risen 9.51% over the past month. NAV represents the total value of the fund's assets less liabilities and serves as a gauge of the fund's performance.
IBIT assets under management is 63.14 B USD. AUM is an important metric as it reflects the fund's size and can serve as a gauge of how successful the fund is in attracting investors, which, in its turn, can influence decision-making.
IBIT price has risen by 15.25% over the last month, and its yearly performance shows a −18.76% decrease. See more dynamics on IBIT price chart.
NAV returns, another gauge of an ETF dynamics, showed a −13.41% decrease in three-month performance and has decreased by −17.20% in a year.
NAV returns, another gauge of an ETF dynamics, showed a −13.41% decrease in three-month performance and has decreased by −17.20% in a year.
IBIT fund flows account for 24.71 B USD (1 year). Many traders use this metric to get insight into investors' sentiment and evaluate whether it's time to buy or sell the fund.
Since ETFs work like an individual stock, they can be bought and sold on exchanges (e.g. NASDAQ, NYSE, EURONEXT). As it happens with stocks, you need to select a brokerage to access trading. Explore our list of available brokers to find the one to help execute your strategies. Don't forget to do your research before getting to trading. Explore ETFs metrics in our ETF screener to find a reliable opportunity.
IBIT expense ratio is 0.25%. It's an important metric for helping traders understand the fund's operating costs relative to assets and how expensive it would be to hold the fund.
No, IBIT isn't leveraged, meaning it doesn't use borrowings or financial derivatives to magnify the performance of the underlying assets or index it follows.
In some ways, ETFs are safe investments, but in a broader sense, they're not safer than any other asset, so it's crucial to analyze a fund before investing. But if your research gives a vague answer, you can always refer to technical analysis.
Today, IBIT technical analysis shows the buy rating and its 1-week rating is sell. Since market conditions are prone to changes, it's worth looking a bit further into the future — according to the 1-month rating IBIT shows the sell signal. See more of IBIT technicals for a more comprehensive analysis.
Today, IBIT technical analysis shows the buy rating and its 1-week rating is sell. Since market conditions are prone to changes, it's worth looking a bit further into the future — according to the 1-month rating IBIT shows the sell signal. See more of IBIT technicals for a more comprehensive analysis.
No, IBIT doesn't pay dividends to its holders.
IBIT trades at a premium (0.05%).
Premium/discount to NAV expresses the difference between the ETF’s price and its NAV value. A positive percentage indicates a premium, meaning the ETF trades at a higher price than the calculated NAV. Conversely, a negative percentage indicates a discount, suggesting the ETF trades at a lower price than NAV.
Premium/discount to NAV expresses the difference between the ETF’s price and its NAV value. A positive percentage indicates a premium, meaning the ETF trades at a higher price than the calculated NAV. Conversely, a negative percentage indicates a discount, suggesting the ETF trades at a lower price than NAV.
IBIT shares are issued by BlackRock, Inc.
IBIT follows the CME CF Bitcoin Reference Rate - New York Variant - Benchmark Price Return. ETFs usually track some benchmark seeking to replicate its performance and guide asset selection and objectives.
The fund started trading on Jan 5, 2024.
The fund's management style is passive, meaning it's aiming to replicate the performance of the underlying index by holding assets in the same proportions as the index. The goal is to match the index's returns.